7 Population genetics Evolution
Population Genetics and Evolution
Diversity from the gene to the community
Genes, Individuals, Species, Communities
Equation: S = 4Nu
Population Genetics vs Transmission Genetics
Population Genetics: Concerned with the frequency of particular genes and genotypes within a population.
Transmission Genetics: Deals with expected ratios of offspring genotypes based on parent genotypes.
Definition of a Population
A group of interbreeding individuals localized in time and space belonging to a single species.
Example: Population 1, Population 2.
Understanding Frequency
Frequency: The proportion of a specific type of object within a group.
Frequencies are properties of populations, not individuals.
Frequencies sum to 1 and range from 0 to 1.
Example Calculation:
Frequency[dimpled individuals] = number of dimpled individuals / total number of individuals = 92 / 150 = 0.613.
Gene Transmission to Offspring
Genes are inherited from parents to offspring.
Genes combine to form genotypes, which determine phenotypes (observable traits).
If certain individuals do not breed due to various reasons, they cannot pass on their genes, influencing population genetics.
Example: Natural selection as a restricting factor.
Defining Evolution
Evolution: A change in gene frequency from one generation to the next in a population.
Influences on gene frequency include migration and mutation.
New types of genes can enter the population.
Evolutionary Change Factors
Components that may cause evolution include:
Mutation: New gene variations introduced over generations.
Migration: Movement of individuals into or out of a population.
Selection Pressure: Factors preventing individuals from reproducing, can be either random (genetic drift) or non-random (natural selection).
Representation of Population Evolution
Population Evolution Illustration: Changes in phenotypic traits over generations illustrated by colored dots:
Generation 1: High variation in phenotypes.
Generation 150: Reduced genetic variation (more red dots).
Evolutionary Forces Producing Change
Forces that produce evolutionary change include:
Mutation: Changes across generations, albeit less likely.
Migration: Influence of new individuals entering or leaving the population.
Natural Selection: Non-random survival and reproduction based on fitness.
Genetic drift: Random changes in gene frequency due to chance events.
Example of Natural Selection
Variation in coat color in rabbits influenced by predation:
Dark red rabbits survive better against predation due to camouflage.
Over generations, higher frequency of dark coloring due to selection pressure from wolves.
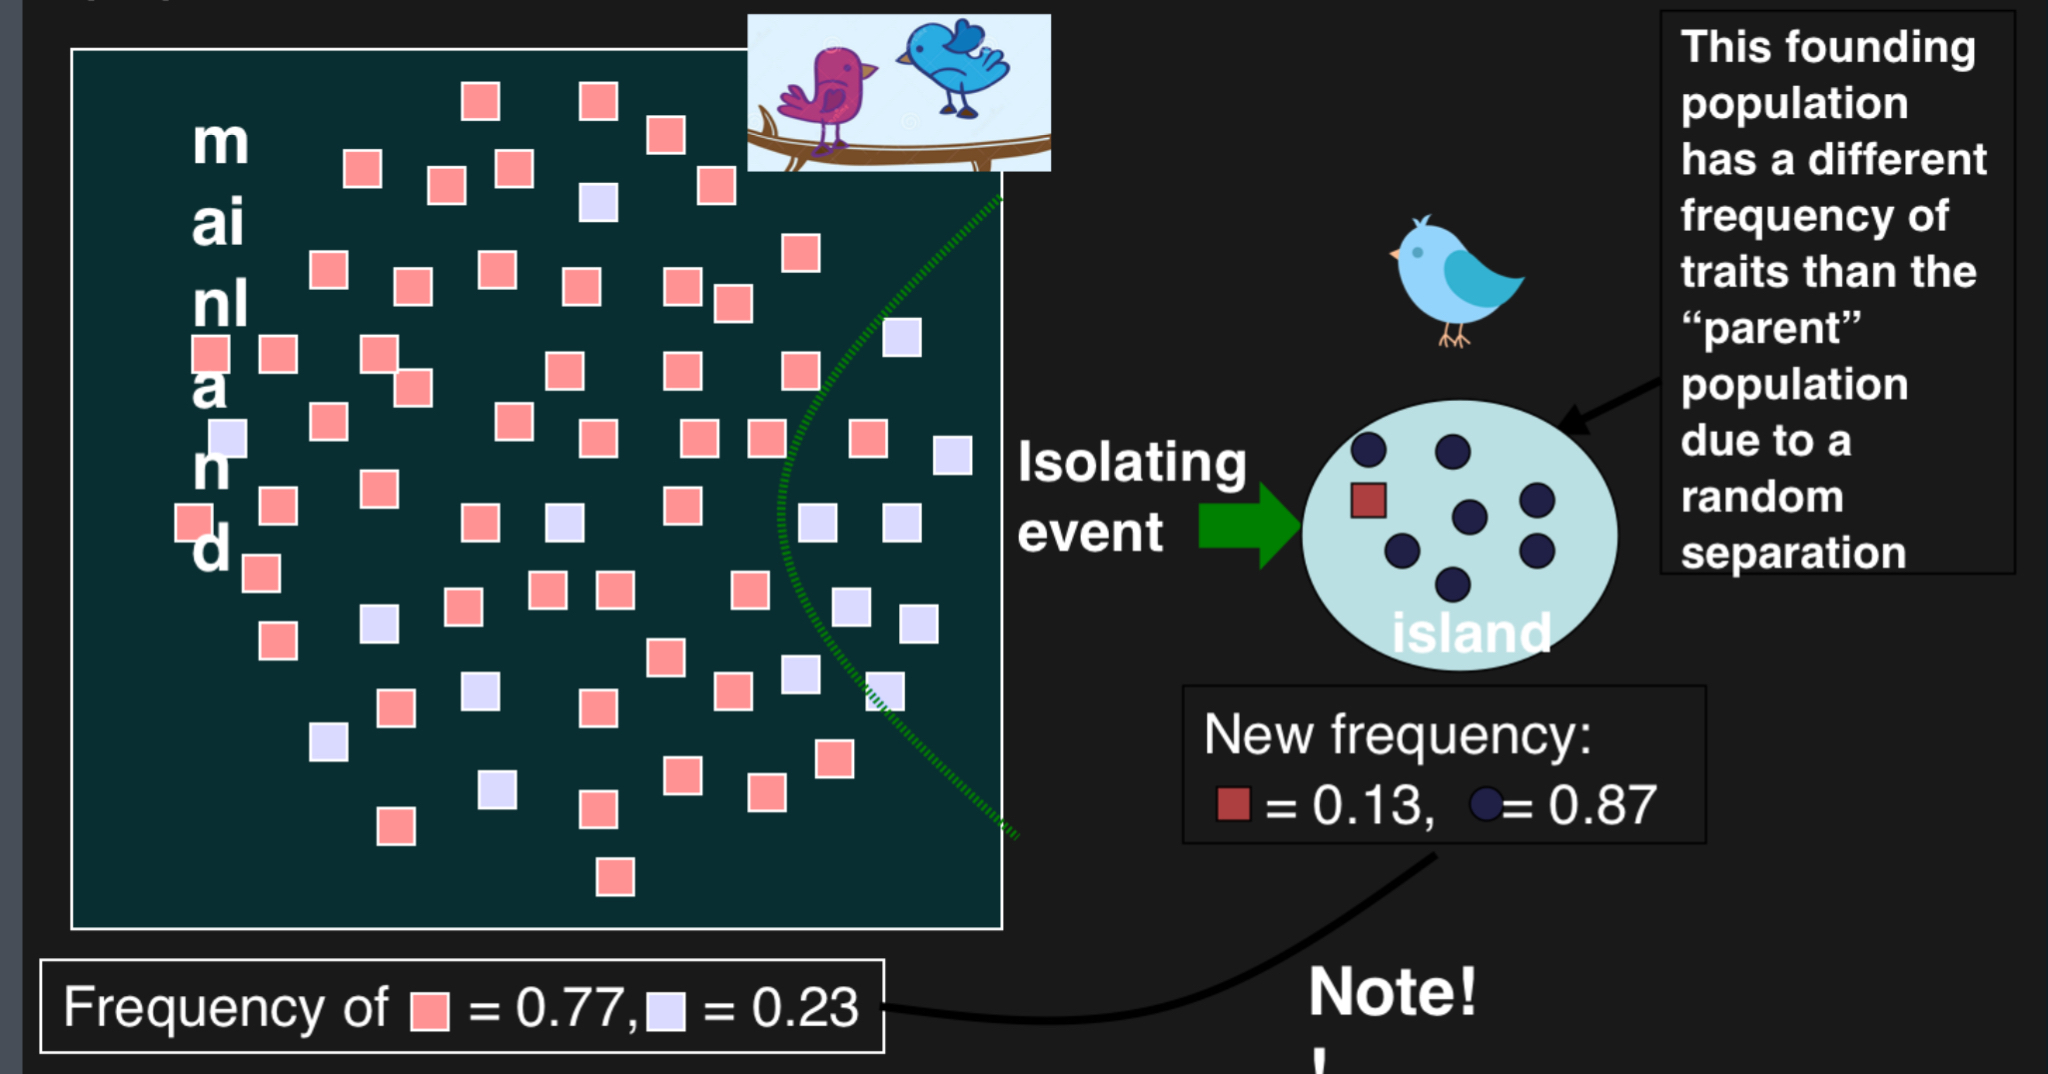
Genetic Drift
Genetic Drift: Random changes in gene frequency due to chance events.
It can lead to random loss or predominance of traits and can be especially pronounced in small populations.
“Genetic” refers to the frequency
“Drift” refers to the fact that the genes at a particular locus will change in frequency at whim—drift around.
The founder effect: Rare individuals (and the genes they carry) become prevalent due to disproportionate frequencies in an initial breeding population
Complications in Genotype-Phenotype Relationships
Interaction between genotype and environmental variables influences phenotypic expression:
Environment can enhance or constrain traits; examples include nutrition and sunlight exposure.
Pleiotrophy: When a single locus controls more than one trait
Continuous Traits and Their Variation
Continuous Traits: Traits without clear categories influenced by multiple loci:
Example: Height is a continuous trait typically distributed in a bell curve fashion.
Continuous traits are sometimes referred to as polygenic traits.
The key is to note that each gene at a locus contributes to the same trait—and with several loci contributing to the same trait. More genes = more variation in the trait and with lots of variation, the trait takes on a bell-curve shape.
They get their bell-shaped distribution because many loci all contribute to the trait.
Continuous traits are also called polygenic traits. They tend to be more influenced by the environment (meaning for a given genotype, the phenotype (trait) will have slightly different values as shown with the dimple/sunlight example)
Selection on Continuous Traits
Directional Selection: Favoring individuals at one extreme of a trait distribution.
Example: The distribution of height will shift to a higher value over time because they are stronger(over generations)
Stabilizing Selection: Favoring average individuals in a trait distribution.
The distribution of height will shift toward the average value over time (over generations). Fewer and fewer shirt and tall people
Disruptive Selection: Favoring extreme phenotypes, disregarding average ones.
Selection eliminates the unfit “average” individuals.
The distribution of height will shift toward eachextreme value over time (over generations)