10/6
Three approaches to Value
USPAP Step 6: 3 approaches to estimating market value
sales comparison approach—> indicated value
costs approach—> indicated value
income approach—> indicated value
cost approach- how much would it cost to replace the subject
sales comparison approach- how much have properties similar to the subject sold for?
income approach- how much income does the subject generate?
direct capitalization (direct cap)
discounted cash flow (DCF)
general references for 3 approaches to value
income approach
property must be income producing
reliable income & expense data must be available
comparable sales approach
must be active market for property type
sufficient amount of sales data must be available
must be comparable
cost approach
cost must indicate value
sufficient amount of cost data must be available
Cost Approach
how much would it cost to replace the subject?
buyers perspective
why would i pay $150 psf when I can build the same thing for $125 psf?
underlying assumption
the cost of creating a property is related to its market value
strengths
keeps real estate values rooted in the “real world”, combats asset bubbles
adds “developer” to perspective to analysis
weaknesses
depreciation can be hard to measure
estimating cost requires some construciction knowledge
investors may not care how much it cost to build if the income meets requirements
procedure
estimated replacement cost of improvements- estimated accrued depreciation= depreciation cost of building improvements+ estimated value of land= cost approach value
sales comparison approach
how much have propertities similar to the subject sold for?
buyers perspective
why would I pay $150 psf when I can build the same thing for $125 psf
underlying assumption
value can be determine dby analyzing the safe prices of similar properties, becasue propertties compete for buyers and users
strengths
demonstraates whether there is an active market for the subject
gives a range of reasonable values
weaknesses
sale data is usually limited. actual similarity to the subject can vary significantly
knowledge of sale conditions is usually limited
adjustments are diccicult to quantify
easy to manipulate
income approach
how much income does the subject generate?
buyers perspective
will the subject supply the magnitude of income I need, at the time I need it, with the appropriate risk
underlying assumption
the value of a real estate asset can be estimated from the present value of its future anticipated income
strengths
the is the primary way the market values income generating real estate assets
weaknesses
value can be tied more to the likehood tenants will continue paying rent than to the underlying costs
deriving capitalization rates and discount rates can be highly subjective
procedure
direct capitalization
divide a single year of income by a capitalization rate (cap rate)
discounted cash flow
add multiple years of income, discounted annually, to the safe price of the property at the end of the holding period (reversion)
income approach- direct cap
direct capitalization
value is expressed as a relationship between the
net operating income (NOI) and the
capitalization rate (cap rate)
this is an inverse relationship
rate goes down value goes up
rate goes up, value goes down
similar to valuing a stock using a price/earnings multiple
direct capitalization
IRV
income (NOI)= rate*value
rate=income (NOI)/value
value=income (NOI)/rate
income approach-discounted cash flows
procedure
project annual cash flows (NOI) for a holding period
discounted year 1-10 CF at the appropriate rate
use year 11 CF to calculate reversion
add discounted cash flows or years 1-10, plus the reversion
estimates intrinsic value based on present value of future anticipated income
how do DCF and Direct cap differ?
both models require a calculation of net operating income (NOI), which is the “cash flow” to the owner
direct capitalization requires:
first year net operating income (NOI)
selection of an applicable cap rate
DCF valuation requires:
estimate of holing period
estimates of annual CF (NOI) over the holding period, including rom the reversion (expected sale of the property)
selection of discounted rate (based on OCC or IRR)
Real estate income and property classes
Income approach
often called “income capitalization”
capitalize- the process of converting future income into a present value
our discussion will focus on existing, improved properties
real estate development (ground up construction) has slightly different considerations
value depends on…
magnitude of expected cash flows
timing of expected cash flows
riskiness of expected cash flows
real estate income
in most cases, real estate income is in the form of rents generated by a lease agreement. leases are the “economic engines” that drive the real estate industry
rent can be expressed in different ways:
$ per month or per year
$ per square foot annually
$ per square foot monthly
real estae operating expenses
operating expense (OpEx) of real estate
costs associated with the operating and maintenance of income producing property
should include all expenditures required to operate the property and command market rents
most common categories of real estate operating costs:
property taxes
insurance
maintenance
by default, these costs are the responsibility of the property owner (landlord)
however, the responsibility for these expense is often modified by a contract (lease) between the owner (landlord) and occupant (tenant)
lease structure- who pays what?
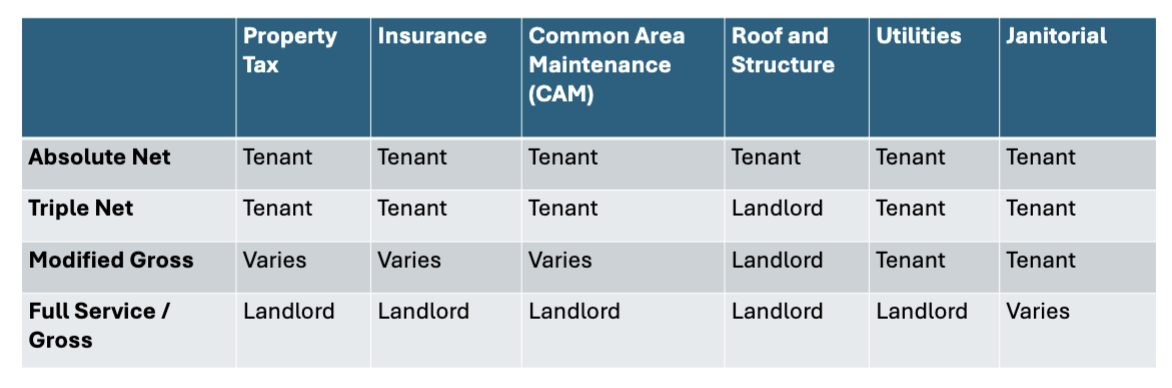
full service/gross lease structures
tenant pays a fixed rental fee and has no obligation to pay/ reinmburse any of the landlords operating costs
does not modify the landlords “default” responsibility for all operating costs
all operating costs risk is on the landlord
the ret paid is “pure” rent
tenant pays a specified amount of money for the use of the premises
most common residential lease structure
also common in other property types. also known as a full-service lease
net lease structures
tenant pays “base” rent and also reimburses landlord for some share of operating costs
operating costs risk is now “pass throught” to the tenant and rent is “net” profit to the landlord
commonly used when an entrire building is being leases
triple net (NNN) is most common. tenant pays all (1) property taxes, (2) insurance and (3) maintenance
rent analysis
the starting point for calculating NOI is potential gross income (PGI)
our perspective is that of the landlord (owner) receiving the cash flows
lease structures determine PGI, but property don’t impact NOI.
landlords arent “donating” the expenses they pay
if an expense is includedin the rental rate, the rental rate shoulf increase accordingly
common lease provisions
inital lease term- how long the lease will last
1-5 years for smaller tenants
up to 20 years for build to suit
month to month not desirable, a buyer will try to get these tenants to renew or move out
renewal option- additional term speculated in the lease
common: 1 to 4 options, 3 to 5 years each
there is usally a stated rent increase or provision for increase based on CPI or renegotiation
escalations- periodic increase in the rental rate
becasue of inflation, most landlord prefer to increase over time to account for increases in operating cost
this allows the landlord to pass along to the tenant increase in the costs, such as property taxes, utility chargers or insurance costs
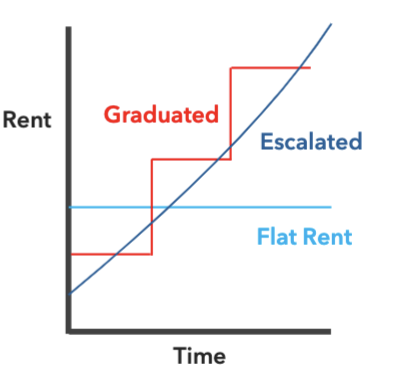
“flat” rent remains constnt over the entire lease term
rents can be “stepped up” or graduated
could be percentage, like 2% annually or equivalent (10% every 5 years)
per square foot also common, ($1.50 psf every 2 years)
rents can be “escalated” annually ( y CPI or some other index)
percentage rent
additional rent paid to landlord as a percentage of tenants business operations
effective way to share risk and aslign the incentives of the landlord and tenant
built-in inflation hedge to the extent that inflation causes the tenants receipts to increase
common in retail and resturant leases
property classes: class A
command highest rents becasue they are most prestigious in their tenancy,location and overall desitability
usually newer structures
favored by insitutional investors
top amenitites, high-income earning tenants and low vacancy rates
well located in the market
little or no deferred maintenance issues
class B:
rents usally less than class A buildings becasue of less desirable location,fewer amenitities, less impressive lobbies, elevators
generally older than class A, tent to have lower income tenants
generally well mainained, but some deferred maintenance issues are typical
many investors see this as a “value-add” investment opportunity
with renovation and common are improvements, the property can be upgrafed to class A
class C:
usally once class A or B
are older and “ reasonably” maintained
are below current standards for one or more reasons
typically more than 20 years old
often located in less than desirable locations
generally in need of renovation, including updating the building infrastructure
tend to have the lowest rent rates
some need significant repositioning to get to stready cash flows