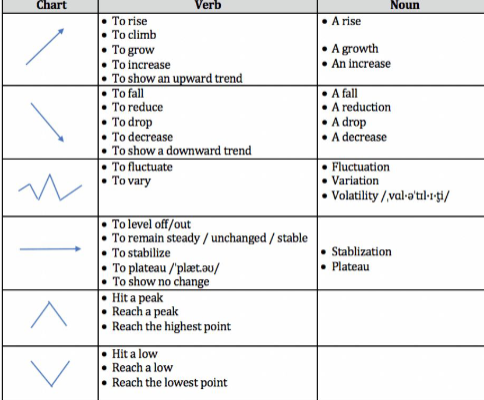
Charts with trends
POWERS
P : prewrite
O : Organize
W : Write
E : Evaluate
R : revise
S : Share
from … to … = between … and …. = over a period of … years
spending on / for = expenditure on / for
people in the US = Americans
at the age of… = the…age group = people aged… = …-year-old people
Paraphrase:
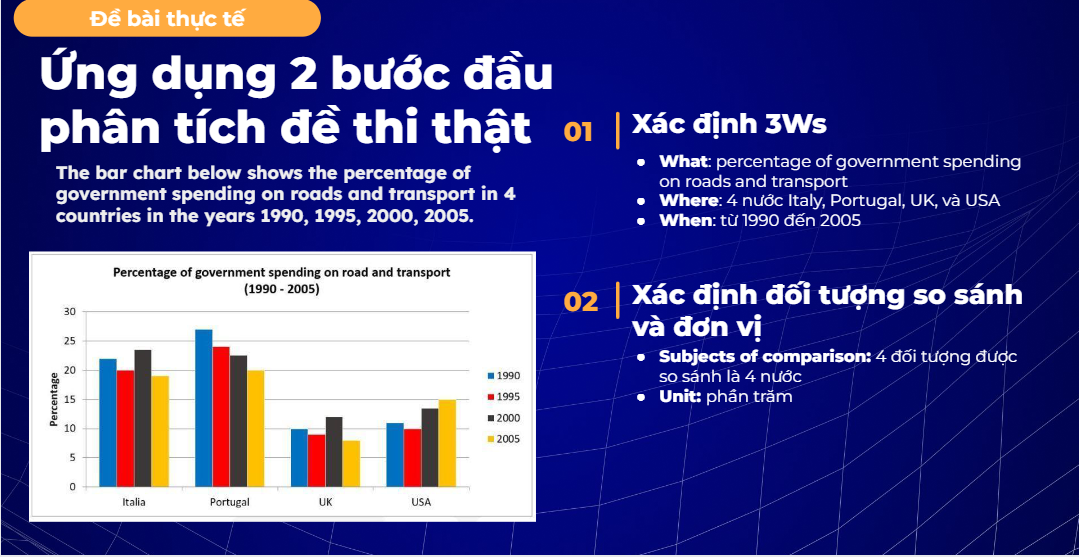
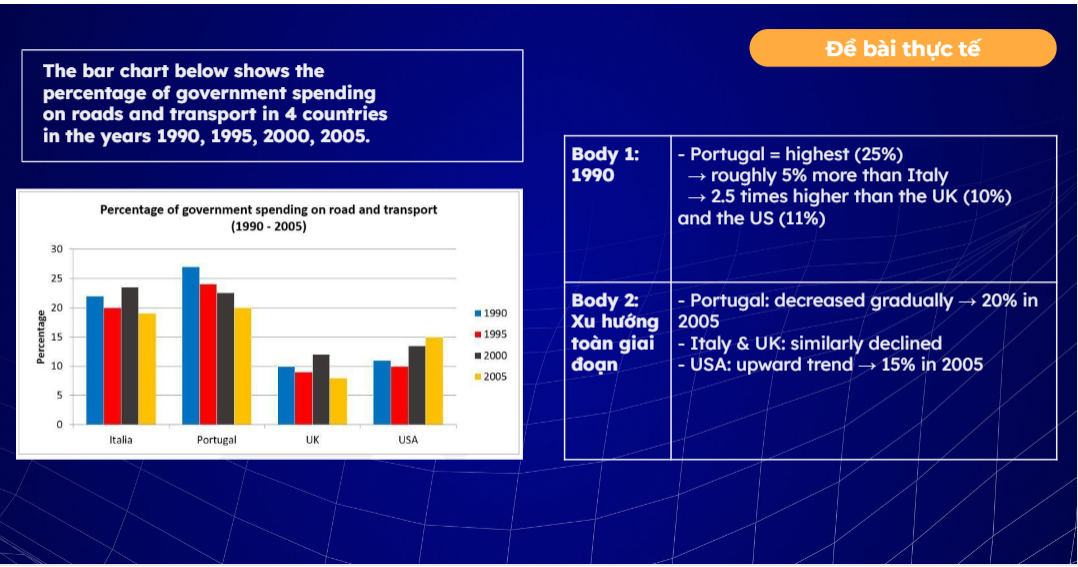
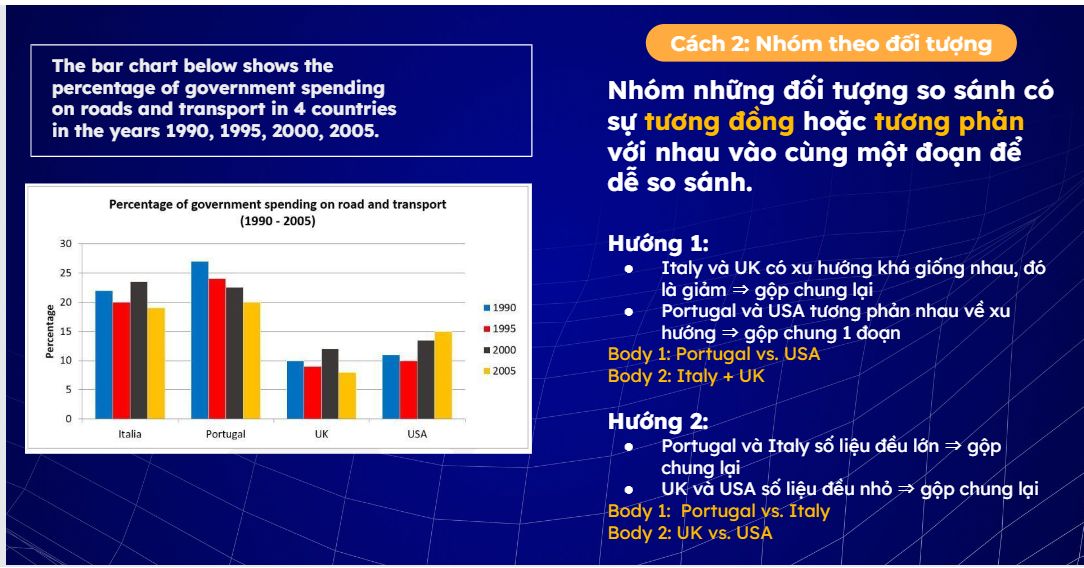
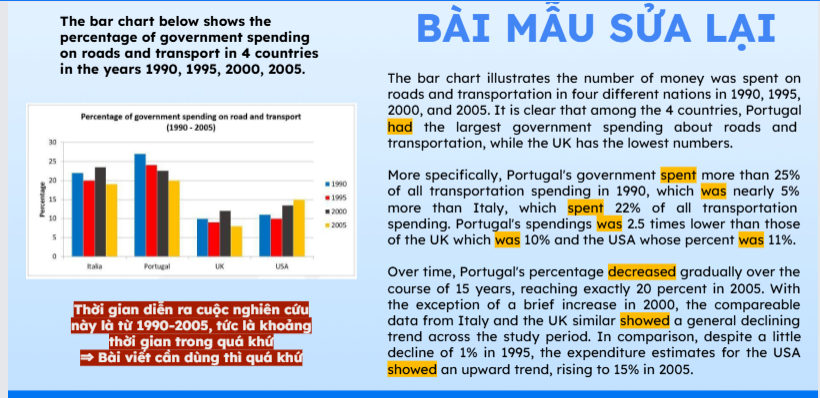
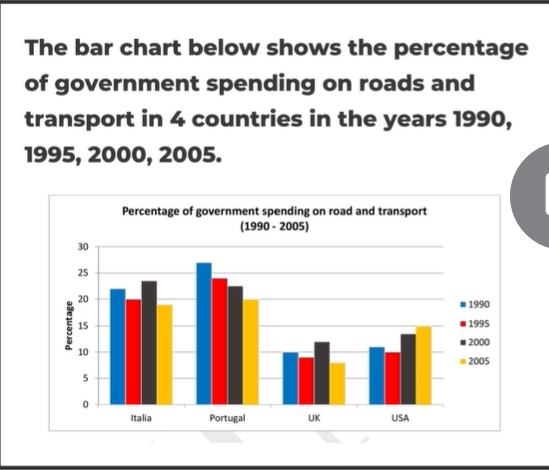
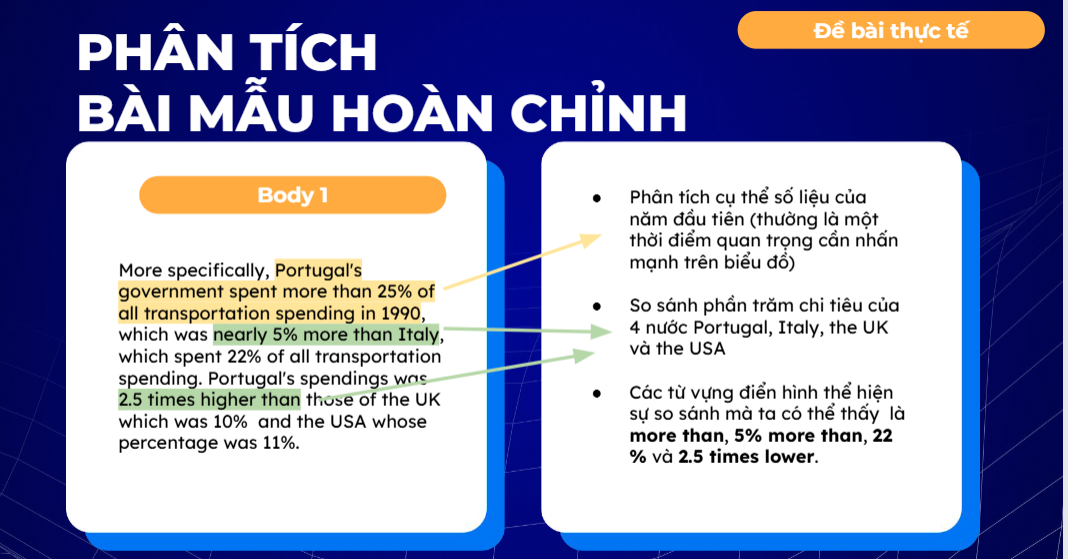
The bar chart illustrates how much the governments in Italy, Portugal, the UK, and the US spent on roads and transport in four selected years.
Có hướng Overview
Xu hướng tổng quát (tăng, giảm, dao động)
→ Charts with trends
Điểm nổi bật nhất (cao nhất, thấp nhất)
→ Charts of comparison
-Overall,
-Generally,
-In general,
-It is clear / evident that + S + V
It is clear that Portugal had the highest governmental spending on roads and transport while the UK had the lowest figures among the four countries.

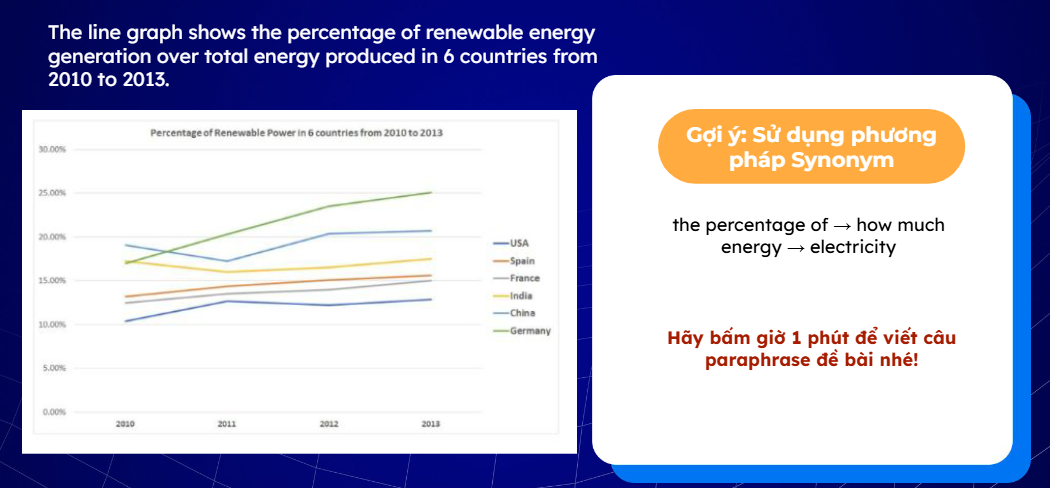
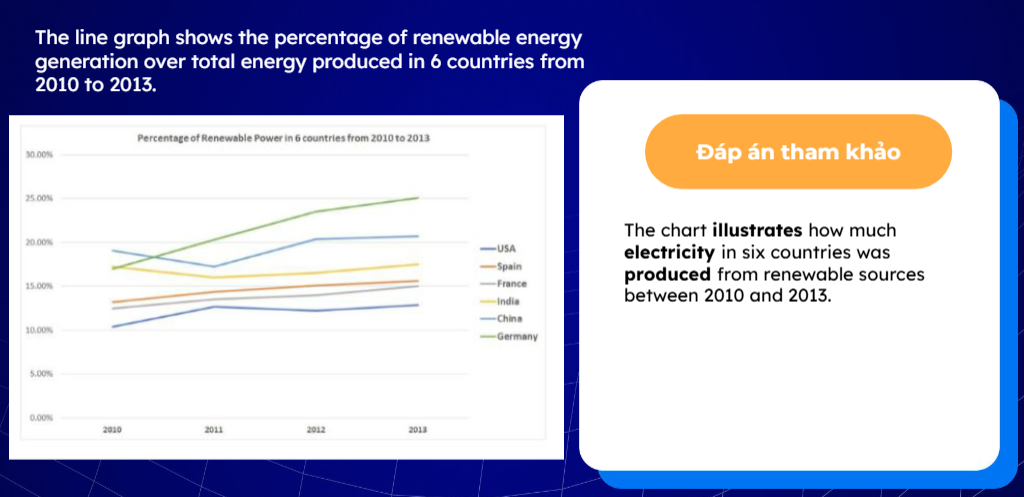
energy - electricity
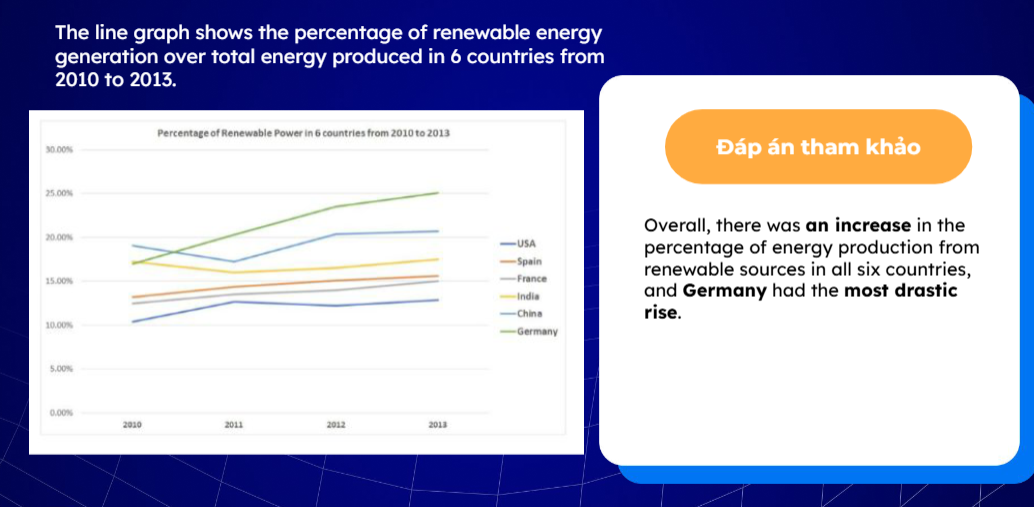
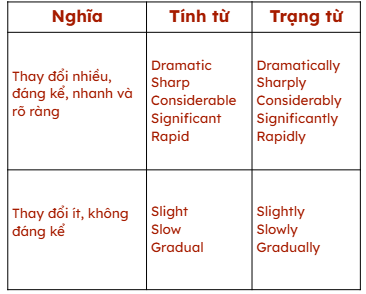
drastic rise : sự gia tăng mạnh mẽ
decrease gradually : giảm dần
similarly declined : giảm tương tự
a litter declined :
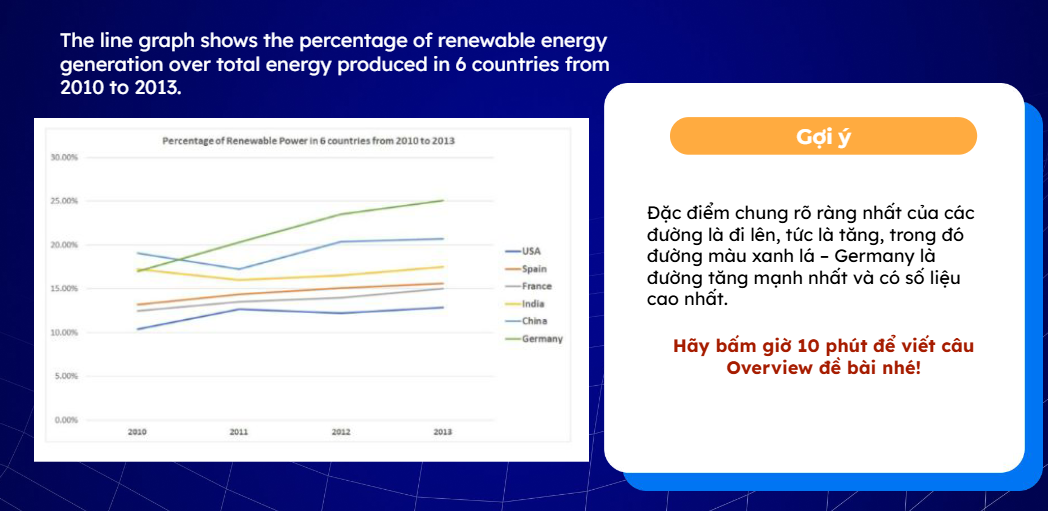
showed an upward trend