01 Decision Trees
Decision Trees
for both regression and classification tasks.
They categorize data based on attribute values, creating a tree structure.
Structure of a Decision Tree
Definition and Terminology
A decision tree splits data based on attribute values, creating bins or regions that classify output:
Root Node: The starting point of the decision tree using an important attribute.
Internal Nodes: Nodes that split the data based on an attribute threshold.
Leaf Nodes: Endpoint nodes that give predictions (e.g., predicted log-salary).
Example of a Regression Tree
Advantages of Decision Trees
Interpretability: Decision trees are easy to understand and explain, making them suitable for communication with non-experts.
Automatic Variable Importance: Attributes closer to the root are more significant for predictions.
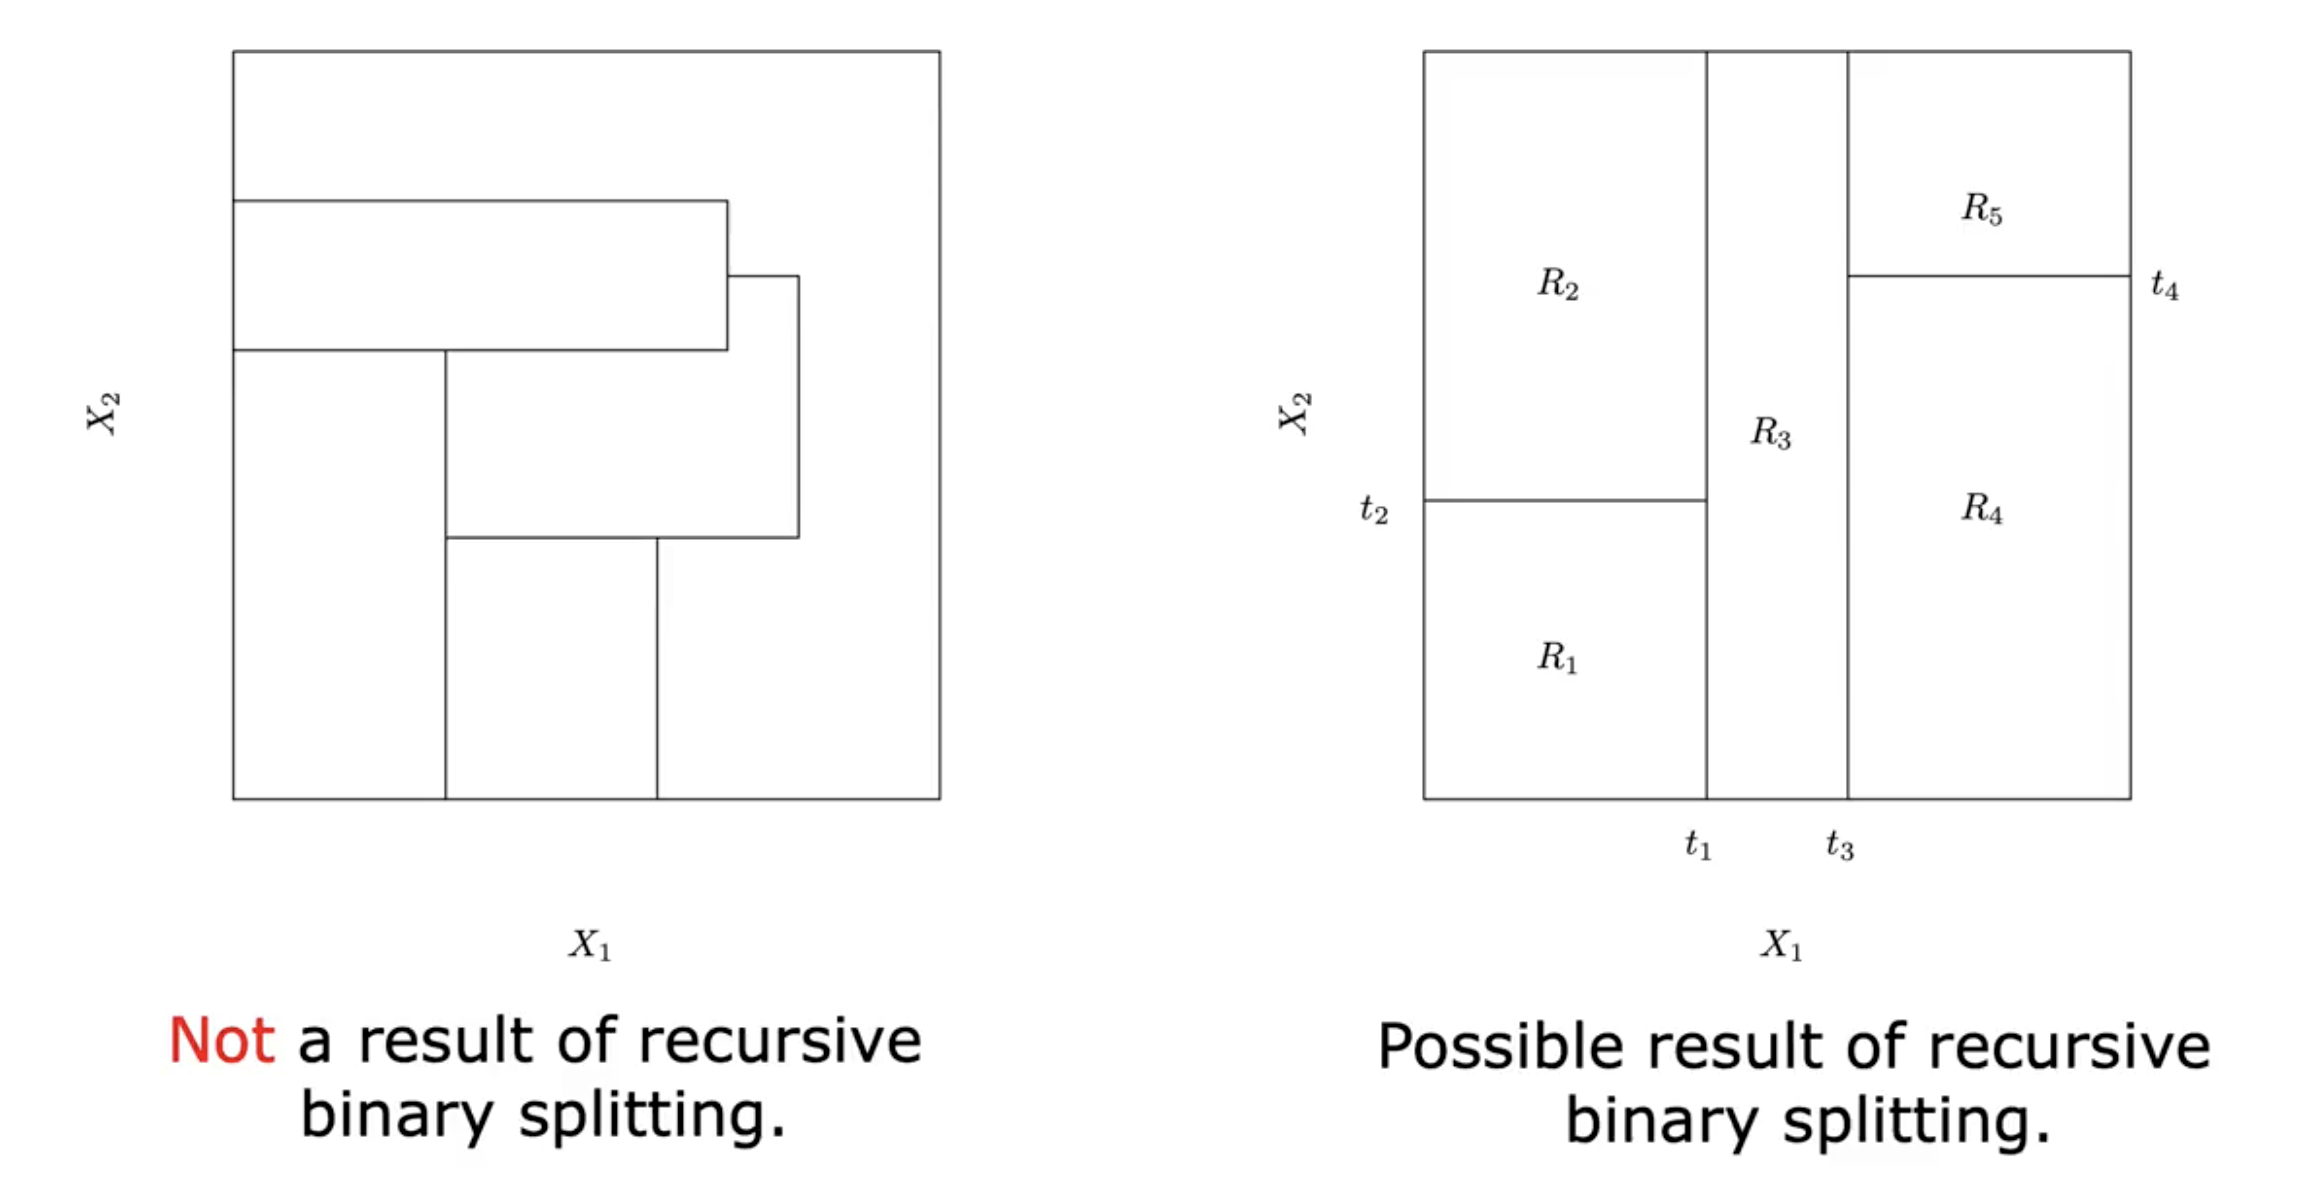
Partitioning Input Space
Decision trees partition the input space into disjoint regions based on thresholds.
Residual Sum of Squares (RSS): The goal when creating splits is to minimize the overall RSS.
Recursive Binary Splitting
Definition
Decision trees are built using recursive binary splits:
Top-Down Approach: Starts from the root node, one split at a time.
Greedy Method: Chooses splits that minimize RSS at each step without considering future splits.
Splitting Process
Steps of recursive binary splitting:
Select the best predictor and splitting value.
Evaluate RSS for the resulting regions.
Repeat for each sub-region until a stop criterion is met (e.g., a minimum number of observations in a node).
Limitations of Decision Trees
Decision trees can become overly simplistic and perform poorly in terms of prediction accuracy.
They may overlook combinations of variables due to the greedy approach.
Tendency to create regions that behave like a step function, leading to rough approximation surfaces.
Visualizing Decision Trees
Decision trees can be visualized to show splits and regions for better understanding.
Example of a regression tree maps splits to corresponding regions and average response values.