W10: Theories of Colour Vision
Theories of Colour Vision
Colour Vision: Learning Outcomes
Trichromacy of Colour Vision
Trichromacy (3 variable model)
Univariance
Colour matching (inc. Grassman’s Laws)
Colorimetry
Colour appearance systems: Ordering colour
Modern Theories of Colour Vision
Matching neurones to perception
Retinal Neurophysiology
Colour in the environment
Trichromacy: 3 Variable Model
Hue: Attribute of colour perception denoted by colour appearance (i.e., red, green, blue). There are >200 steps.
Saturation: Attribute of a visual sensation denoting the degree of difference (colorimetric purity) between chromatic & achromatic (white) stimuli regardless of their brightness. There are >20 steps.
white is desaturated
Brightness: Attribute of a visual sensation denoting the degree to which a visual stimulus emits more or less light (more or less intense; brighter or dimmer). Relative brightness may sometimes be referred to as lightness. There are >500 steps.
Total steps > 2,000,000
How do we do this?
A different receptor for every wavelength would not work because monochromatic acuity in the fovea is good.
Separate receptor types for each colour experience cannot be the answer.
Trichromacy of Colour Vision
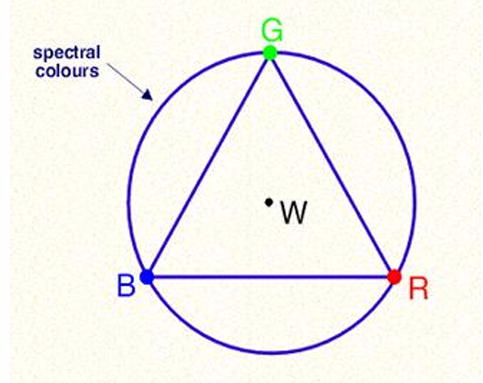
Newton’s Colour circle: spectral circle: 3 primaries, white centre
3 primary colours can be used to create all others.
This suggests that our visual system uses three variables to encode colour.
Figures in Trichromatic Theory
Young (1773-1829)
Physician & polymath
Double-slit interference experiment: Wave theory of light
Trichromatic theory
Accommodation of the lens
Deciphering the Egyptian hieroglyphs
Helmholtz (1821-1894)
Physicist & physician
Conservation of energy & thermodynamics
Invented the ophthalmoscope (1851)
Trichromatic theory
Binocular vision, motion, ophthalmic optics
Acoustics
Nerve physiology
Trichromacy: Young-Helmholtz Theory
Young (1801): “As it seems almost impossible to conceive each sensitive point on the retina to contain an infinite number of particles, each capable of vibrating in unison with every possible undulation, it becomes necessary to propose the number is limited, for instance, to the principle colours.”
Helmholtz (1856): “Colour vision is based on three types of photoreceptors, each with different spectral sensitivity, and that all colours are encoded by the relative activity of these 3 receptors”
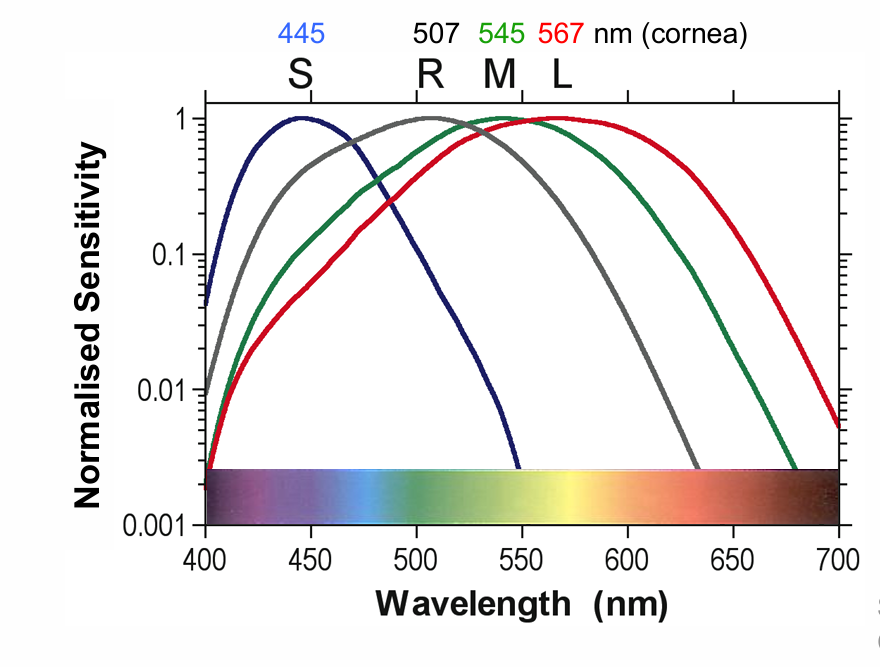
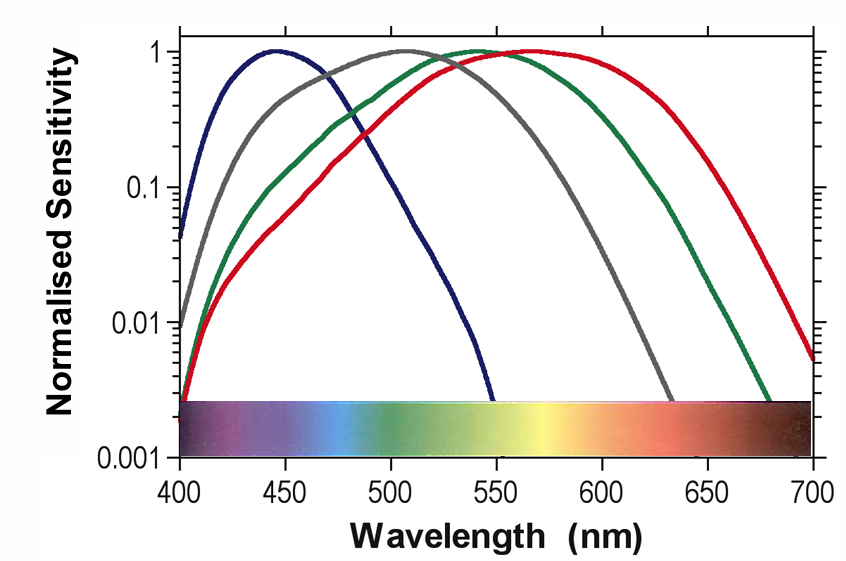
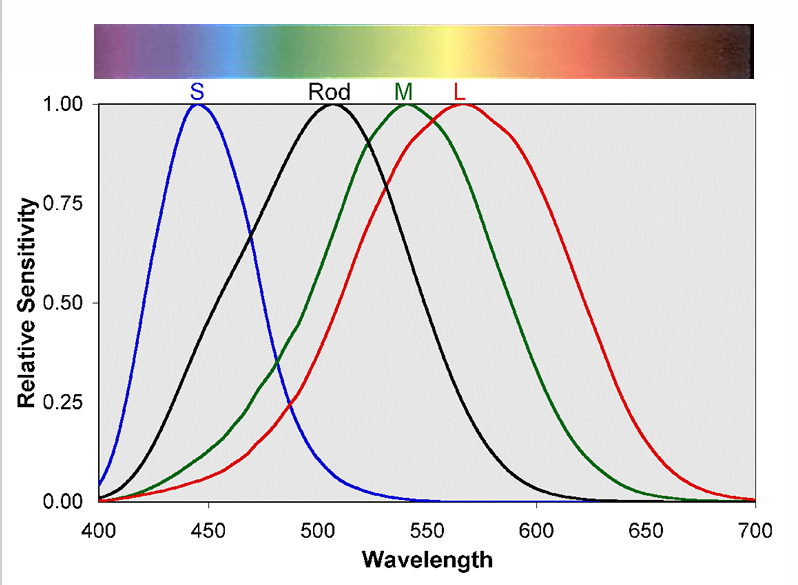
3 cones (SML) and rods have different spectral sensitivities
S-cones: ~445 nm
Rods: ~507 nm
M-cones: ~545 nm
L-cones: ~567 nm
How does activation of phototransduction by photons encode irradiance and wavelength?
wavelength correlated to colour
irradiance - how many photons there are.
Univariance
Vision at the level of the photoreceptors (outer retina) is relatively simple because photoreceptor output is UNIVARIANT (has one degree of freedom)
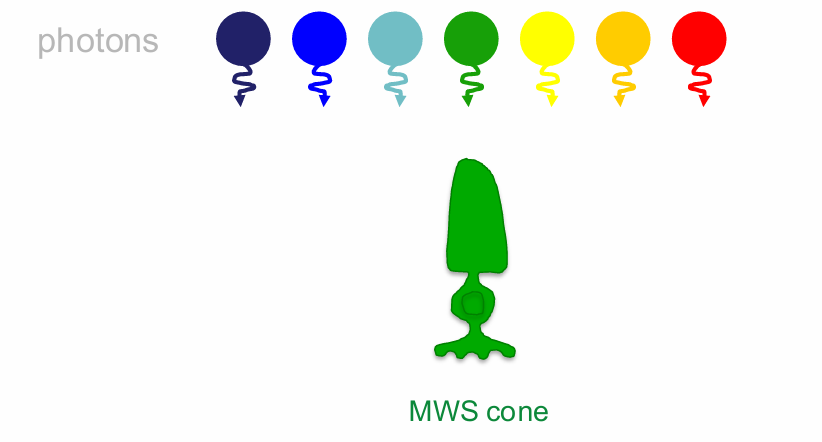
Using Middle Wavelength Sensitive (MWS) cones as an example, we can demonstrate the principle of univariance
The effect of any absorbed photon is independent of its wavelength
Once absorbed a photon produces the same change in photoreceptor output whatever its wavelength
All a photoreceptor does is count the number of photons
near the peak = high probability of capturing.
What varies with wavelength is the probability that a photon will be absorbed (which depends on the photopigment).
this is reflected in the spectral sensitivity function
Consider the MWS cone sensitivity to these photons:
lights In order of M-cone sensitivity:
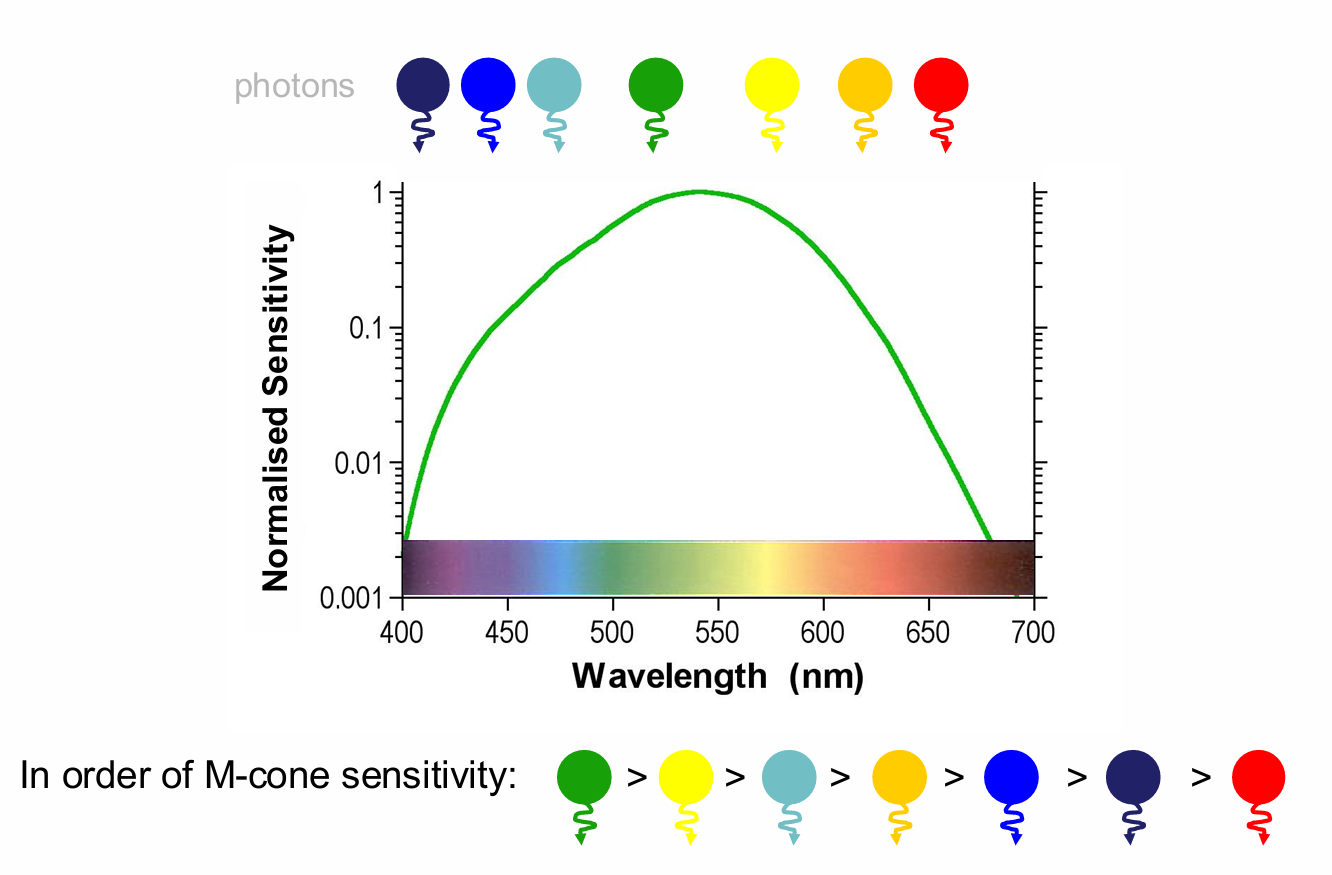
If we have 4 lights of the same irradiance, green will appear brightest, then yellow, then blue, & red will appear dimmest lights In order of M-cone sensitivity:
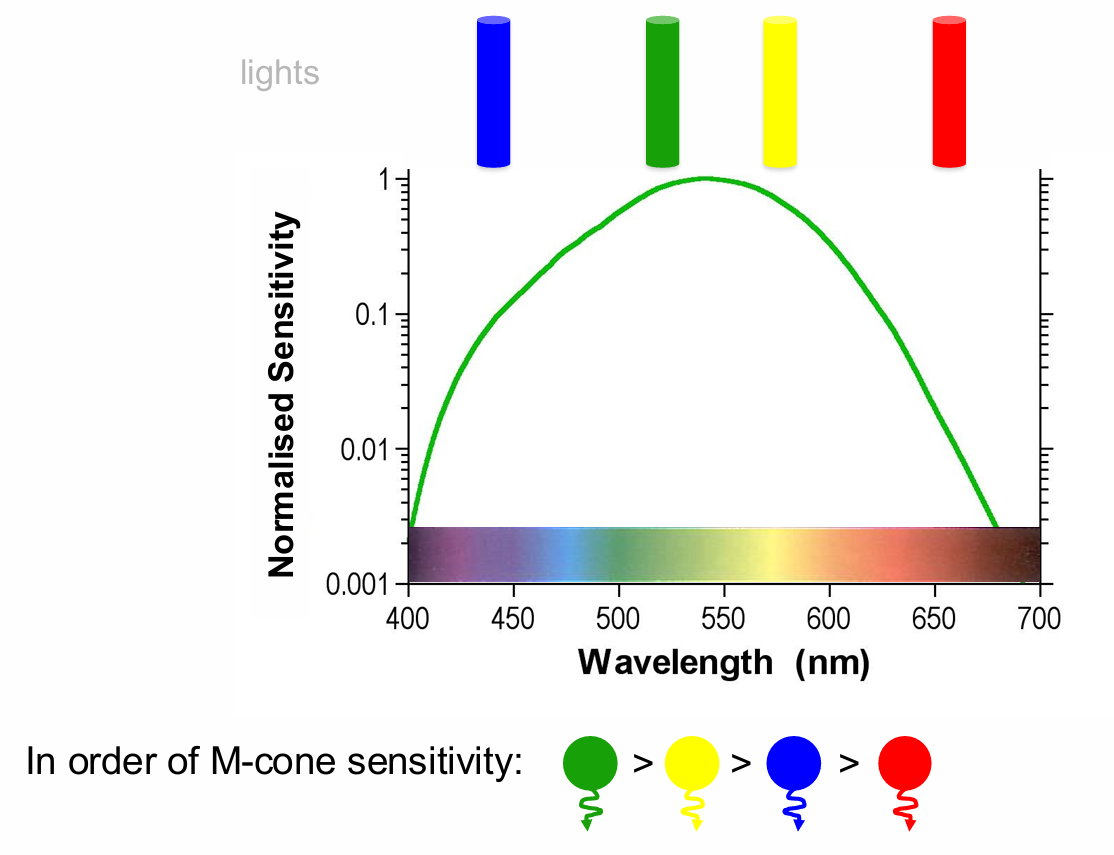
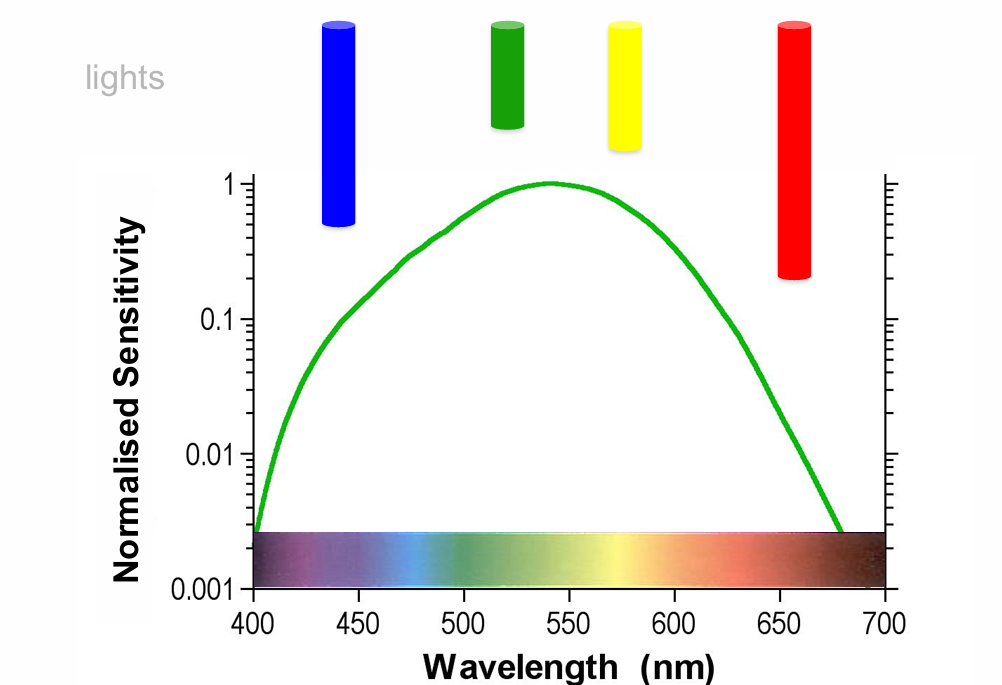
The intensities can be adjusted to compensate for the sensitivity differences when this is done, the 4 lights will look completely identical to the photoreceptor (the output is the same for all wavelengths)
receptor does not know if it is seeing green, yellow, blue or red.
demonstrates the importance of where neurones project.
Changes in irradiance are therefore confounded with changes in wavelength (Colour)
Principle of Univariance
A change in photoreceptor output can therefore be caused by a change in irradiance or a change in wavelength (colour)
Each photoreceptor is therefore ‘colour blind’ and unable to distinguish between changes in irradiance & wavelength
If a cone is n times less sensitive to light A than light B, and if light A is set to be n times brighter than B, the two lights appear identical irrespective of wavelength
The output of a receptor depends upon its quantum catch, but not upon what quanta are caught. Rushton (1970)
Is colour present? Distinguishing between lights of different radiances
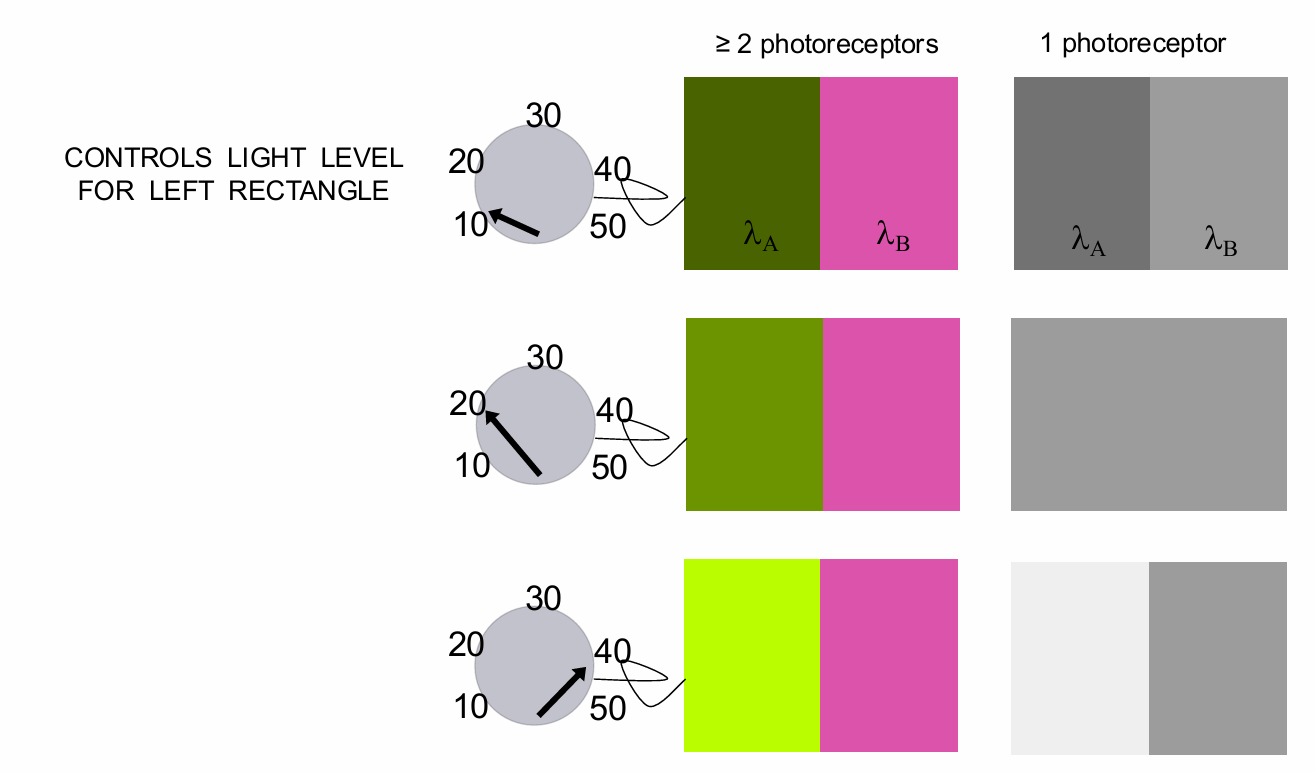
The implication is that person with 1 photoreceptor class (a monochromat) can match any test with any other by simply adjusting the radiance: No colour vision
adjust the left field until they appear the same → move dial and they will reach a point where they match two different wavelengths → therefore no colour vision.
Distinguishing between lights of different radiances requires 2 photoreceptors
Colour Mixing & Matching
Trichromatic Generalisation
The best evidence for the trichromatic theory & the clearest notions for how colour vision works, comes from colour matching experiments
Most effective if 3 primaries have maximally different colour appearance – The primary stimuli must be unique (i.e., cannot be matched by mixing the other two)
Colour matching experiments rigorously show that, for a person with normal (trichromatic) colour vision, any test wavelength can be matched a suitable arrangement of 3 primary sources (as long as one source is not obtainable from a mix of the other 2)
The data for any set of primary stimuli (the Colour Matching Functions) can be transformed to any other sets of primary lights
Critical Properties of Colour Matching
Colour matching data are obtained with monochromatic test lights
In general, the data are useful because they can predict the matches for other lights with arbitrary spectral distributions (and matches with other primary lights)
e.g., in colour reproduction on TVs, printers & photos
This is possible when the colour matching experiments exhibit a number of critical properties defined by Grassman’s Laws
Given that Grassman’s Laws hold, the colour matching data provide a complete representation of the spectral properties of light that affect human vision
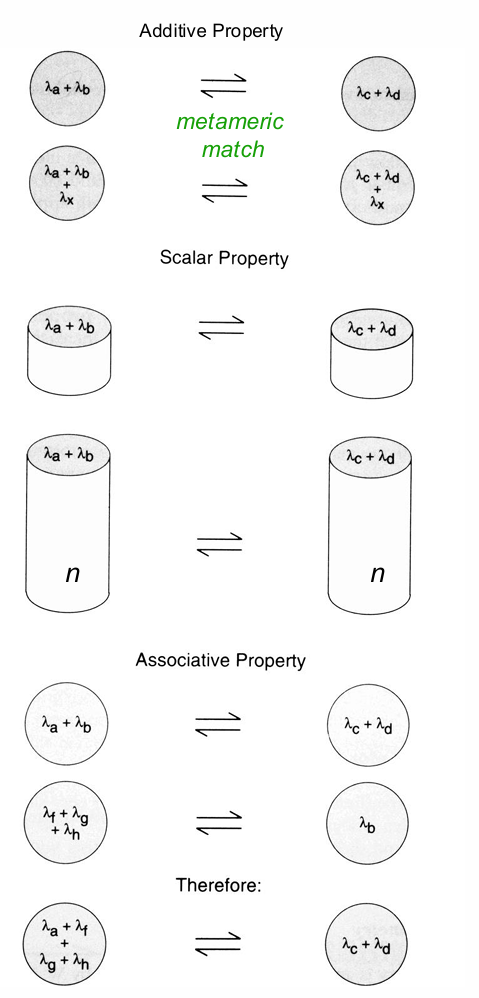
Grassman’s Laws of Colour Matching
a, b, c, d … are any wavelength stimuli:
Additivity: If lights a & b match lights c & d then, adding (mixing) a 3rd light x to both combinations (a, b + x & c, d + x) does not change the appearance of the metamer
c & d look the same as a & b (metameric match)
adding a third wavelength to both still maintains the match
Scalar (Proportionality): Changing the radiance (where n is a constant) of both combinations (a, b & c, d) does not affect the metamer (n.b. except Bezold Bruke effect at high radiances)
proportionally scale their outputs they still maintain their match.
Associative (Transitivity): Substituting metameric lights does not affect the metamer (i.e., If light A matches light B and B matches C, then A matches C)
if something matched before it will match after
Symmetry: If a = b (i.e., metamers) then b = a
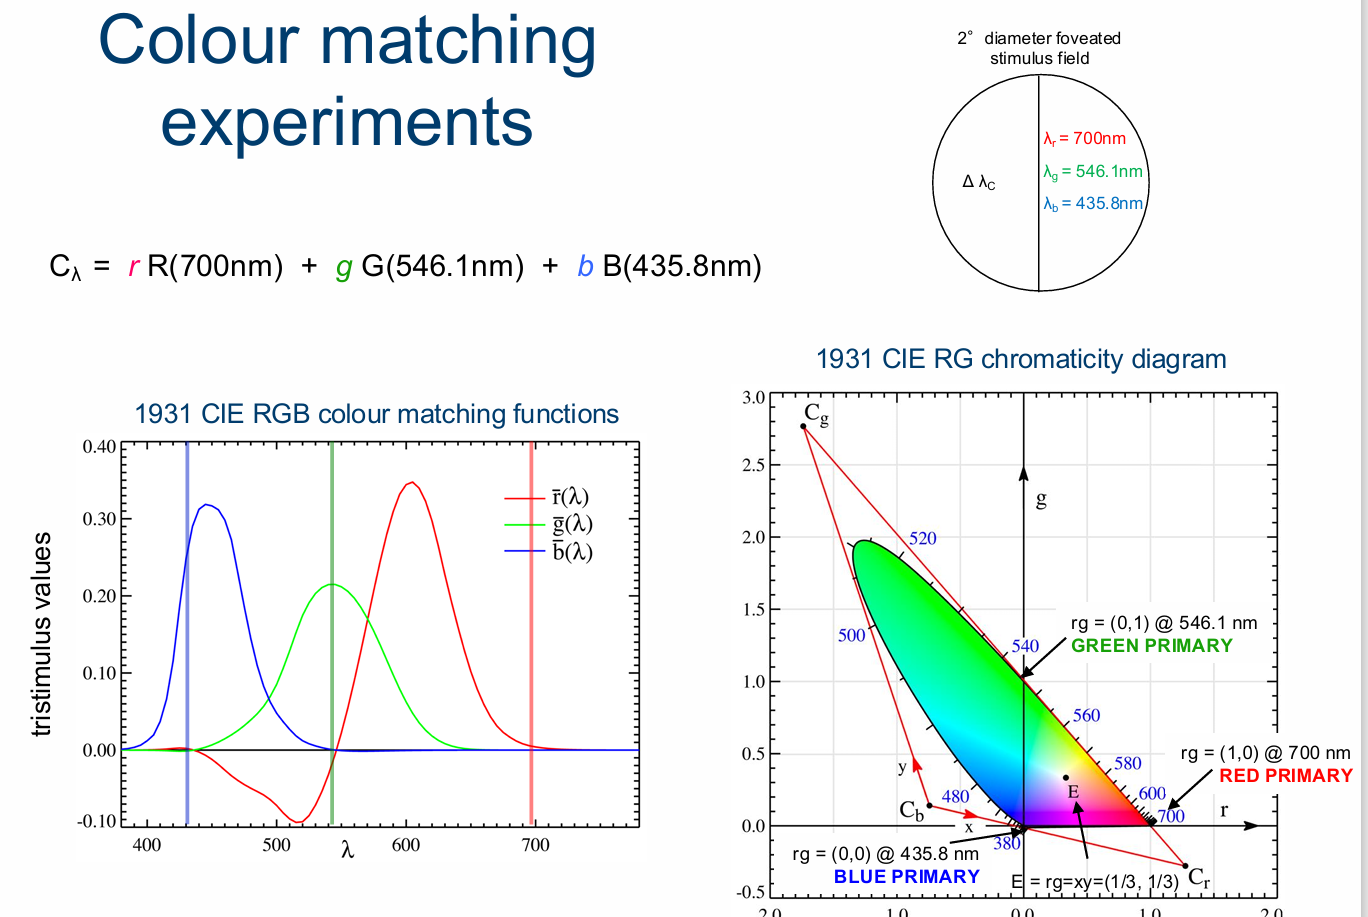
RGB Colour Matching Experiments
Colour matching experiments conducted using the maximum saturation method (Wright, 1928-29; Guild 1931)
uses maximum saturation lights that are monochromatic
3 monochromatic primaries chosen that when mixed in equal amounts they produce a light metameric to an equal energy spectrum (EESwhite = R+G+B)
Spectral red: R= 700nm
green: G = 546.1nm
blue: B = 435.8nm
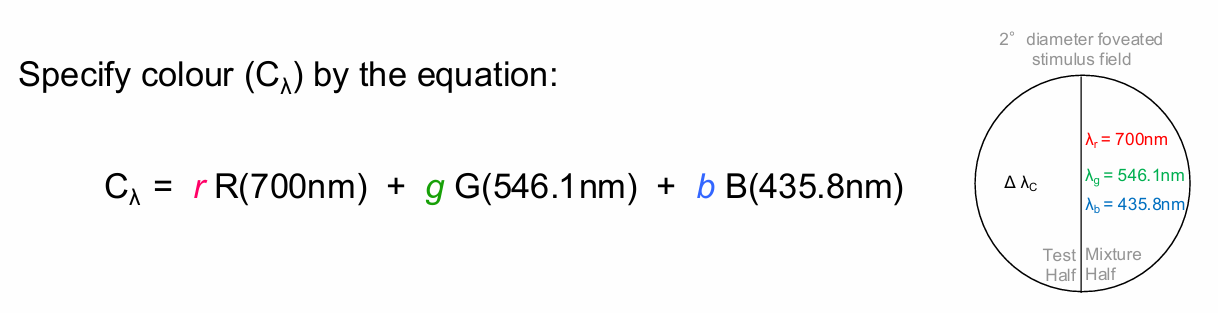
assumed no rods in foveal areas - i.e., reliant on cones.
Recognised macular pigment is different between people.
Monochromatic test half () is matched using a mixture half with 700 nm, 526 nm, & 444 nm (Tristimulus Values)
No matter which real primaries are chosen there will be wavelengths where negative amounts are required to complete the metameric match (i.e., the red is added to the test half field)
cancelling out the red.
Amounts of the r, g and b primaries required to match the colour () are known as the tristimulus values
Generate Colour Matching Functions by plotting the tristimulus values at each colour match as a function of the wavelength of monochromatic test lights across the visible spectrum
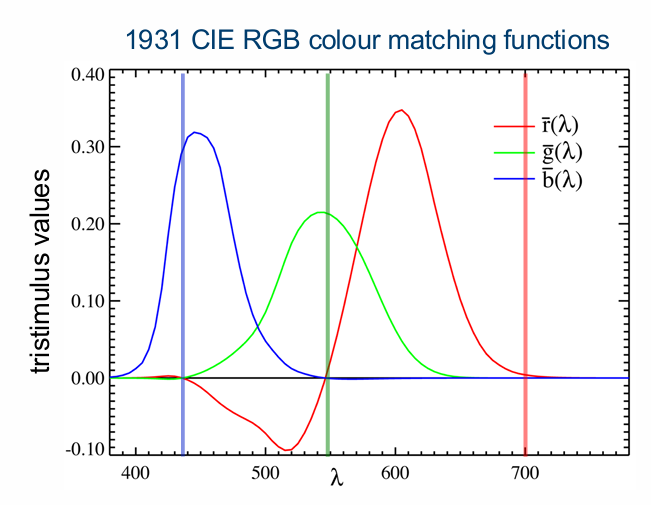
below zero for red → negative → red added to test side.
CIE RGB Chromaticity Diagram
Since b + g + r = 1, b = 1 - g - r Need only r and g to specify chromaticity coordinates for the match at each test wavelength
Calculate the chromaticity coordinates: effectively the ratio of one primary relative to the other three
r = R / (B+G+R)
g = G / (B+G+R)
b = B / (B+G+R)
Plot r versus g to generate the Red-Green chromaticity diagram
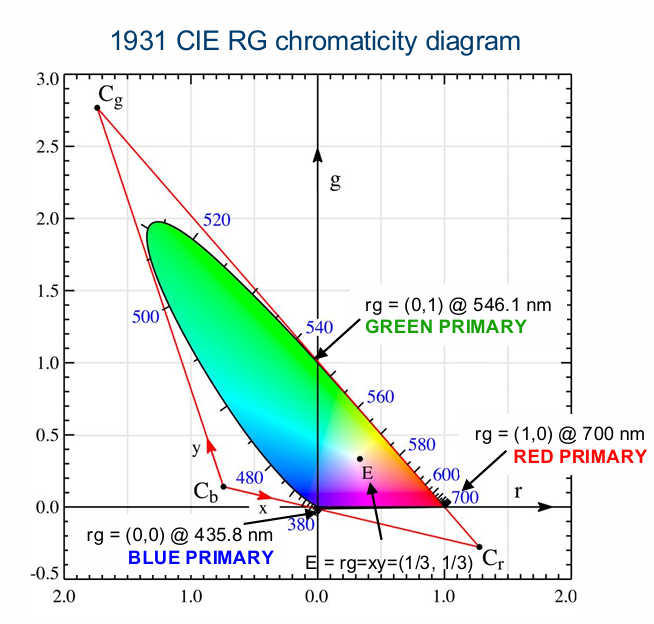
As you go towards shorter wavelengths, go into negative red components, which shifts towards blue (lowest wavelength).
CIE XYZ System
Uses imaginary primaries to overcome the problem of negative quantities with real primaries
Mathematically transforms the RGB CMFs to functions representing 3 imaginary primaries X, Y, Z
All the tristimulus values (X,Y,Z) are positive
1931 CIE x,y chromaticity diagram shows the relative amount of the imaginary primaries required to match any real colour
imaginary primaries CANNOT be produced - cannot see them
All positive values.
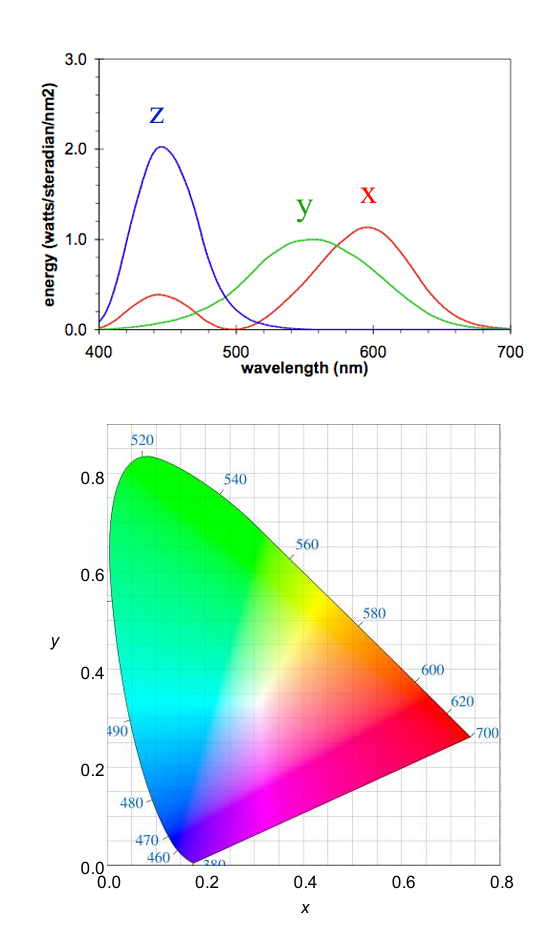
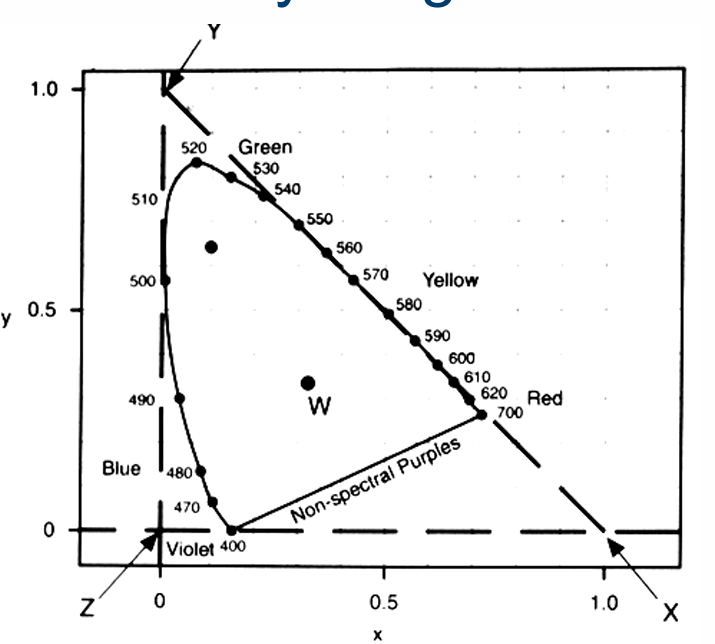
Spectral Locus
Locus of matches to spectral colours
Perimeter of the zone of real colours
Non-spectral purples:
Line joining extreme short (380nm) & long (700nm) wavelengths (mixtures of blue/violet & reddish lights)
Completes the limits of real colour space .
All physically realizable colours fall along the spectral locus, or within the colour space. The imaginary primaries (X, Y, Z ) fall outside the diagram.
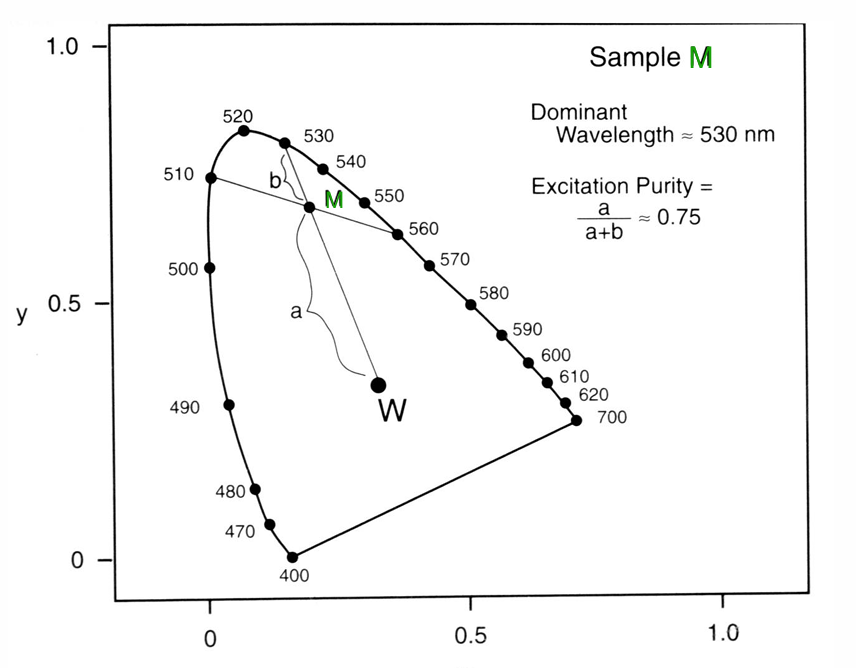
Dominant Wavelength & Excitation Purity
Equal amounts of 510 and 560nm are combined to form a mixture, M. This mixture M has a dominant wavelength of 530nm and an excitation purity of 0.75
Dominant Wavelength of a colour stimulus (M) is the wavelength of the monochromatic stimulus that when mixed with some specified achromatic stimulus (e.g. A, D65; W in this example), matches the stimulus colour (dominant wavelength correlates approximately with hue).
Excitation purity defines the relative distance from the white point.
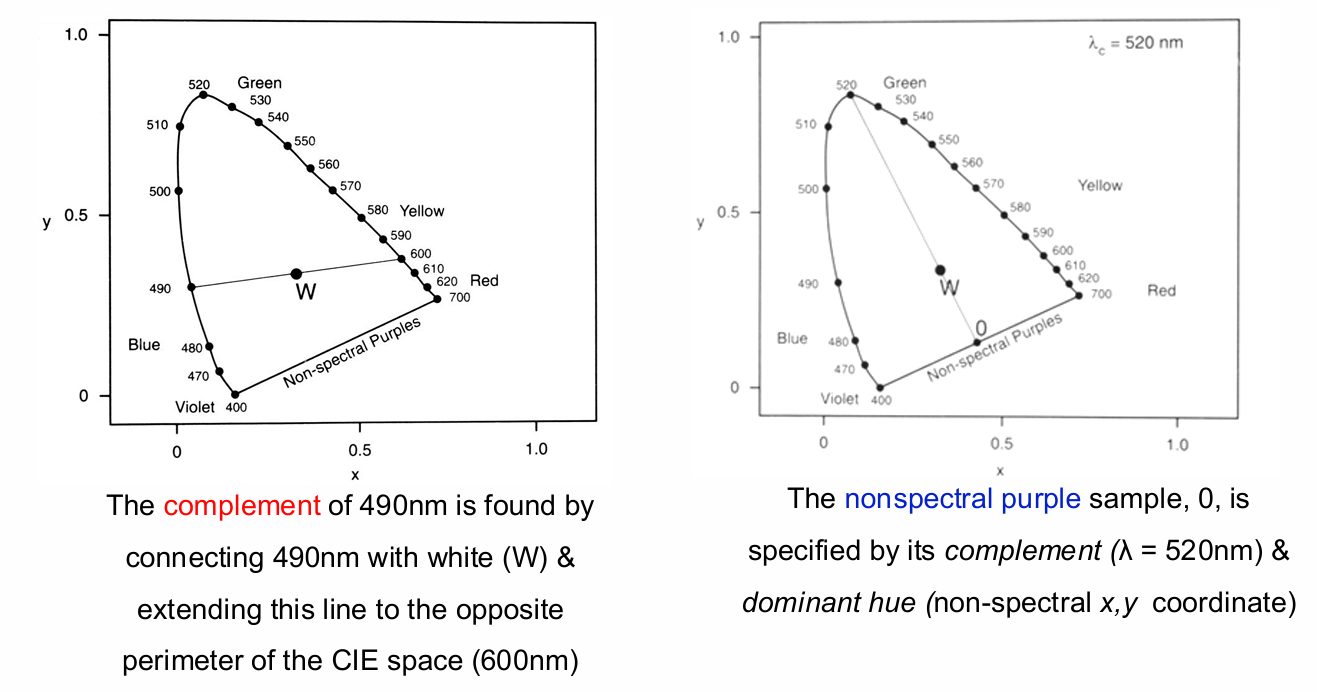
Complementary Colours
The complementary wavelength of a colour is the monochromatic wavelength that when additively mixed in suitable proportion with the (initial) colour, yields a metameric match with a specific achromatic light (e.g., W in the spaces below)
Estimation of the 1931 CIE xy chromaticity co -ordinates of a light with a known spectral distribution.
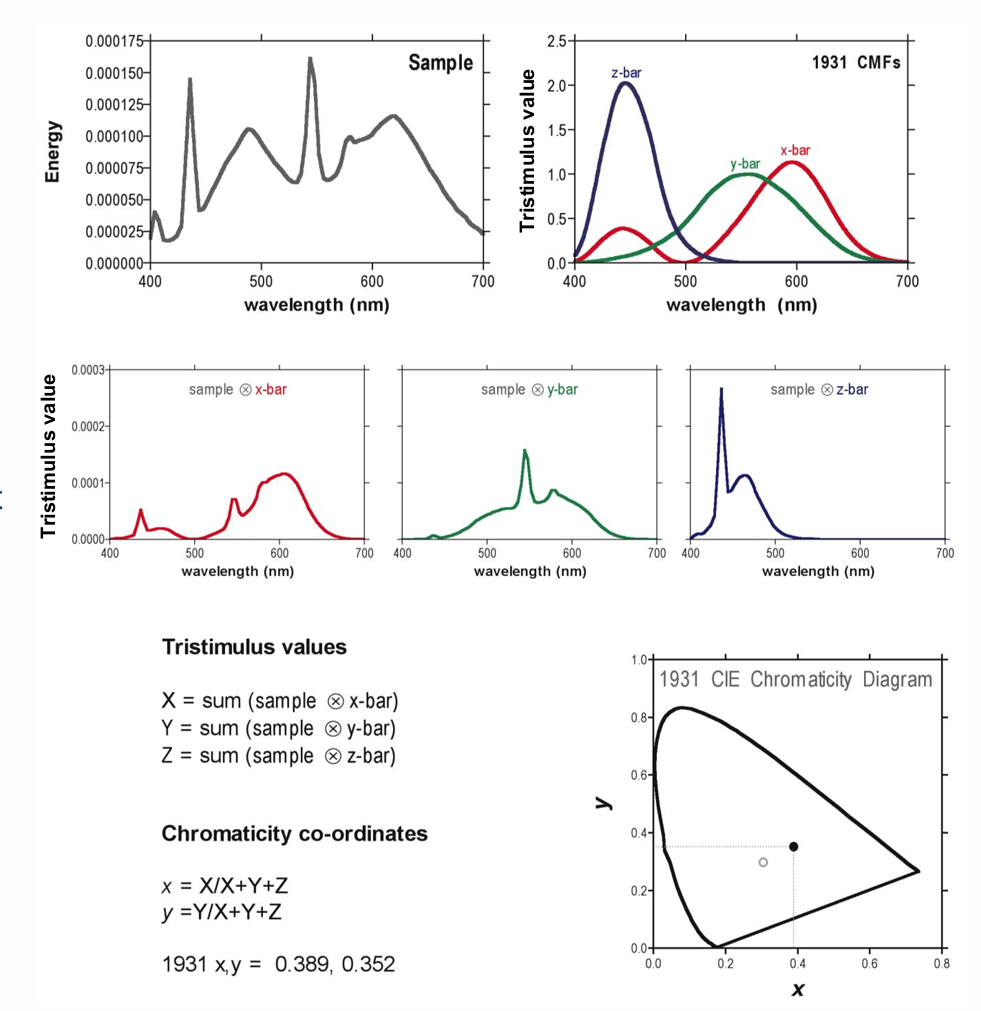
determining the tristimulus values
then calculate the chromaticity co-ordinates → summing.
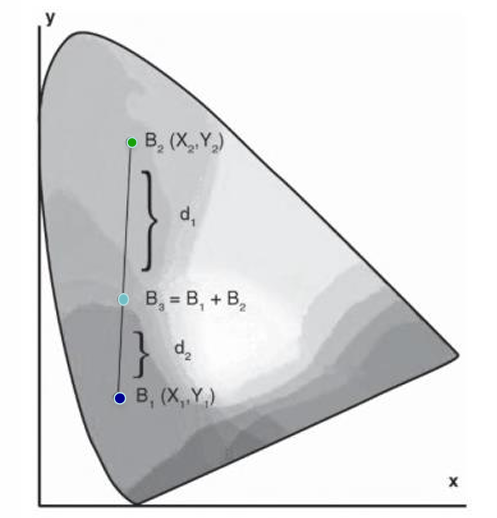
Centre-of-Gravity Rule
J.C.Maxwell developed the colour triangle & centre-of-gravity rule of colour mixing (+ first colour photograph (of a tartan ribbon) that combined images taken through a red, blue and yellow filters; theory of electromagnetic radiation, kinetic theory of gases)
Tristimulus values of an additive colour mixture (B3) are the sums (weights) of the corresponding tristimulus values of the component colours (B1, B2)
The relative amounts (weights; w1, w2) of 2 component lights (B1 at x1, y1; B2 at x2, y2) in an additive mixture required to produce a 3rd colour (B3 at x3, y3) is defined by the ratio of their distances (d2,d1) between B1 & B3 and B2 & B3:
Colorimetry
Colorimetry is the numeric specification of colour for science, industry & clinic
Established by the International Commission on Illumination (CIE) in 1931
Based on the concept of the measurement and specification of equivalent-appearing stimuli (i.e., cone metamers)
Stimuli with the same specification have the same appearance
Based on trichromatic principles
Concerned with small colour differences
Standardizes the elements necessary to measure & characterize colours
Colour is represented using chromaticity diagrams
1931 CIE x,y Colour Solid
The gamut of the CIE chromaticity diagram is dependent on the adapting luminance (Y), as is the human visual system
The gamut decreases with increasing luminance (Y) because colours become more desaturated as the light levels increases
as light levels increase, our gamut of colours we can see is smaller → photopigment bleaching, narrowing of responses → colours become more desaturated.
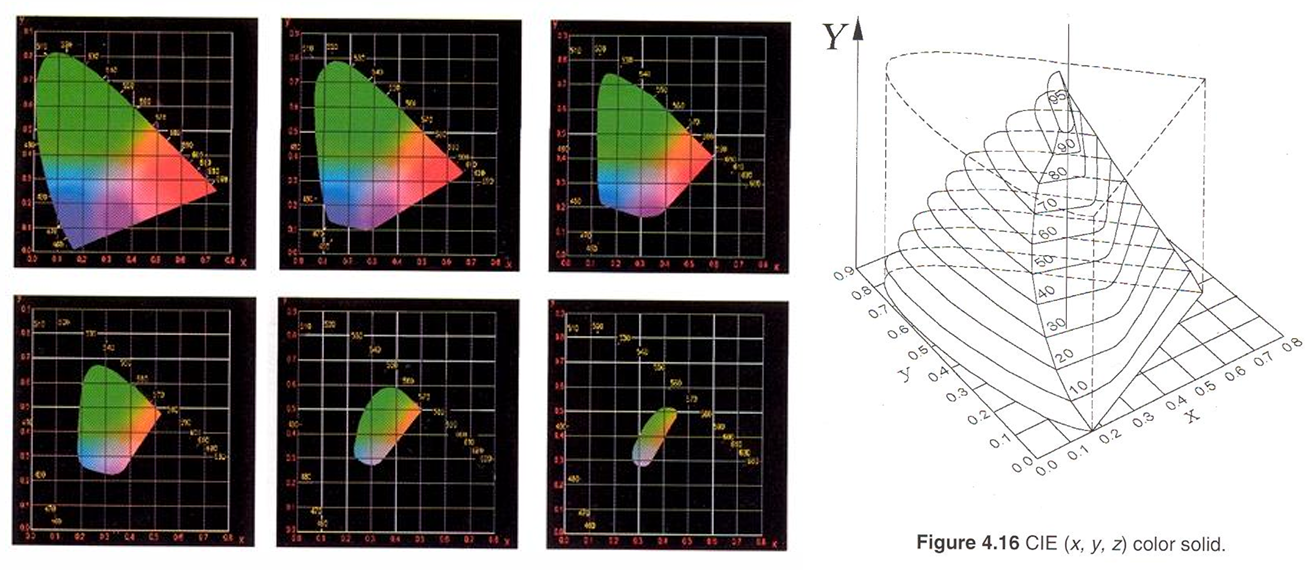
There are some parts of spectrum, where large changes in colours are needed to detect differences in colour.
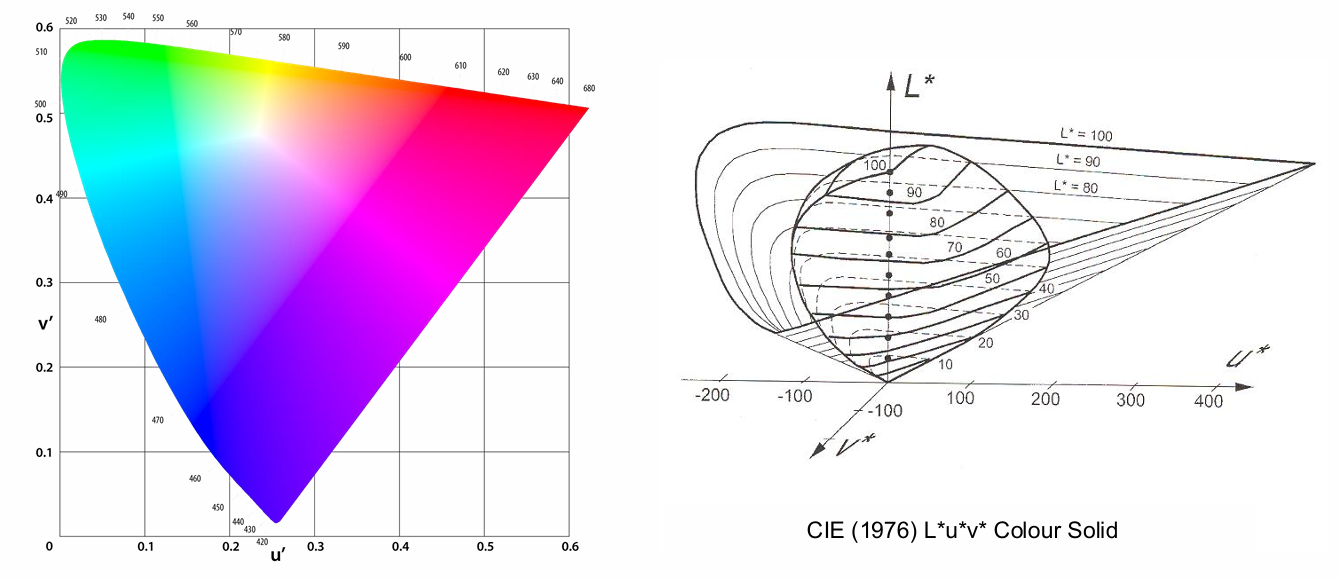
CIE 1976 L*U*V Uniform Colour Space
The Luv* space was designed so that perceptual colour differences of the same magnitude span similar distances (overcoming a limitation of the non-linear 1931 x,y space)
Cone Excitation Space
Cone excitation space links neural colorimetry to neural processing
Transforms colorimetric primaries into new set of primaries representing the spectral sensitivities of the human cones photoreceptors
Equiluminant colour space (S-cone do not contribute to luminance)
Copunctal points represent missing dichromatic photoreceptors
L/L+M: change L & M excitation (constant S)
S/L+M: change S excitation (constant L/M ratio)
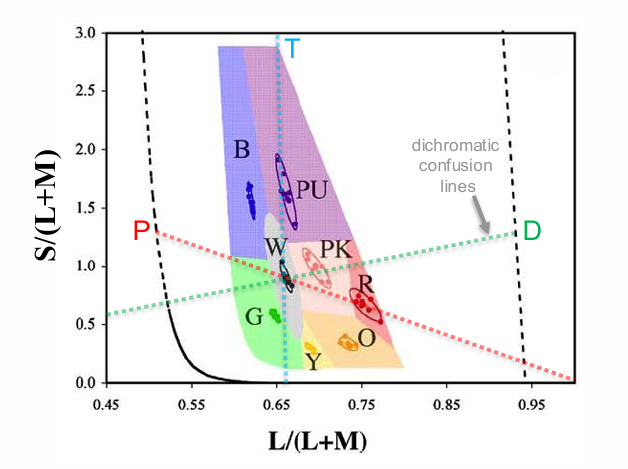
x axis is Equi luminant
y axis is excitation of S cones.
Mid-point (0.677) - two L cones for every M cone.
vertical line - missing S cones
P - protan confusion line - missing L cone
D - dircrohmatic confusion line - missing M cones?
Colour Appearance Systems
A systematic way of ordering & specifying colours
Colour Atlases & Charts
Simple way of presenting coloured samples or chips
2D display, arranged to show perceptual variations
Problem: discolouration, limited number of samples, not all colours represented
Based on:
Additive colour mixtures
Subtractive mixtures
Colour perception
Perceptual Dimensions of Colour
3 basic dimensions:
Hue - runs around outside
Brightness - vertical
Saturation - out from centre (increases from middle to outside)
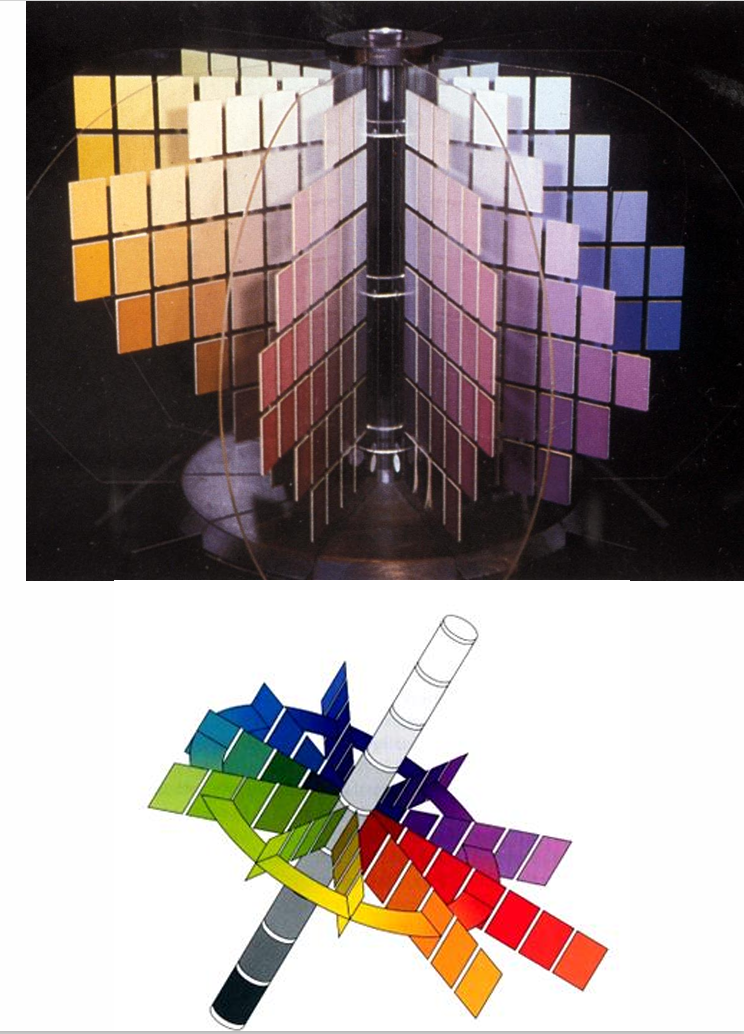
Munsell Colour System
3 Dimensions of colour:
Hue
Value
Chroma
Each dimension is independent
Colours specified in terms of 3 Dimensions (H/V/C): 5BG/5/4
Only appropriate under daylight in the northern hemisphere (standard illuminant C)
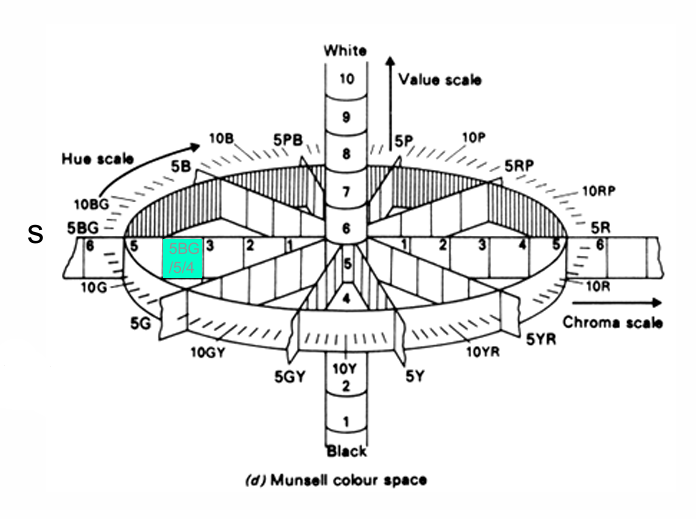
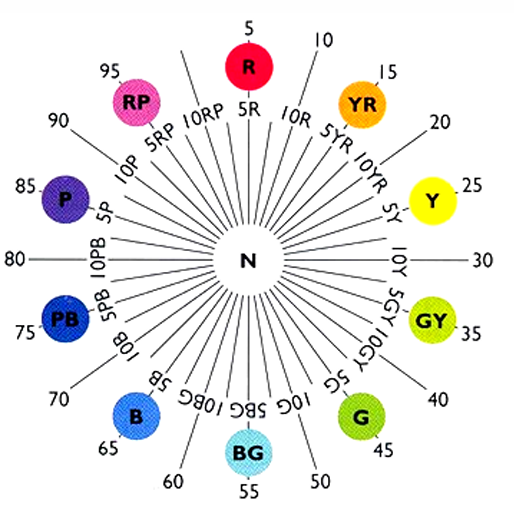
Munsell Hue
Distinguishes one colour family from another
10 Major Hues: blue, blue-green, green, green- yellow, yellow, yellow-red, red, red-purple, purple, purple-blue
Further subdivision into a scale that ranges from 1 - 10 (with 5 being the major hue)
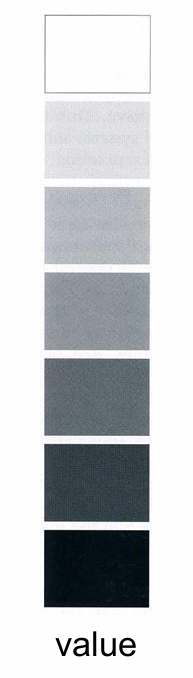
Munsell Value
Brightness, lightness, brilliance
Distinguishes a light colour from a dark one
Depends on what percent of light is reflected back to the viewer
Ranges from 0 (pitch black, 0% ) to 10 (white; 100% reflectance)
All Munsell colours of the same value, no matter the hue, will reflect the same amount of light (this is important for CVD testing)
Human perception of lightness is non-linear (~logarithmic); a grey reflecting 50% of light does not look halfway between black & white (i.e., N5 a perceptual middle grey has ~18% reflectance)
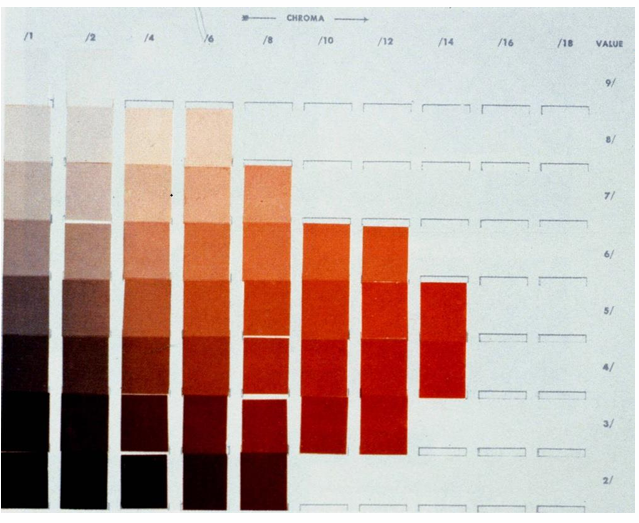
Munsell Chroma
Saturation, purity, colourfulness, colour strength
Difference between a chromatic & achromatic stimulus (in the 1931CIE colour space, this is a move between the white point and spectral locus)
Designed to represent equal changes in perceived hue
Ranges from 0-14 (0 = achromatic)
Achievable range varies with hue
Modern Theories of Colour Vision
Matching Neurones to Perception
Müller’s Law (1801-1858) postulates that: “Each type of sensory neuron.., gives rise to its own specific sensation; …each sensation depends not upon the special character of the different nerves but upon the part of the brain in which the nerve fibres terminate”
Helmholtz stated that “Youngs hypothesis is only a special case of the law of specific nerve energies (Müller’s Law)”, accounting for the sensations of red, green and violet
This provides a link between the wavelength composition of the light (the physical stimulus) and colour (the perception)
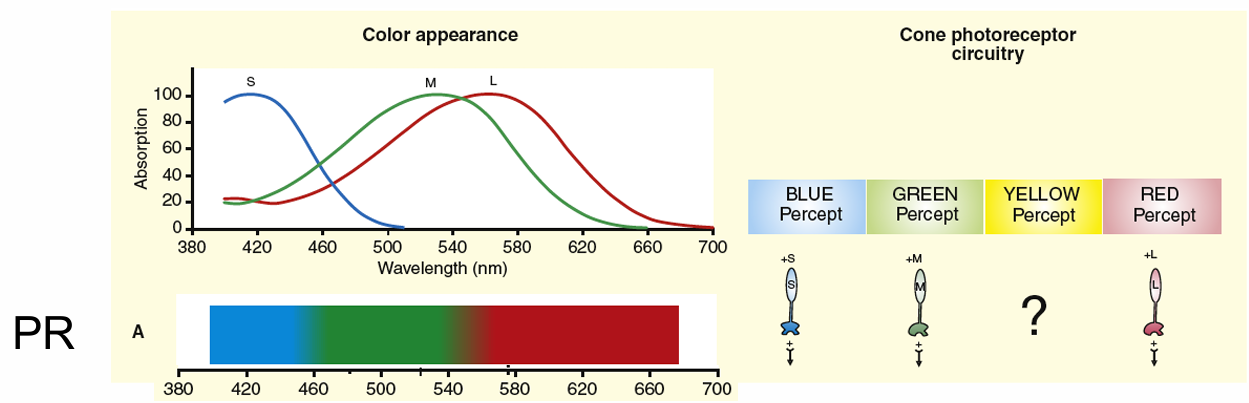
First stage of vision begins with the cone absorption spectra
There are 3 cones types with different visual pigments having overlapping absorption spectra
~445 nm S-cone short wavelength sensitive (cyanolabe)
~545 nm M-cone middle wavelength sensitive (chlorolabe)
~567 nm L-cone long wavelength sensitive (erythrolabe)
Three cone & rod (max = 507 nm) photoreceptors with overlapping absorption spectra
Physics, Physiology & Perception
Q: How do the 3 cone signals (L M S) relate to the 6 fundamental colour percepts?
Q. What is the role of the retina and cortex in colour appearance?
Achromatic axis - s cone excitation → all of the colours appear the same white with different intensity
luminance axis - as it get brighter or darker → different s cone excitaiton
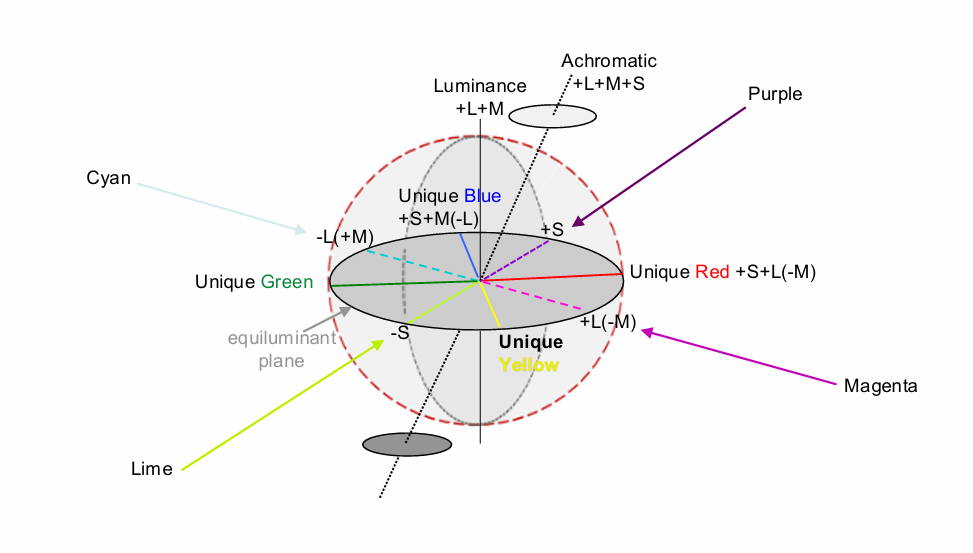
If three photoreceptors (PR) directly accounted for colour perception, an equal energy spectrum (EES) white light would consist of only three unique hue sensations
Ewald Hering’s (1872) Theory
Three receptors proposed by Young and Helmholtz did not correspond to the number of uniques hues we experience
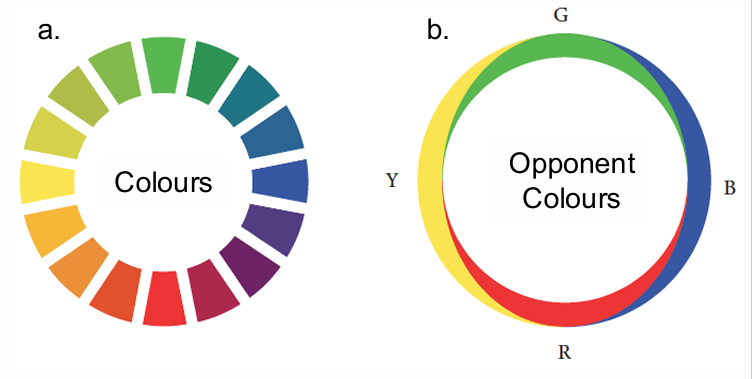
Proposed 6 unique hues (psychological primaries) – red, blue, green, yellow, black, white
Certain colours never appeared to mix (i.e., red-green & blue-yellow)
After image of one of these pairs was the other
Opposing (colour opponent) hues: red vs green, yellow vs blue
ring on the right (b) shows the hypothetical contributions of the colour-opponent pairs (b) to a corresponding colour in (a)
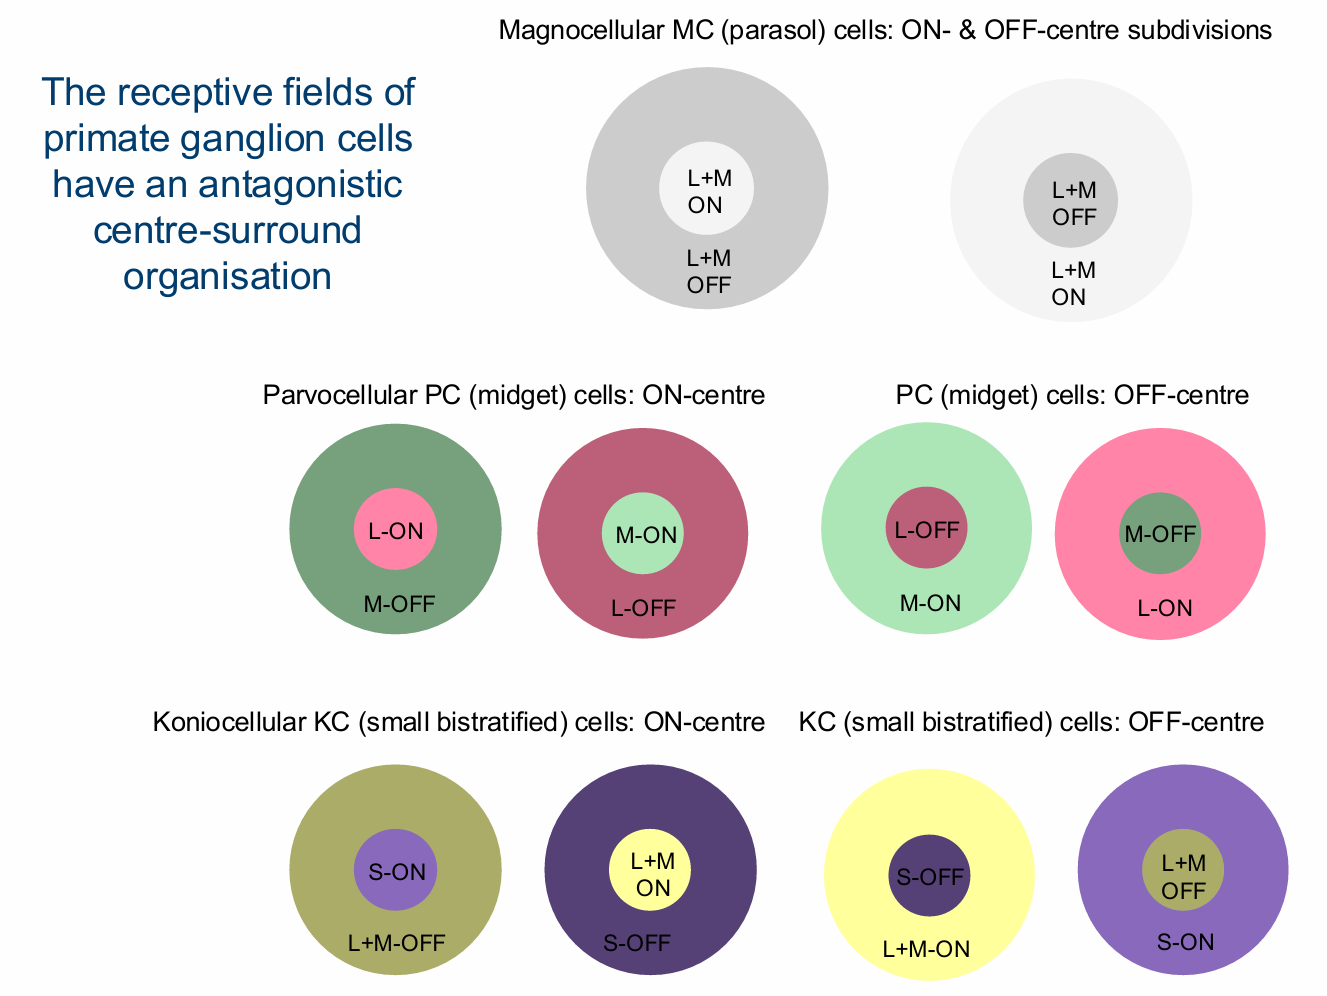
Multi-Stage Model of Photopic Colour Vision
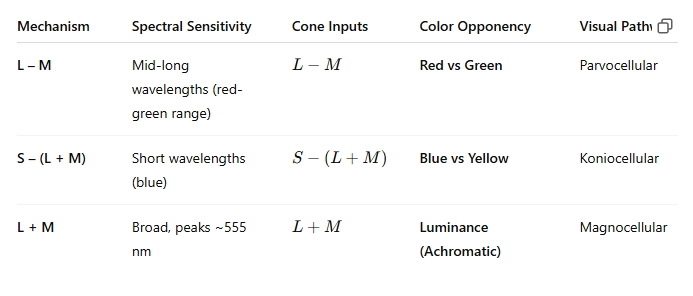
Stage 1 outputs of 3 cone types (LMS) are combined by Stage 2 neural circuitry that compares cone quantal catches to form multiple parallel pathways
Stage 2 post-receptoral wiring of the the 3 cone signals form multiple circuits with spectral antagonism occurring at the level of bipolar, ganglion cells & in the LGN
L-M cone-opponency with ON- & OFF-subdivisions (PC pathway)
S/(L+M) opponency with S-cones & a weighted sum of L+M-cones (KC pathway)
Luminance: L+M cones (MC pathway)
Achromatic: L+M+S cones
Stage 3 Double opponent cells (e.g., L+M-/M+L-) in occipital cortex (V2,V4, beyond). Where you start to see unique hues.
A muti-stage model explains why mixtures of all visible light yield a white percept & Hering’s observation that no colour is seen as blueish-yellow or reddish-green
Colour Vision in Scotopic Illumination
Traditional Textbook account that “rods are colour blind” is misleading
Rod mediate variegated hue percepts – Mechanism is cortical (based on V’), not retinal opponency
Rod colour is relational and can be predicted based on the scotopic reflectance of a sample
lighter appearing samples are perceived as blue-green
darker appearing samples are perceived as red-orange
Recent evidence finds that melanopsin contributes to colour vision
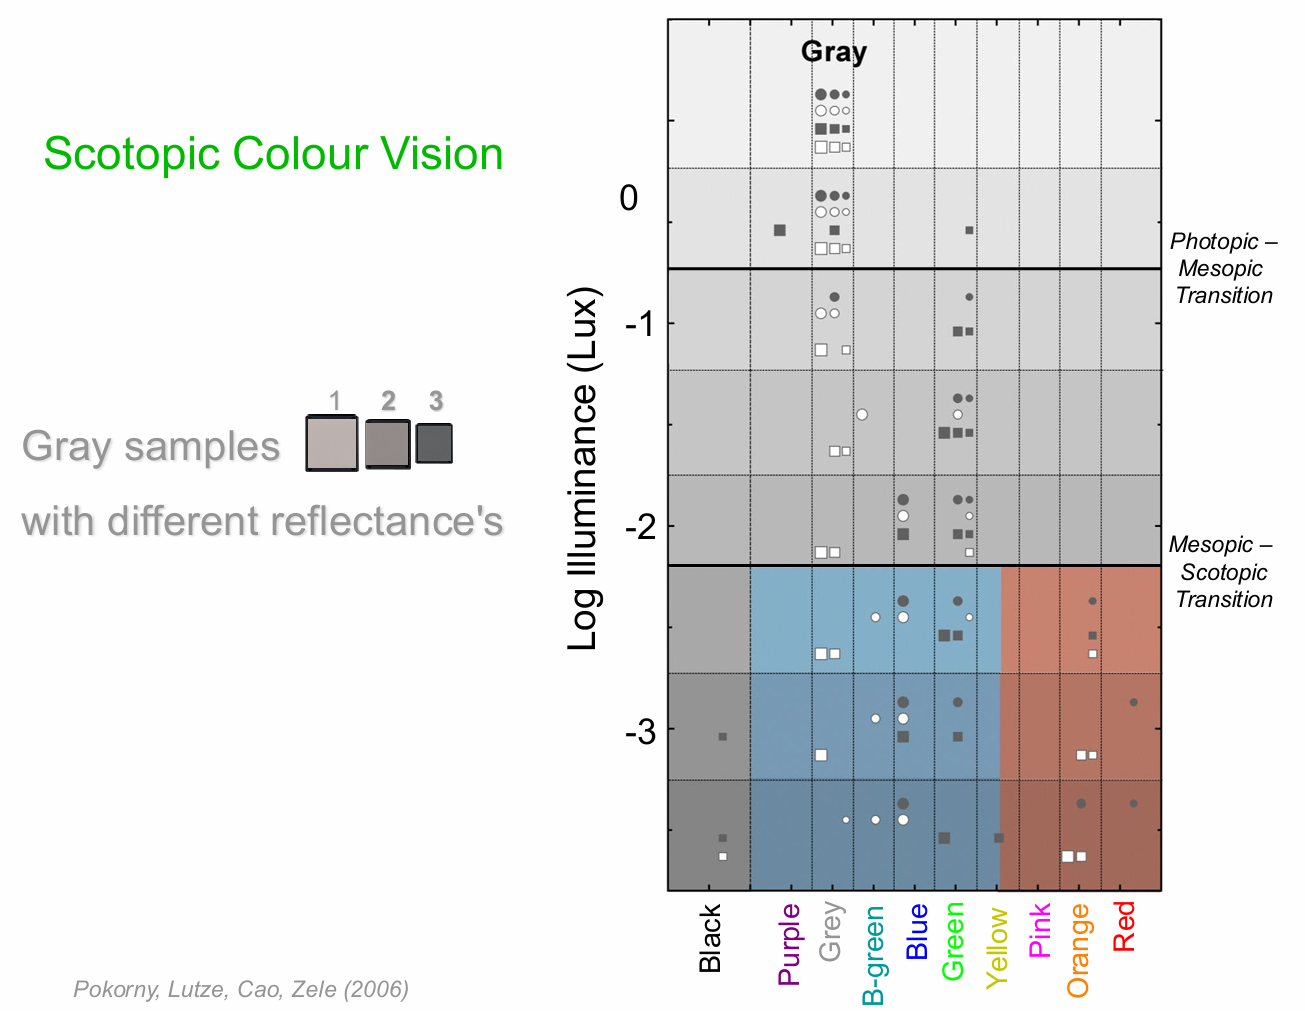
when 1 and 3 are next to each other → blue /green and red / orange seen
when just 1 or just 3 are shown → only blue/green see. Reliant on delta L/L
Retinal Neurophysiology
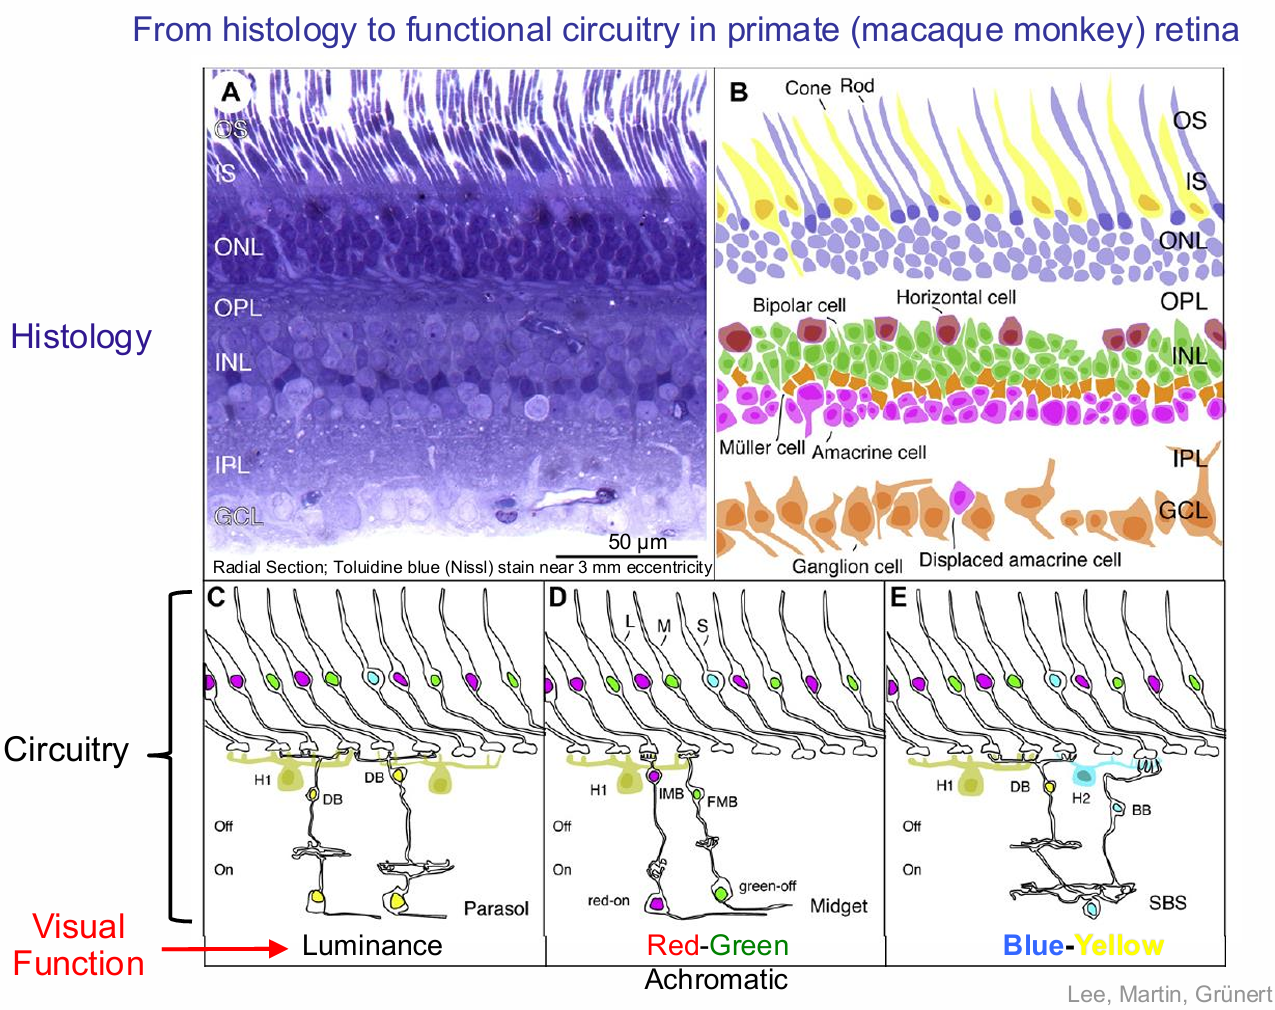
From histology to functional circuitry in primate (macaque monkey) retina
Achromatic (PC pathway)
Luminance (MC pathway)
Red-Green
Blue-Yellow
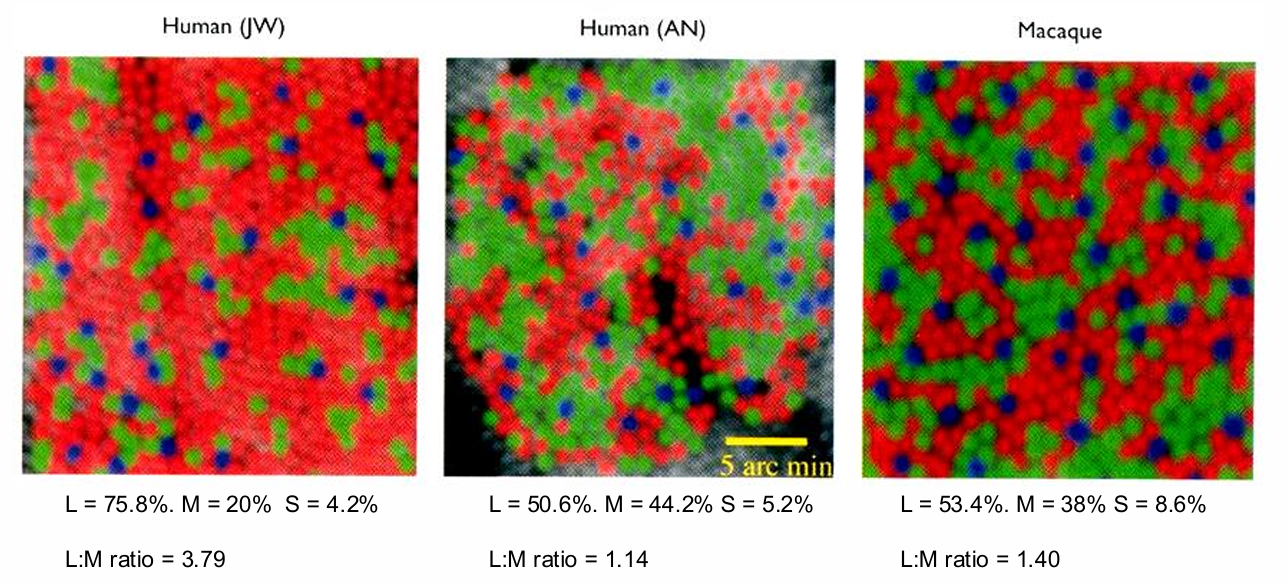
People have different L-, M- and S-cone distributions
Even so, unique yellow (=580nm; 568-592 nm) is independent of their L:M ratio
Unless stimulate a single cone, then high L:M cone ratios are related to more red percepts whereas lower L:M cone ratios to green percepts
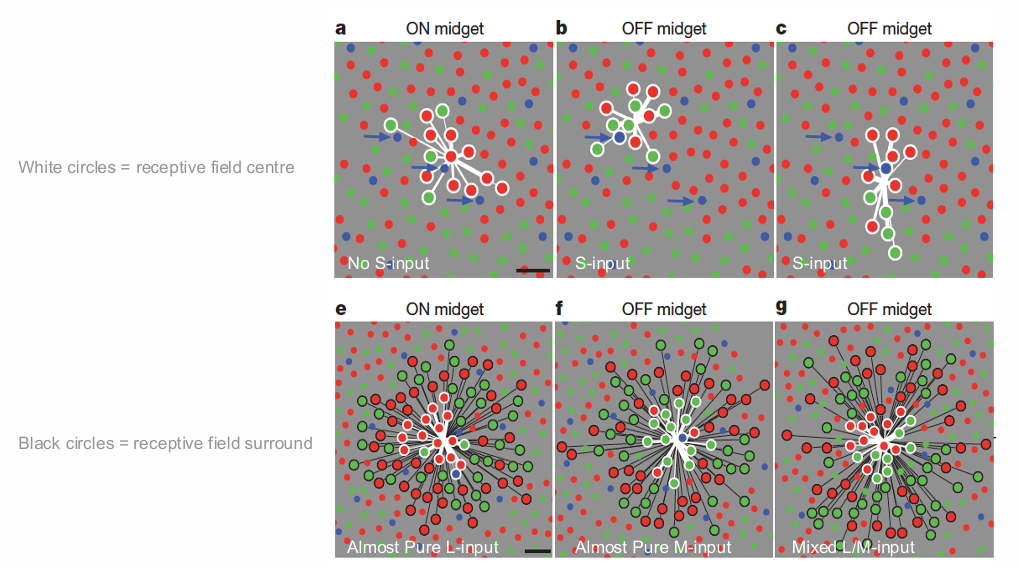
Cone-Type Selectivity in Peripheral Macaque Retina
A significant fraction of peripheral midget cells (PC pathway) show red-green opponency
Opponency often strong in midget cells sampling either L or M cones dominantly or exclusively in the receptive field centre (white circles); cone sampling in receptive-field surround is indiscriminate (black circles); mixed centre-surround signal weights luminance information
ON midget cells tend to sample weakly from S cones
On average, S cones are strongly sampled by OFF midget cells about five times more frequently than by ON midget and parasol cells
The receptive fields of primate ganglion cells have an antagonistic centre-surround organisation
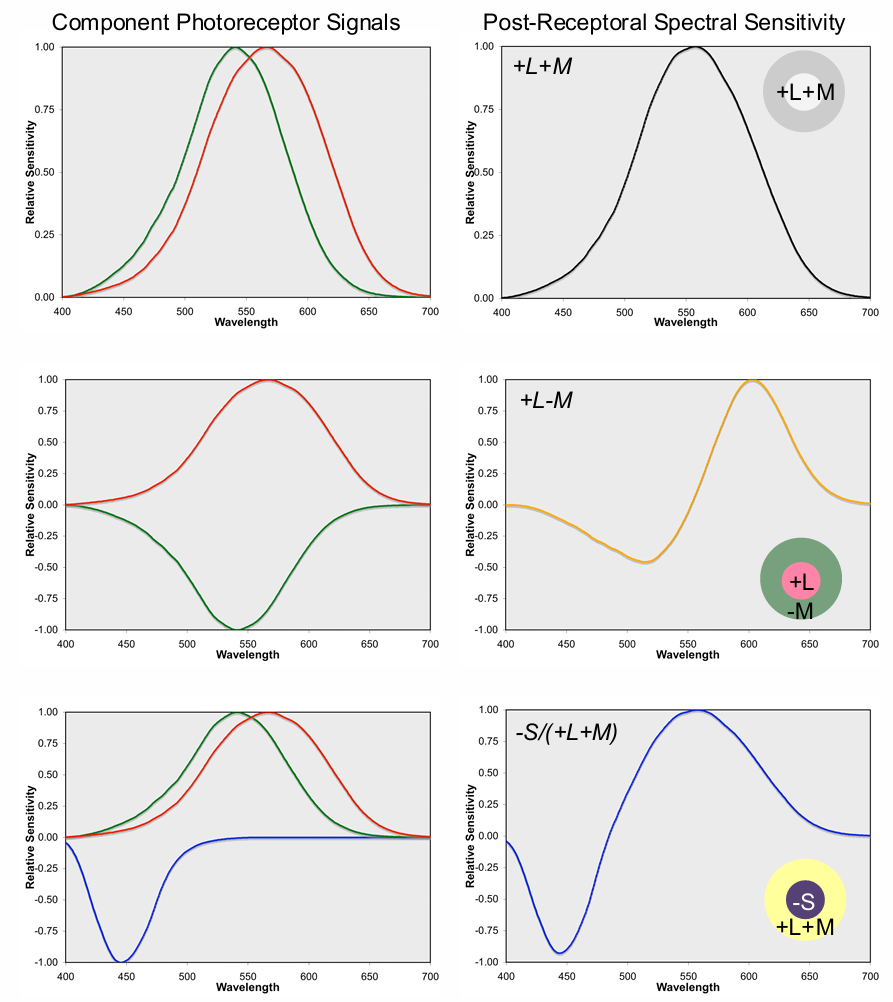
Spectral sensitivities of “second stage” post-receptoral mechanisms (right panel) transform signals from the three classes of cones photoreceptors present at the “first stage” (left panel)
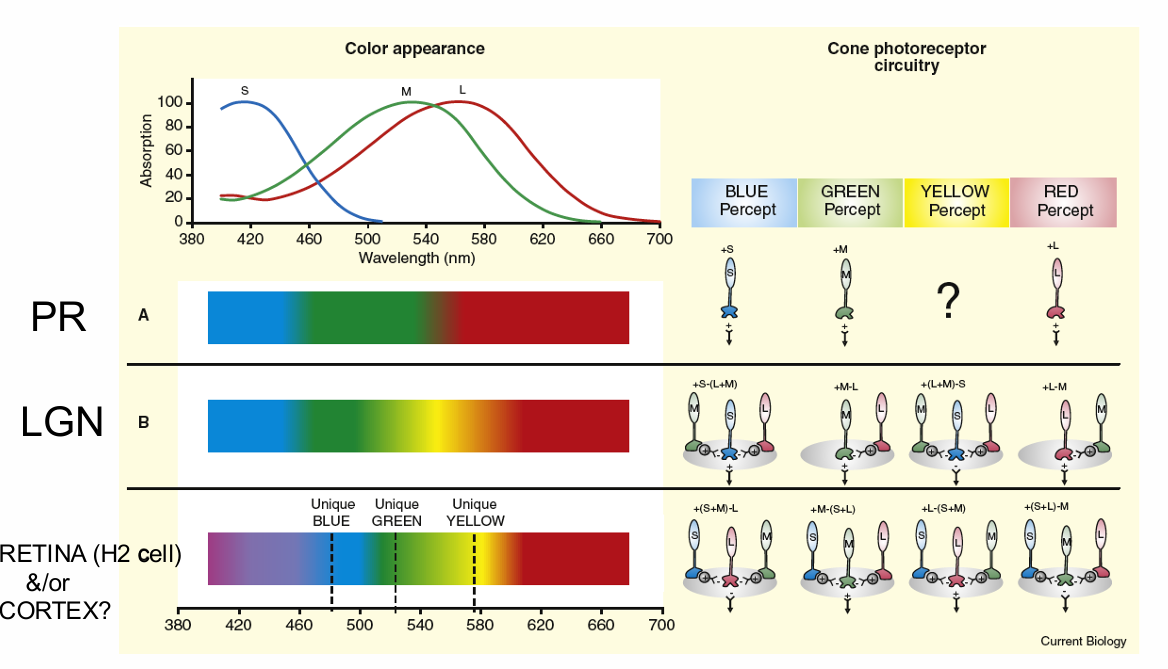
LGN cells compare signals from different cone types. Neural wiring of common LGN cells (right) would produce chromatic responses (spectrum at left) very unlike human colour perception.
Discrepancies noted at time of discovery (e.g., DeValois et al 1966), but largely ignored in textbooks
Appearance of an EES requires neural circuitry responsible for blue, green yellow & red percepts from the 3 cones signals pooled using different combinations of positive and negative signs
Colour in the Environment
What is colour vision for?
Signalling standards (industry, transportation, emergency)
Segmenting the visual world
telling objects apart from one another so we can quickly perform the right action upon objects (e.g., “please hand me the green book”)
CV is aesthetically very pleasing - functionally miss CV when not available as a perceptual cue
Colour very robust to changes due to shading and can efficiently & simultaneously convey information, group & segment
CV evolved to a high level in primates because of its great survival value
Animals & plants are often colourful, and colour vision allows animals to respond to these signals (e.g., to forage for food, choose mates, courtship displays)
Development of colour vision
Newborn children can see some coloured stimuli but are colour deficient compared to adults; by ~6 months, their colour vision is comparable to adults
Animal Colour Vision
Most are monochromatic or dichromatic
Nocturnal animals have none or poor CV
Cats probably don’t have CV, dogs have poor CV
Some animals have trichromatic vision: primates, fish, insects (birds are tetrachromatic)
Quadchromatic vision extends into UV or IR range
Good CV goes with a highly developed eye & brain
Questions to Ask Yourself
What is the trichromatic theory of colour vision? How does it explain colour perception?
Describe the components of the Munsell colour specification system
Elucidate why photoreceptors cannot completely describe colour perception
Discuss how the colour matching experiments are used to create the RGB chromaticity diagram
Explain colour opponency at different stages of the post-receptoral visual pathways
Here's a comparison of the RGB, XYZ, and Luv* colour spaces in a table format:
Feature | RGB | CIE XYZ | CIE Luv* |
|---|---|---|---|
Primaries | Red, Green, Blue | Imaginary (X, Y, Z) | Derived from XYZ |
Origin | Hardware-oriented (displays) | Device-independent | Device-independent, Perceptual uniformity |
Negative Values | Possible | No negative values | No negative values |
Gamut Shape | Cube | Complex, covers all visible colors | More uniform than CIE xy |
Perceptual Uniformity | Not Perceptually Uniform | Not Perceptually Uniform | Designed for better perceptual uniformity |
Use Cases | Display technology, Image capture | Colorimetry, Color space conversion | Color difference measurements |
Calculation | Simple hardware implementation | Matrix transformation from RGB | Non-linear transformation from XYZ |
Math | Simple | Complex | Complex |
Key Differences & Considerations:
RGB:
Easy to implement in hardware but device-dependent.
Not perceptually uniform meaning equal numerical changes in RGB values don't necessarily correspond to equal changes in perceived color.
CIE XYZ:
Serves as the foundation for many other color spaces.
Includes all real colors.
Not perceptually uniform.
CIE Luv*:
Designed to be more perceptually uniform, which is useful for calculating color differences.
Good for applications needing more accurate color difference measurements.