Lecture 3 - Assumptions of ANOVA and Follow-Up Procedures
PSYC214: Statistics Lecture 3 – Assumptions of ANOVA and Follow-Up Procedures
Agenda/Content for Lecture 3
Assumptions of ANOVA
Assumption of independence
Assumption of normality
Assumption of homogeneity of variance
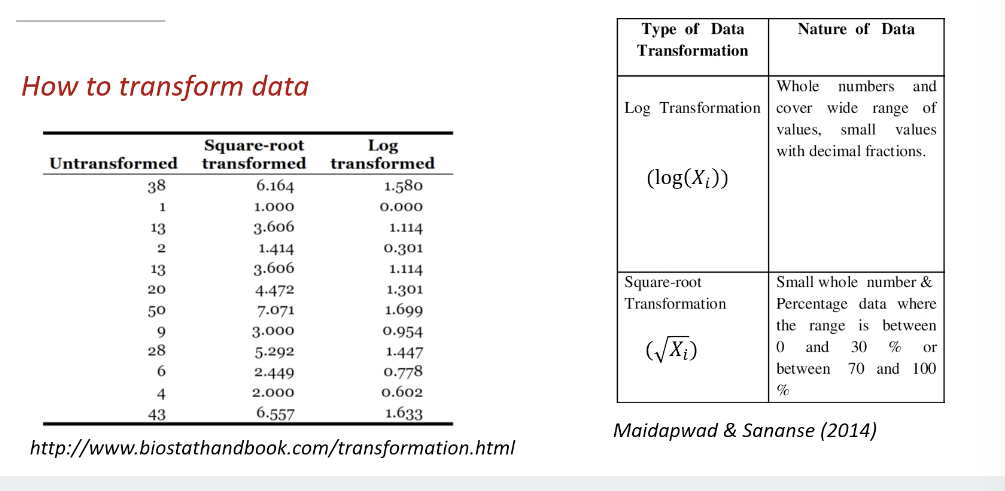
Data transformations
Pairwise between-level comparisons
Planned comparisons
Post-hoc tests
Assumptions of ANOVA
ANOVA is a parametric test requiring adherence to specific assumptions.
Deviations from these assumptions are common, yet ANOVA remains robust to small/moderate deviations.
Note: Highly significant results (p < .01) are less affected by small violations compared to marginally significant results (around p = .05).
Ideal Conditions for ANOVA
Data should ideally be:
Normally distributed.
Equal in participant numbers per level and condition
Measured on an interval/ratio scale.
Detailed Examination of Assumptions
1. Assumption of Independence
Definition: Participants should be randomly assigned to groups with no clustering based on shared characteristics (such as gender or skill level).
Groups should be very independent from each other to avoid contamination
No cluster - people in the group cannot be the same group based on certain characteristics
There should be no instances across one data point to another
Consequences of Violation: Difficult interpretation of results; it's unclear if manipulation affected the outcomes or if results are driven by classification clustering. It also affects the f ratio. the experimental effect may not be the effect
Prevention Measures:
Randomly allocate participants to conditions.
Strive for equal numbers across conditions.
Test for significant differences across important classification variables.
2. Assumption of Normality
Definition: The overall data and subgroups should be normally distributed; crucial because ANOVA relies on the mean and the grand mean, which may not represent a central tendency in skewed data. Needs to be normal as the ANOVA relies on the mean
Consequences of Violation:
Slight skewing generally acceptable;
Problematic if skewed in different directions, potentially leading to Type I and II errors.
Prevention Measures:
Avoid measures with ceiling or floor effects - participants all get high top scores
Transform data if needed, changing every score in a systematic way
Use robust ANOVA or non-parametric alternatives when necessary.
3. Assumption of Homogeneity of Variance
Definition: Variances across groups should be equal; significant variation renders the ANOVA test meaningless.
Homogeneirty - of the same kind
Consequences of Violation: The attempt to test the null hypothesis regarding equal variances becomes futile if variances differ significantly.
Prevention Measures:
Maintain the largest variance no more than four times the smallest variance.
Transform data to stabilize variance or use non-parametric alternatives.
Can be mitigated but difficult to avoid
Dealing with Rogue Data
Strategies for managing outliers include data transformation and applying non-parametric tests like the Kruskal-Wallis test.
Removing outliers can skew results; removal must be justifiable.
Transforming data = involves taking every score from each participant and apply a uniform mathematical function to each
Outliers and their impacts
Data points which are significantly different from other observations
Can drastically bias and change predictive models
Predictors can be exaggerated and present high errors
They can violate assumption
If you want to remove the outlier points, you need to justify why the data has been removed, as this can be misleading to the true score
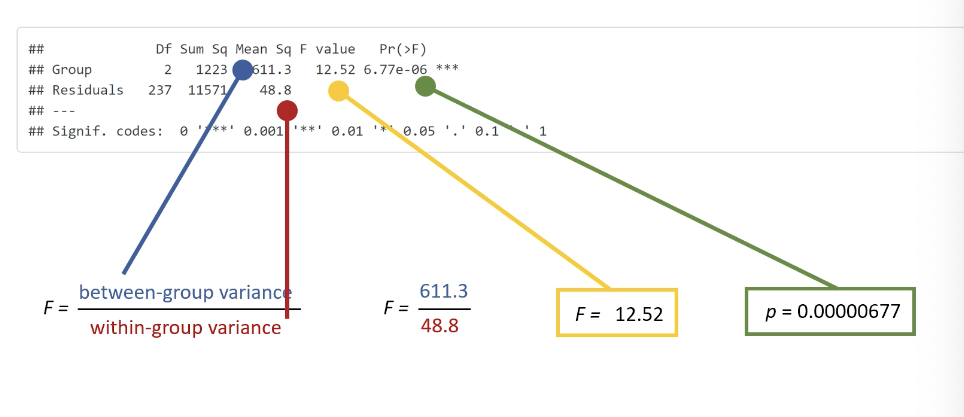
Understanding ANOVA Output
Important output components include degrees of freedom (Df), sum of squares (Sum Sq), mean square (Mean Sq), F value, and significance levels (p values).
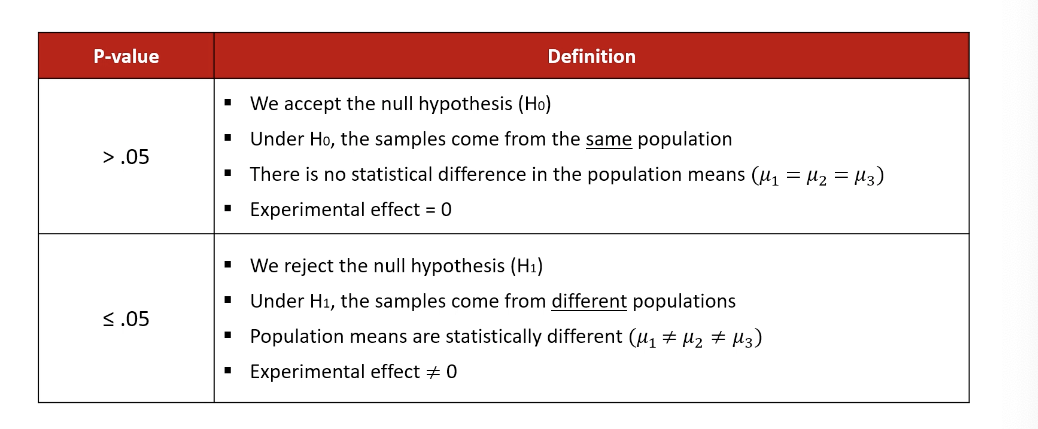
Interpretation of these elements informs whether null hypotheses can be rejected (p > .05 indicates no difference, while p ≤ .05 indicates at least one significant difference).
Follow-Up Procedures After ANOVA
Pairwise Comparisons
Utilize strategies such as:
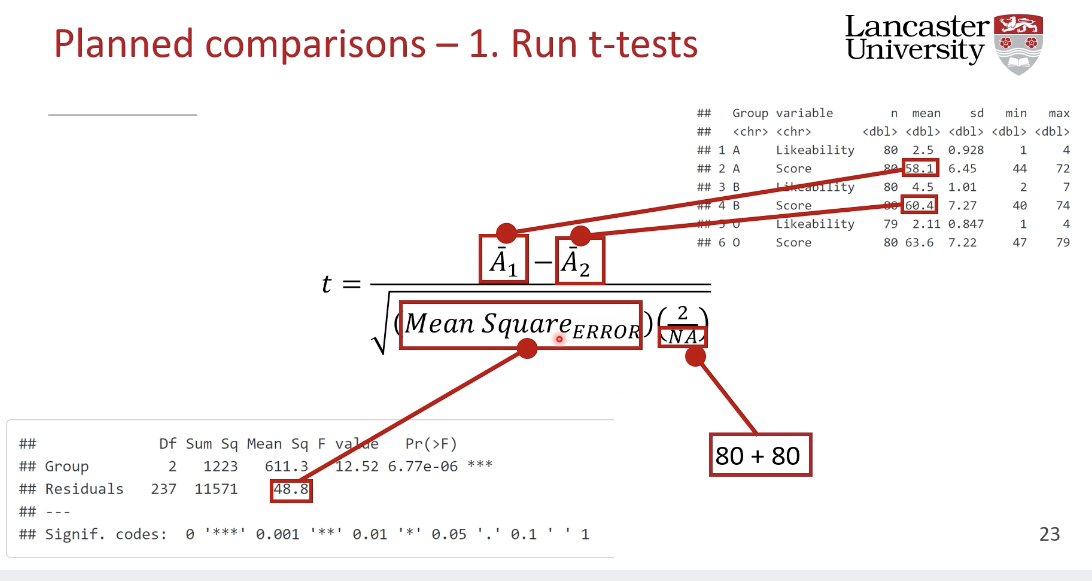
Planned Comparisons: Focused and predetermined interventions comparing specific groups, minimizing Type I errors (ideally limited to number of levels - 1).
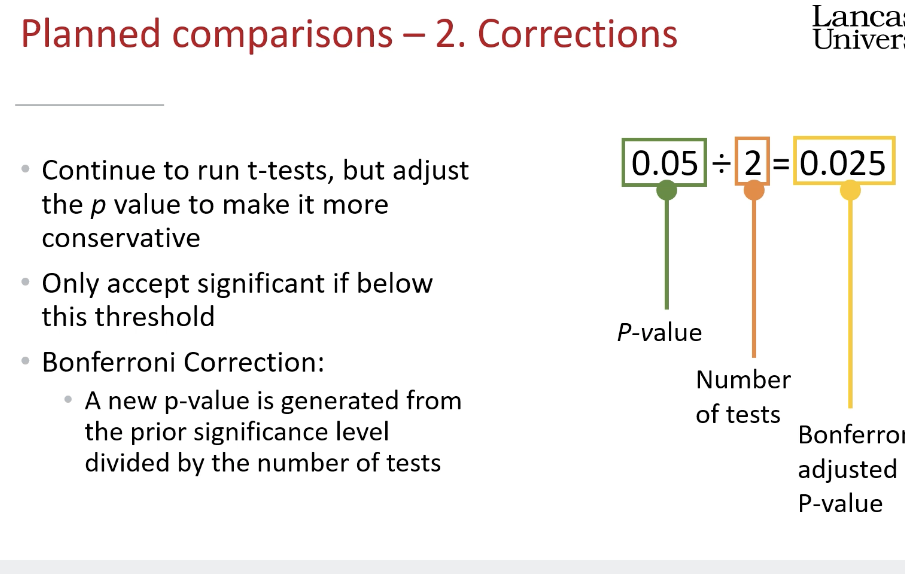
Post-Hoc Comparisons: Assessing all possible group combinations, need to adjust p-values for Type I error control but are less conservative than Bonferroni corrections.
Considerations with Multiple Comparisons
Running numerous t-tests increases risks for Type I errors, alerting to cumulative probability of mistakenly rejecting null hypotheses.
running one test on a type one error = 5%, we change
Post-Hoc Tests
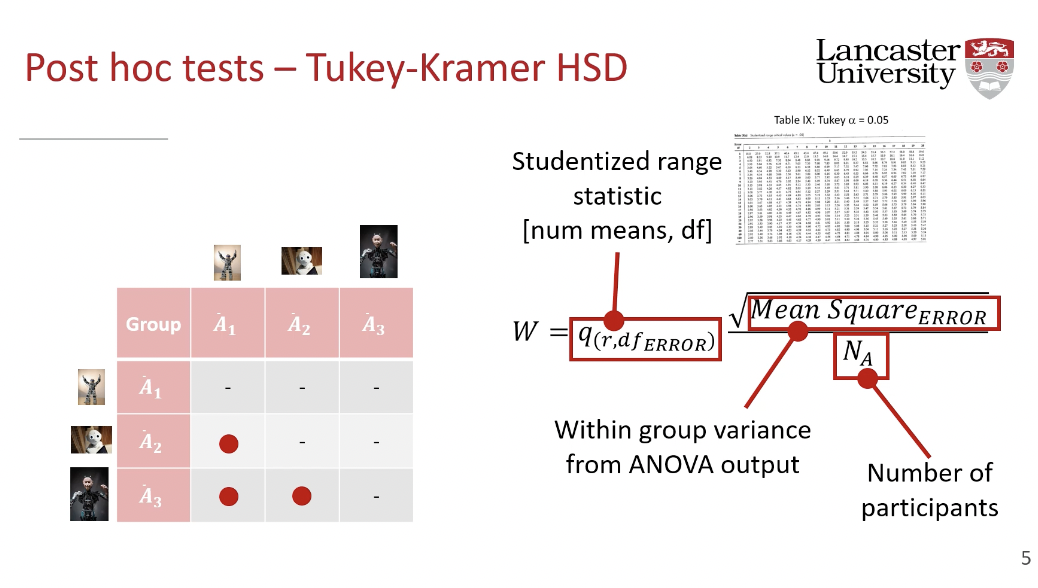
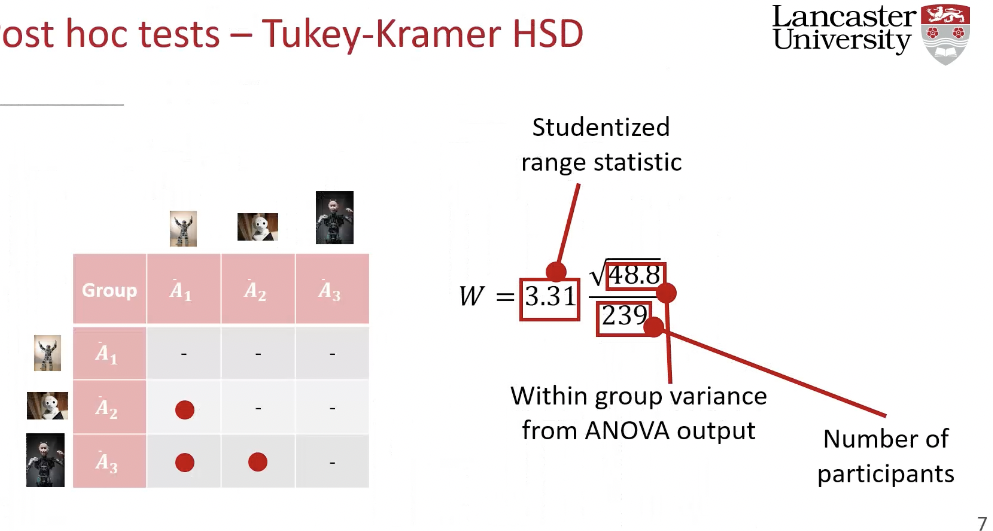
Various post-hoc methods exist (e.g., Tukey-Kramer, Fisher's Protected Least Significant Difference) to control Type I errors while balancing sensitivity to Type II errors.
Results must be interpreted carefully to avoid overreaching in conclusions
A post-hoc test is a statistical analysis that is performed after a study has been completed and the data collected. The term "post hoc" comes from the Latin phrase meaning "after the event". Post-hoc tests are also known as multiple comparison tests (MCTs).
Post-hoc tests are used to: Identify differences between groups, Understand the relationship between a dependent variable and a model, and Identify trends.
Post-hoc tests are typically used when an analysis of variance test is significant and there is a need to uncover specific differences between three or more group means. They are also used in clinical trials when the original hypothesis does not hold.
Post-hoc tests help adjust or "reinterpret" results to account for the risk of Type I error and the compounding uncertainty that is inherent in performing statistical tests.
There are many different post-hoc tests, but most of them will give similar answers. Some of the most commonly used post-hoc tests include: Tukey HSD, Duncan's test, Fisher's LSD, and Bonferroni
The Bonferroni correction is a statistical method used to reduce the number of false positives when multiple statistical tests are performed simultaneously. It's also known as the Bonferroni test or Bonferroni adjustment.