Unit 6 - Market Failure and the Role of Government
6.1 - Socially Efficient Market Outcomes
Allocative Efficiency: MB=MC
Public goods - provided by the government
MSB=Marginal social benefit
MSC= Marginal social cost
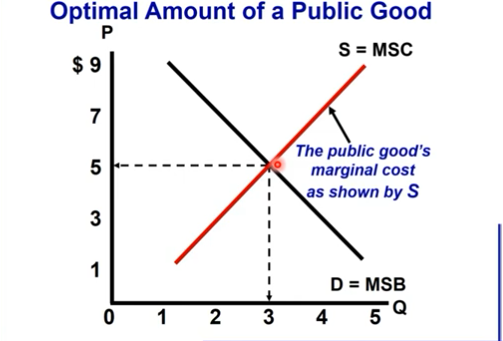
MSB=MSC
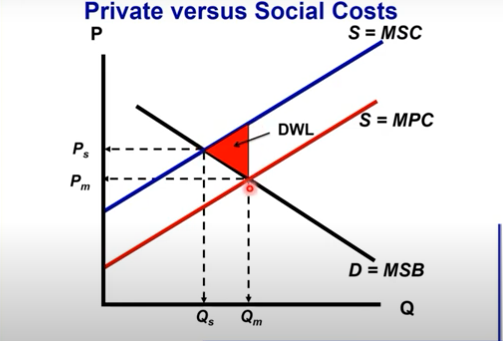
Private vs. Social
Information Failures: inefficient outcome
Asymmetric (unequal) information
about sellers
licensing
weights and measures
about buyers
moral hazard problem
acting recklessly with insurance
adverse selection
insuring more risky than safe people
Deadweight loss - market failure
per unit taxes
binding price controls
imperfect competition
externalities
asymmetric information
insufficient public goods (lack of parks or police)
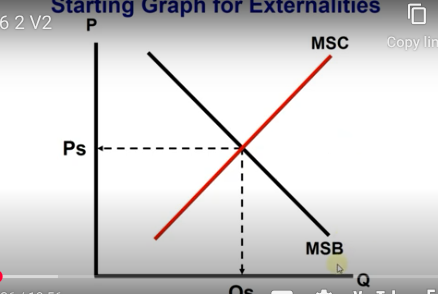
6.2 - Externalities
Think of Domino’s car crash
Market Failure
requires government action
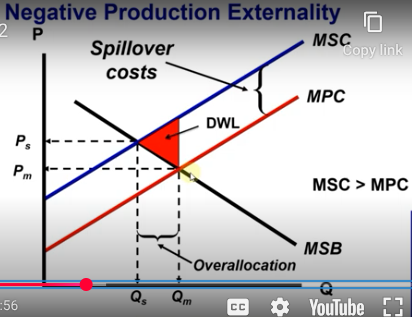
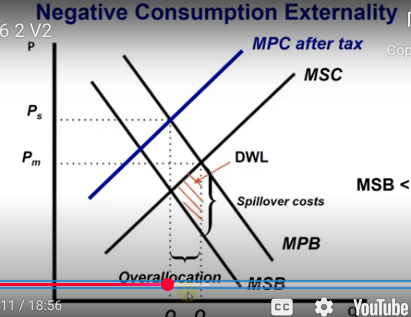
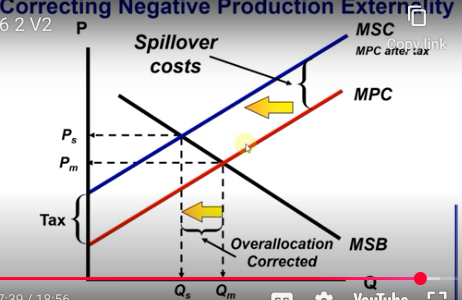
Negative Externality
external (spillover) cost
overproduction
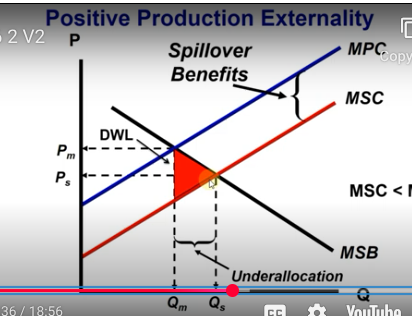
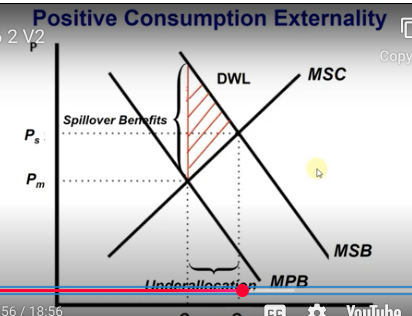
Positive Externality
External (spillover) benefit
Underproduction
Production vs Consumption
production has 2 supply lines
consumption has 2 demand lines
Correcting Externalities
Individual Bargaining - Coase Theorem
resolving externality on your own
Liability Rules and Lawsuits
Government intervention
direct control
taxes and subsidies
environmental regulation
assigned property rights
Per unit taxes and subsidies
Negative externalities
production=tax product
consumption=tax product
Positive externalities
Production=subsidize producer
consumption=subsidize consumer
6.3 - Public and Private Goods
Private Goods
Rivalrous - someone can’t use it bc it has already been used up
Excludable - someone can’t afford it
Demand Curve is Horizontal Summation
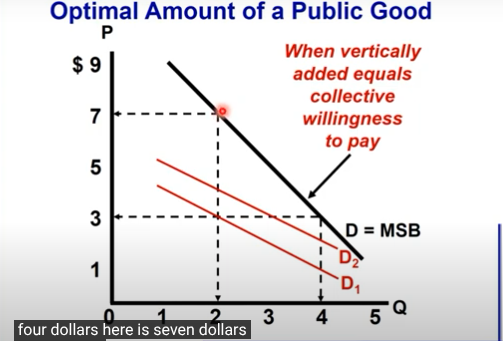
Public Goods
nonrivalrous
not excludable
demand curve is vertical summation
Supplied by the government
Government estimates demand via the census
Compare marginal social benefit (MSB) to marginal social cost (MSC)
Tragedy of the commons
communally owned things/places will not be cared for as much privately owned things/places
Free Rider - people who don’t pay but receive benefits
Other Types of Goods
Excludable but non-rivalrous - anyone who pays gets access
toll or club good
toll roads
pay per view TV
Not excludable but rivalrous - once one pays less can use
Common Pool
fish in the ocean (no one else can catch that fish)
6.4 - The Effects of Government Intervention in Different Market Structures
Taxes and elasticity (Ed and Es)
more elastic curves (S and D) create more DWL
more inelastic curve (S or D) has the higher Tax Incidence
Government Regulation of Monopolies
Antitrust Action
Sherman Act
Clayton Act
Ignore Monopolies if they will be short lived
Regulate Natural Monopolies
Government Set Prices
Socially Optimal Price
P=MC
Fair-Return Price
P=ATC
6.5 - Inequality
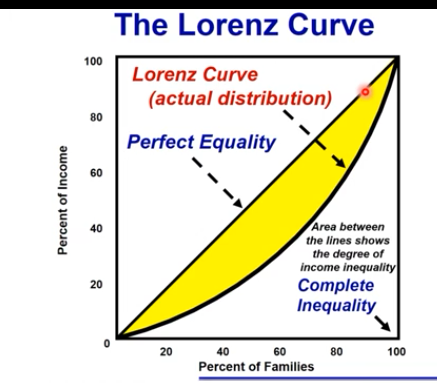
Gini Ratio
Numerical measure of overall dispersion of income
Gini Ratio= Area Between Lorenz Curve and Diagonal / Total area below the diagonal
Effect of government redistribution of cash and noncash transfers
taxing the rich and helping the poor to make banana smaller
U.S. Gini Coefficients
Income after taxes are collecetd and benefits paid: 2024 U.S. Gini Ratio=0.49
Causes of Inequality
Greater demand for skilled workers
Globalization
Higher tuition costs
Decline in unions
Tax cuts for the wealthy
Unequal distribution of wealth
Discrimination
Tax Structures
Tax as a percentage of income:
Progressive tax - a tax system in which the tax rate increases as the taxable income or wealth of an individual or entity increases
Regressive tax - a tax where the tax rate decreases as the taxpayer's income increases
Proportional tax - everyone pays the same rate
analyze the percentage of income, not absolute dollars
Poverty
poverty line
can afford food, clothing, shelter, and adequate transportation - ABOVE the poverty line (bare neccessities)
2024:
Single person < $15,060
Family of 4 < $31,200
37.9 million Americans
Poverty rate 12.1%