Pharmacology Concentration-Response Curve Lecture Notes
Principles of Pharmacology
Introduction
Presented by Dr. Dibesh Thapa from Life Sciences & Medicine, School of Bioscience Education.
Learning Outcomes
After the lecture, students should be able to:
Draw typical "concentration vs response" and "log concentration vs response" curves with appropriately labeled axes.
List some common responses to drugs and explain how they are measured.
Distinguish between in vitro, in vivo, and ex vivo measurements.
Explain the term "EC50" and how it is measured.
Distinguish between the terms "potency", "potency ratio", and "relative potency".
Explain the term "Therapeutic Index" and how it is measured.
Fundamental Quote
"All substances are poisons: There is none which is not a poison. The right dose differentiates a poison and a remedy." - Paracelcus (1493-1541)
Concentration-Response Relationship
Overview
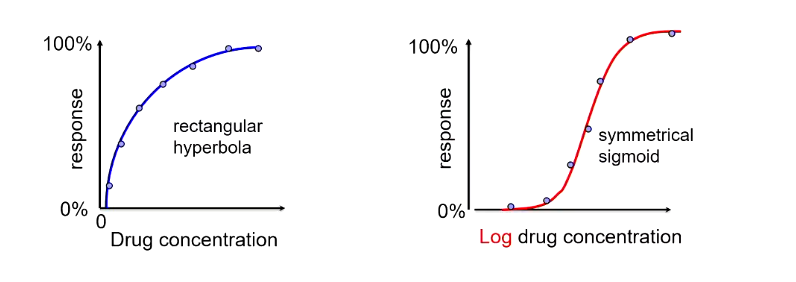
The effects of drugs are "quantified" by studying the relationship between drug concentration (or dose) and the resultant response. This is visualized via concentration-response curves.
Types of Concentration-Response Curves
Rectangular Hyperbola:
Represents drug concentration vs. response.
Y-axis represents response, x-axis is drug concentration
100% response at maximum concentration.
0% response with no drug.
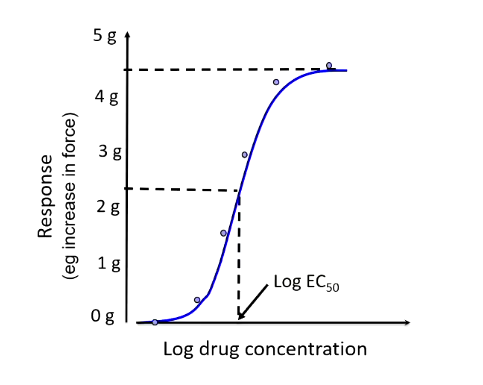
Symmetrical Sigmoid Response:
Represents log drug concentration vs. response.
Provides a clearer understanding of dosage effects.
effect plateaus off - saturated
Logarithmic Scales in Pharmacology
Using logarithmic scales in pharmacology serves multiple important purposes:
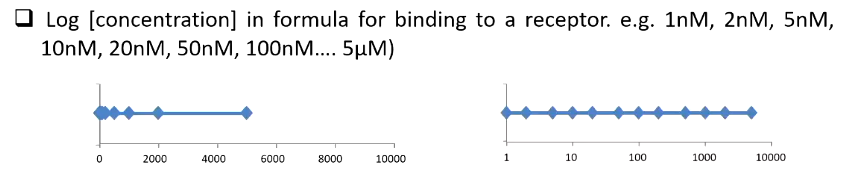
Compression of Low Concentrations:
Linear scales compress low drug concentrations, making it difficult to distinguish effects at nanomolar level.
hard to visualise what the drug is doing at a low concentration
Improved Visualization:
Logarithmic scales evenly space wide-ranging concentrations, improving visualization of pharmacodynamic profiles.
you have to know what exactly each concentration of the dose is doing
Sigmoid Response Curves:
Log scale reveals sigmoid response curves, useful for identifying and comparing EC₅₀ (Effective Concentration) and EC₉₀.
Types of Pharmacological Experiments
Overview
The response measured is determined by the experiment type. There are three main types of pharmacological experiments:
In Vitro Experiments
In Vivo Experiments
Ex Vivo Experiments
In Vitro Experiments
Conducted on a piece of tissue dissected from an animal (or human), kept alive outside the body.
Commonly includes experiments on cells in tissue cultures.
Typical responses measured:
Changes in muscle tension,
Changes in enzyme activity,
Changes in secretion levels of hormones or neurotransmitters.
rate f contraction when the drug is added to the organ bath
Example: Effects of nicotine on noradrenaline release from human cerebral cortex slices (British Journal of Pharmacology, 2002).
In Vivo Experiments
Conducted within a living organism (animal or human).
Includes tightly regulated clinical trials.
Responses measured may include:
Increases in blood pressure,
Reductions in pain thresholds,
Decreases in allergen-induced bronchoconstriction.
Ex Vivo Experiments
Involves removing a tissue or organ from an animal treated with a drug, then testing the effects in vitro.
Similarly tightly regulated by the Home Office in the UK.
Examples include:
Assessing potential liver damage from long-term drug treatment.
Alteration of brain biochemistry.
Measurement Units in In Vitro Experiments
Concentration Units
For in vitro experiments, concentrations are expressed in moles per liter (Molar, M).
1 mole of a substance contains molecules and weighs its molecular mass in grams.
A 1 Molar solution contains 1 mole of a drug in 1 liter of solvent.
Important:
1 Molar solution of drug “X” has the same number of drug molecules as that of drug “Y” at 1 Molar concentration.
Potency of Clinically Useful Drugs
Most clinically useful drugs act at very low concentrations, typically in the range of to .
A solution contains approximately drug molecules per liter.
Prefixes used:
milli (m) for ,
micro (µ) for ,
nano (n) for .
Example: A 1 micromolar (µM) solution is equivalent to a solution.
Concentration-Response Curve Construction
Apparatus Overview
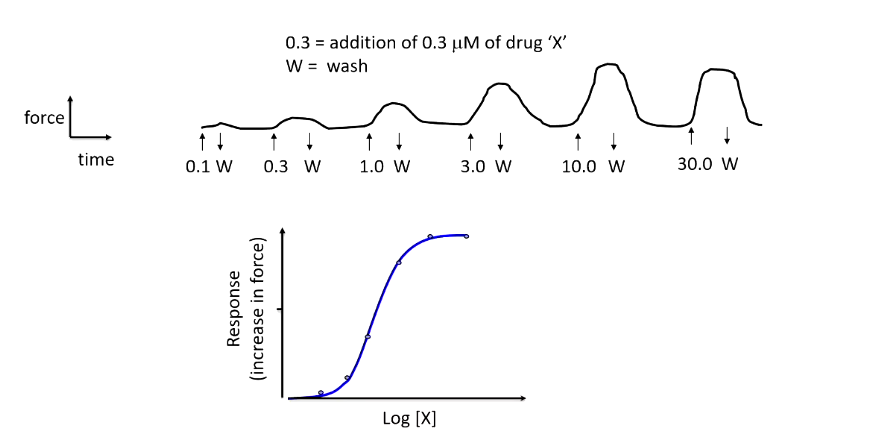
Involves a simplified organ bath apparatus to study muscle reactions.
Response Measurement
Log [X] force over time measuring various concentrations:
Example: Addition of various concentrations will yield different responses in force (e.g., 0.1 W, 0.3 W,… up to 30 W).
concentration-response curve
yaxis = force
xaxis = time
sigmoidal shape
at maximum response it will plateau off
exponential phase, will go up significantly
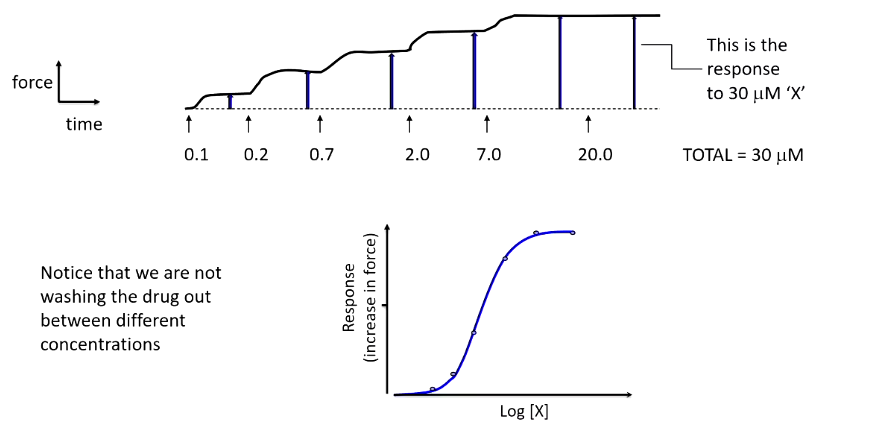
cumulative concentration-response curve
no washing in between concentrations
just keep adding higher concentrations
e.g. it takes a long time for the drug to detatch from the receptor due to binding, no matter how much you wash the drug wont come off, high affinity
In Vivo Dosing Strategies
In in vivo experiments, molar concentrations are impractical due to unknown solvent volumes.
Doses are expressed as weight of drug per weight of animal (e.g., 1 mg/kg).
This allows extrapolating approximate
doses from smaller animals to larger ones, e.g., from a 20g mouse to a 70kg human.
not possible to use molar concentrations/molarity, cant approximate how much blood volume there is between animals
Concentration-Response Curve Details
Maximum Effect (Emax)
Represents the maximum response produced by the drug – the upper limit of the concentration-response curve.
Increasing drug concentration beyond this point yields no further effect.
EC50 Definition
EC50 is defined as the molar concentration that achieves 50% of the maximum response for that drug.
Other values like EC90 or EC20 may also be referenced, indicating different response percentages.
EC50=[0.5Emax]
Potency and Potency Ratio
Potency Definition
Term for a drug's effectiveness at low doses: a potent drug works in very small amounts.
potent drug is effective at a small amount
Quantified by EC50: lower EC50 indicates higher potency.
comparing EC50 values for two drugs wiht the same action allows us to calculate their relative potencies described by the potency ratio
Potency Ratio (M) is defined as:
or .
Allows comparison of new drugs against existing ones to see if its more effective.
Potency Example
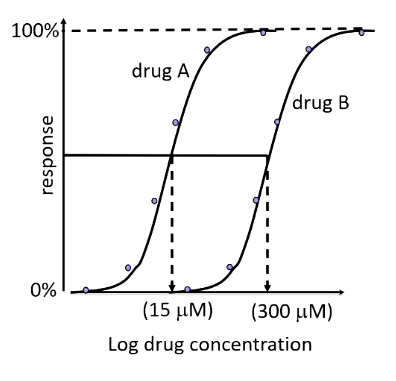
Comparing drugs A and B:
If drug A is more potent, M = 300/15 = 20; 20 times more B is needed to achieve the same effect.
If B were the standard, then M would be less than 1, indicating test drug potency.
e.g. dose A is 1um, dose B is 51mm; dose A is more potent, less drug is needed produce the same 50% response
Therapeutic Index (TI)
TI Definition
Describes the ratio between the toxic dose (LD50) and the effective/theraputic dose (ED50).
Higher therapeutic index indicates lower chance of toxic side-effects in therapeutic use.
we want the TI to be as high as possible to maximize the safety and efficacy of the medication while minimizing the risk of adverse reactions.
TI Calculation
Conventional formula: where:
LD50 = lethal dose for 50% of the population
ED50 = effective dose for 50% of the population
Issues with TI
This definition has limitations:
It is ethically challenging since LD50 represents extreme effects (lethal dose).
In human studies, can be computed as (where TD50 is the toxic dose), but this is not straightforward.
Patient-specific variations in drug response complicate achieving a commonly applicable TI.
Some drugs have varying ED50 values depending on the condition treated (e.g., ibuprofen for headaches vs. arthritis).
Summary Revision Points
True/False Section:
In-vivo experiment involves tissue/organ kept alive outside. (False)
1nM equals . (True)
1 mol of H₂O has the same number of molecules as 1 mol of NaCl. (True)
1 mol of H₂O has the same mass as 1 mol of NaCl. (False)
Practice Session
Express the following in scientific notation:
0.1 nM; 0.5 mM; 10 mM; 30 nM.
Conclusion
Students should be able to construct concentration-response curves, understand drug responses, and explain critical pharmacological terms such as EC50, Potency, and Therapeutic Index by the end of the session.