WK 4 error: populations from samples
sampling distributions
the probability distribution of a statistic (e.g. mean) calculated from manyu samples of the same size taken from the same population
repeat sampling of a statistic
normal distribution
z-distribution
clustered around mean
s.e. = distance from mean
1*s.d. either side of mean captures 68% of theoretical values (i.e. 34%)
mean ± 1*s.e. = 68% of sample
2*s.e. = 95.4%
interpretation
confidence interval = range of values that’s likely to contain the true population values
95% = z score 1.96 from z table
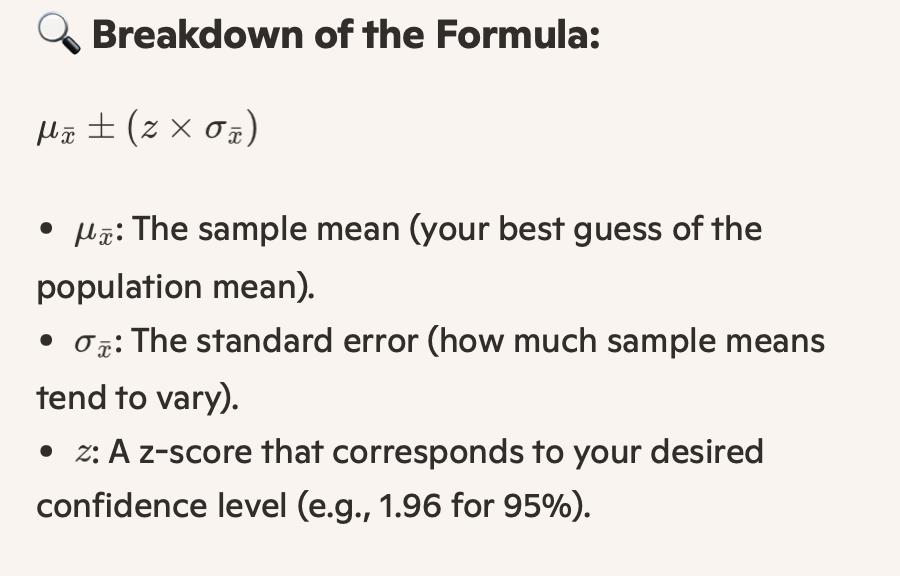
a single mean derived from random sampling can be used to estimate a likely range within which we are confident (to a defined percentage) mean will occur
problems:
z is only applicable to theoretical sampling distributions for which n=infinity
mean is unknown
s.e. is unknown
z distribution
affected by n within individual samples
greater n = greater kurtosis = smaller s.e.
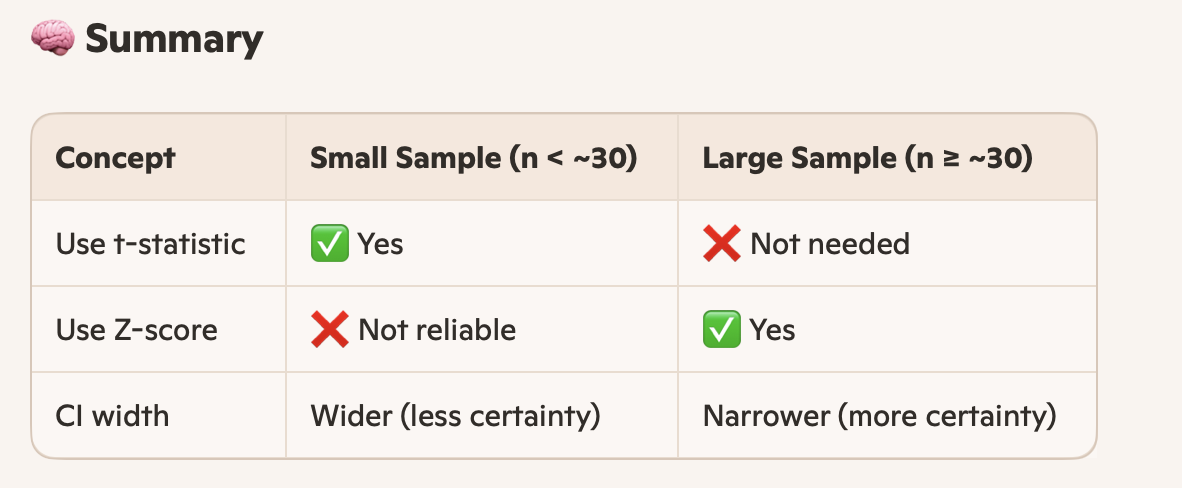
student’s t test
shape consistent with z distrib
kurtosis defined by degrees of freedom (df = n-1)
df increases = t value decreases = CI becomes narrower
eventually t approaches z distribution as n → infinity
sigma x
sigma sample = true s.d. of sample means
usually known
s.e. = estimate of sigma x
s.e.
s.d. of sample mean
reflects how much the sample mean is expected to vary from sample to sample
, s = s.d.
s.e. determines kurtosis of t distribution
small s.e. = narrower distribution = more precise estimate of the population mean
larger sample size = smaller s.d. = narrower CI for the population mean = more certainty in estimate
mean x
replaced by the sample mean
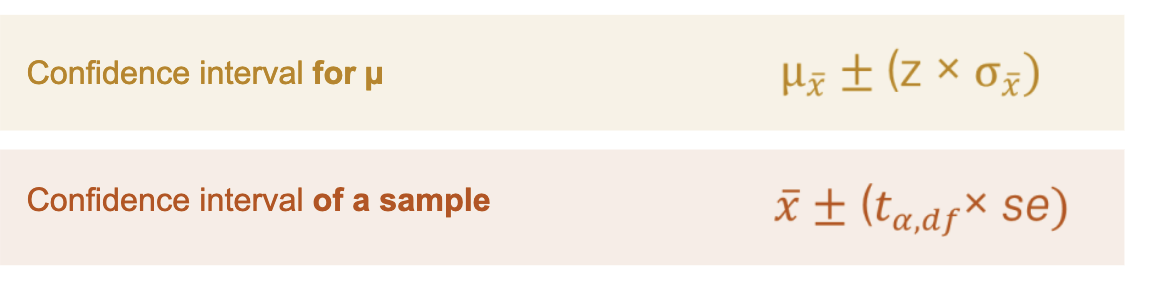
CI
an estimated interval within which an unknown parameter may plausibly lie
implications
probability of including the population parameter (mean) for a defined level of confidence (likelihood)
basis for estimating populations from random samples
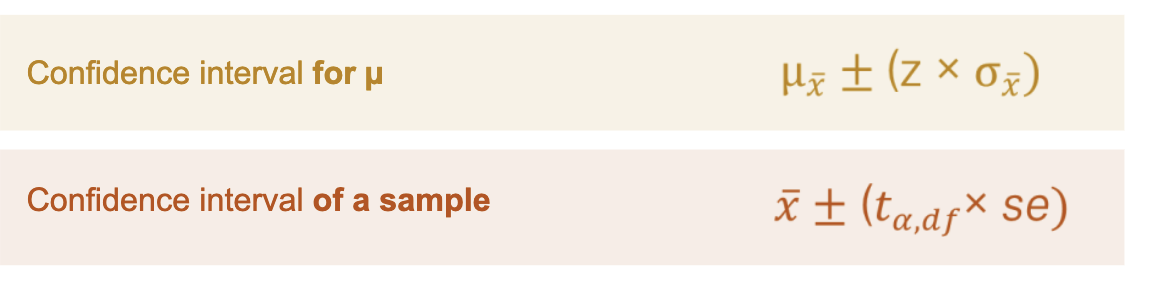
known sigma, large n, normal z, population sigma known
unknown sigma, small n, t distribution, estimate sigma from sample
mean DBH is 48.4 ± 6.08 cm (alpha=0.05)