5.5 Break-Even Analysis
Break-Even:
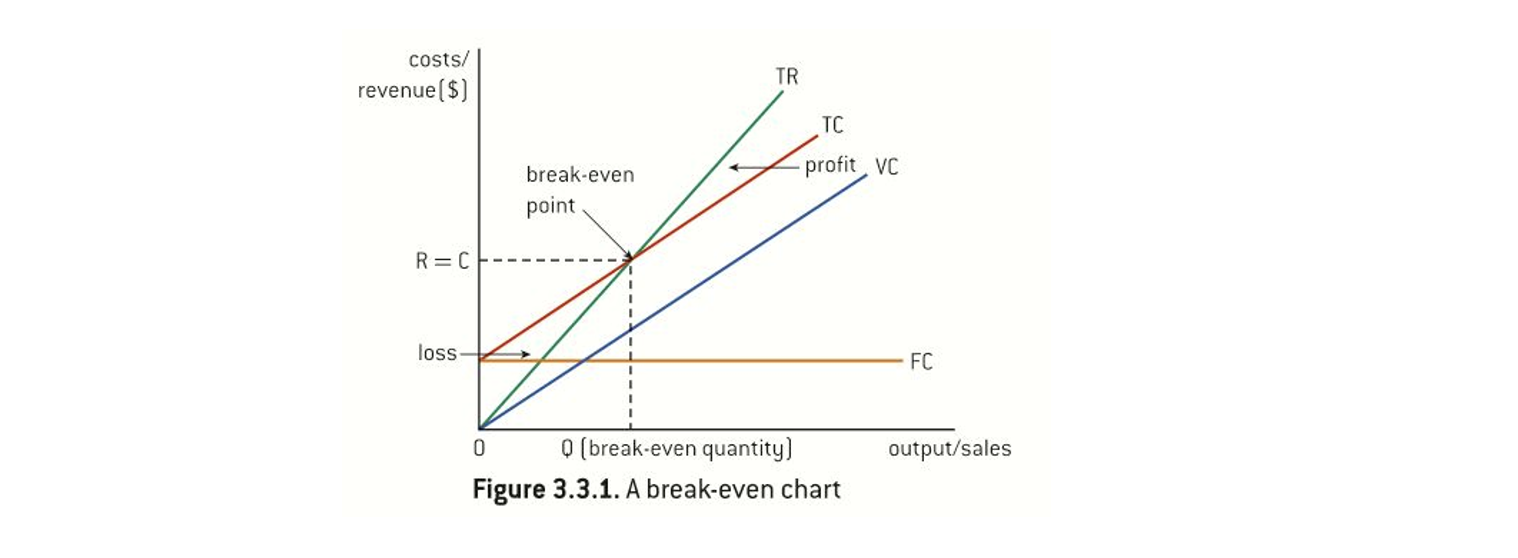
When a business sells enough products to cover all its costs of production.
 Break-Even analysis:
A visual tool that enables managers to interpret the relationship between fixed costs, variable costs, price, revenues, and profits.
Limitations: assumes that costs and revenues are static; Price and costs are assumed to be constant; not always easy to classify certain costs by only using FC and VC; not useful for multi-product businesses; the effectiveness depends on how reliable the data are; pricing strategies differ the prices in this analysis, ignored qualitative issues in decision-making.
Contribution per unit = P - AVC
The break-even quantity (Qbe) = FC/(P - AVC)
Total contribution = (P - AVC)*Q = TR - VC
Profit: When TR > TC, Loss: When TC > TR
Profit = TR - TC = Total contribution - FC
Target profit output (Qt)= (FC + Target profit)/(P - AVC)
Target price = Average FC + AVC = FC/Q + AVC
Margin of safety (MOS)= current output - Qbe