SDS Protocol
Background:
SDS is a method that allows proteins to be analyzed by molecular weight. Proteins will go through the detergent SDS that will denature them. Then they will go through a gel running from negative to positive. SDS is a seperation of mixtures. Structure cannot be deteremined and it’s function is destroyed by the process. This is a limitation.
The purpose of this experiment is to determine the size of unknown protein 3. This is done through a serious of dilutions of unknown protein 3 in order to obtain a more accurate analysis. The protein is added SDS and then ran through a gel electrophoresis in order to determine size.
If the unknown protein is analyzed through the SDS method and ran through a gel electrophoresis, then the band size will migrate and allow to determine size with the use of a molecular weight marker as comparision.
Materials
unknown protein 3
PBS
Sample Buffer
Gel
Gel appartus
Buffer
Pipets
Gloves
Sharpie
Ependor tubes
Centrifuge
Procedure:
Obtain seven ependorf tubes and label 1-7.
Using appropriate pipette, insert 7.5uL of PBS, 7.5uL of the sample buffer and nothing of the unknown protein into tube number 1.
Follow dilution charts and pipette into each appropriate tube.
Place dilutions into the centrifuge to ensure solutions are mixed, ensure to balance the centrifuge.
Place dilution tubes into the thermocycler and boil.
While waiting prepare the gel electrophoresis apparatus.
Place the Gel into the aparatus and fill with buffer till it reaches the 2gel line.
Place dilution tube one into the first gel well. repeat for well 2-7
Add 5uL of ladder to well 8.
Run at 200V for 30 minuetes
After the Gel is done running remove the gel from the apparatus and dump out the buffer
Carefully detach the gel and place into a tray.
Add Coomassie blue dye to the tray and place on the speed rocker
Dumb out the dye and rinse the gel with water
Continue rinsing until the bands are visible
Place gel onto the light tray and measure results using the molecular weight marker.
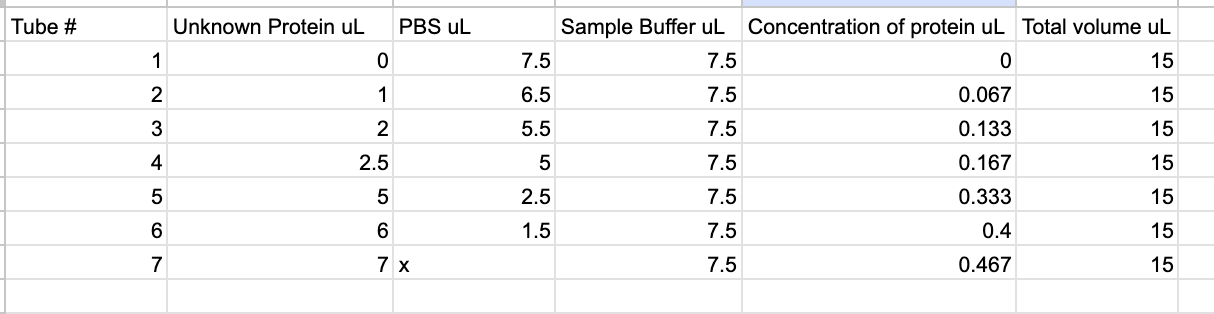
Dilution Table.
Expected results:
The results should reveal distinct bands on the gel that show the migration of the protein based on molecular weight. What is to be expected from this lab procedure is that the band intensity will correlate with the dilution. As the band intensity weakens the dilution increases. The darker the band the greater the concentration. Excel will also be used to measure the migration distance.