5.1-5.4
5.1
Mass spectrometry (MS) measures the mass and molecular weight (MW) of molecules.
It provides structural information by analyzing fragment masses from broken molecules.
Over 20 types of commercial mass spectrometers exist, tailored for various applications.
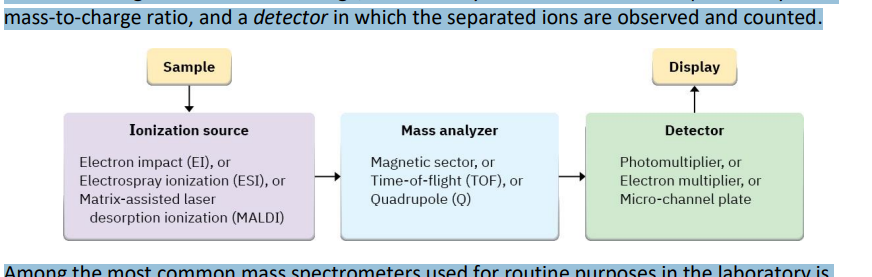
All mass spectrometers have three essential components:
Ionization source: gives electrical charge to sample molecules.
Mass analyzer: separates ions based on their mass-to-charge ratio.
Detector: observes and counts the separated ions.
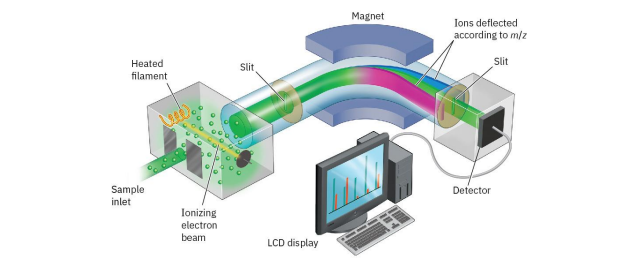
A common type is the electron-impact, magnetic-sector instrument.
Samples are vaporized in the ionization source and bombarded by high-energy electrons (typically around 70 eV).
High-energy electrons dislodge valence electrons from organic molecules, creating cation radicals (positive charge due to lost electron and odd number of electrons).
Electron bombardment gives energy, causing cation radicals to fragment.
Fragments include positively charged and neutral pieces.
Positively charged fragments travel through a magnetic field and are deflected based on their mass-to-charge ratio (m/z).
Neutral fragments are lost on the walls of the pipe.
The mass spectrometer detects and records positively charged fragments as peaks based on m/z ratios.
Each ion typically has one charge, so m/z equals its mass (m).
Instruments can analyze masses up to about 2500 atomic mass units (amu).
Common types of mass spectrometers include magnetic-sector and quadrupole mass analyzers.
Quadrupole mass analyzers use four rods and an oscillating electrostatic field to filter specific m/z values.
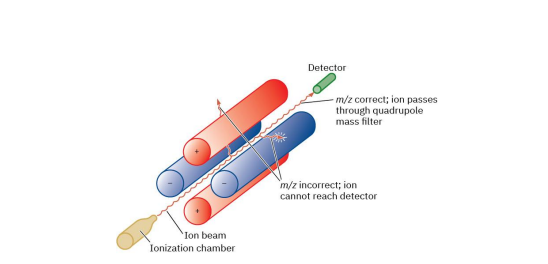
Quadrupole Mass Analyzer: Only ions with specific m/z values reach the detector; others collide with the rods.
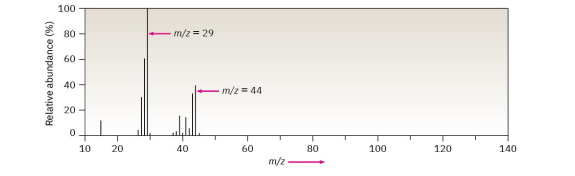
Mass Spectrum Representation: Presented as a bar graph.
X-axis: Masses (m/z values)
Y-axis: Intensity or relative abundance of ions
Base Peak: Tallest peak, assigned intensity of 100%.
Parent Peak (M+ or M): Peak corresponding to unfragmented cation radical.
Example: Mass spectrum of propane (C3H8; MW = 44).
Molecular ion at m/z = 44 is about 30% as high as the base peak at m/z = 29.
Complex fragmentation patterns with multiple other fragment ions present.
5.2
Mass spectrum provides molecular weight (e.g., hexane MW = 86, hex-1-ene MW = 84, hex-1-yne MW = 82).
Alkene formulas (CnH2n) have fewer hydrogens than alkanes (CnH2n+2).
Each ring or double bond decreases hydrogen count by two.
Degree of unsaturation indicates number of rings/multiple bonds.
Example: Unknown hydrocarbon with m/z = 82 corresponds to C6H10, indicating degree of unsaturation = 2 based on hexane (C6H14, MW = 86).
Degree of unsaturation can indicate the presence of double bonds, rings, or triple bonds.
Can apply similar calculations for organohalogen compounds (C, H, X), where X = F, Cl, Br, or I. Halogens replace hydrogens in the formula.
Organooxygen compounds (C, H, O):
Oxygen forms two bonds, so it does not affect the formula of an equivalent hydrocarbon when calculating the degree of unsaturation.
Example: C5H8O is equivalent to C5H8, corresponding to two degrees of unsaturation.
Structure change: C−C becomes C−O−C or C−H becomes C−O−H, with no change in hydrogen counts.
Organonitrogen compounds (C, H, N):
Nitrogen forms three bonds, resulting in one extra hydrogen compared to a related hydrocarbon.
For equivalent hydrocarbon formula, subtract nitrogen atoms from hydrogen counts.
Example: C5H9N is equivalent to C5H8, indicating two degrees of unsaturation.
Summary for degree of unsaturation calculations:
Add the number of halogens to the number of hydrogens.
Ignore the number of oxygens.
Subtract the number of nitrogens from the number of hydrogens.
5.3
Double-focusing mass spectrometers have two magnetic sectors, providing high resolution with mass measurements accurate to 5 ppm (0.0005 amu).
These instruments can distinguish compounds with the same nominal mass, e.g., C5H12 (MW = 72, exact mass = 72.0939 amu) vs. C4H8O (exact mass = 72.0575 amu).
Exact mass measurements pertain to specific isotopic compositions, not average atomic masses from the periodic table.
Some compounds, like 2,2-dimethylpropane, may not show a molecular ion in the electron-impact mass spectrum due to easy fragmentation.
The "rule of 13" helps calculate possible molecular formulas from a molecular ion m/z value by determining the number of carbon and hydrogen atoms.
The nitrogen rule indicates that a molecular ion with an odd mass has an odd number of nitrogen atoms, and even masses have either no or an even number of nitrogen atoms.
A small peak at M + 1 is often observed due to isotopes like 13C and 2H in the analyzed molecules.
Mass spectrometry provides a "molecular fingerprint" of compounds, allowing for identification via a database of spectra.
Fragmentation patterns can indicate structural information, as organic compounds fragment uniquely based on their structures.
Complex fragmentation can make it challenging to assign structures to fragment ions, but some patterns yield insights into possible molecular structures.
5.4
Mass Spectrometry of Common Functional Groups:
Alcohols:
Fragment via alpha cleavage and dehydration.
Alpha cleavage breaks the C–C bond near the hydroxyl group, producing neutral radical and oxygen-containing cation.
Dehydration removes water, yielding alkene radical cation (mass 18 amu less than M+).
Ethers:
Contain two C–O single bonds, capable of alpha cleavage on either side of the oxygen.
Symmetrical ethers yield the same fragment, while asymmetric ethers form different fragments based on stability of radicals.
Amines:
Odd number of nitrogen atoms results in odd-numbered molecular weight.
Aliphatic amines undergo alpha cleavage similar to alcohols; produces alkyl radical and nitrogen-containing cation.
Example: Triethylamine shows base peak at m/z = 86 from methyl group loss.
Halides:
Elements with isotopes (e.g., Cl, Br) create distinctive appearance in mass spectra.
Chloroethane example shows molecular ion at m/z = 64 and M + 2 peak at m/z = 66 (ratio ~ 3:1).
1-Bromohexane shows m/z = 164 for 79Br ions and 166 for 81Br.
Carbonyl Compounds:
Ketones and aldehydes with a hydrogen on the carbon three atoms away exhibit McLafferty rearrangement and alpha cleavage.
McLafferty rearrangement produces neutral alkene and charge stays with the oxygen-containing fragment.
Butyrophenone spectrum shows alpha cleavage loss of C3H7 and McLafferty loss of C2H4.