Past and Future Climate Change
Learning Objectives
Week 10
Understand fluctuations and causes of long-term climate change
Be familiar with key hothouse and icehouse states in Earth’s history
Understand how long-term climate change is controlled by the long-term carbon cycle
Know the difference between climate change and weather
Week 11
climate forcing
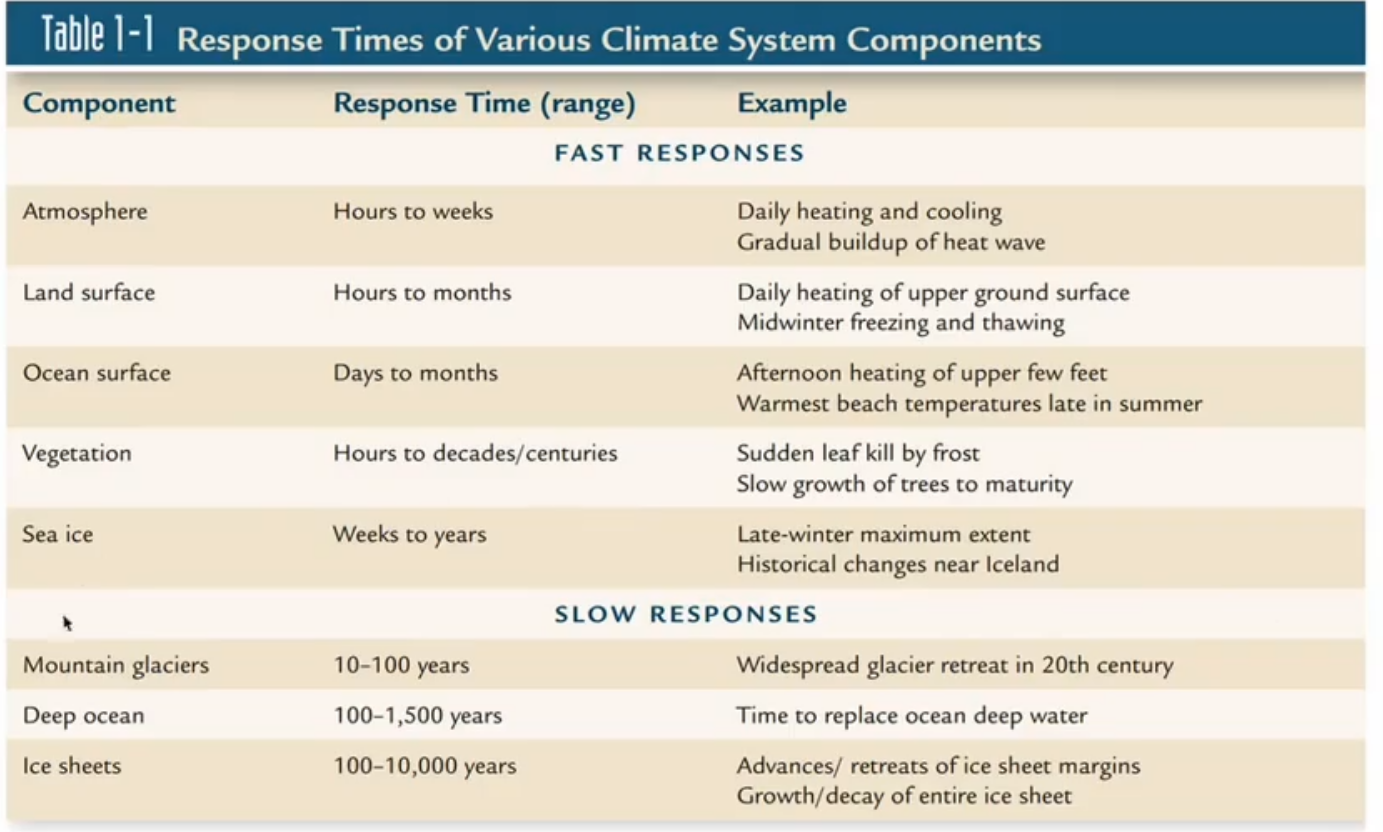
climate response and timescales of climate change
climate feedbacks and feedback mechanisms
chemical weathering and the role it plays in regulating long-term climate
causes of climate change
orbital changes in climate records
millennial oscillations in climate (with key examples)
historical changes in climate (with key examples)
future global climate projections
Week 12
Understand the different types of sea level
Understand how sea level is measured or determined
Understand causes of sea level change
Understand causes and consequences of current sea level rise
Be familiar with the Eromanga Sea
Be familiar with the Western Interior Seaway
Be familiar with the impact of the last glacial maximum on sea level
Chunk 1
Climate change
Long term regional or global average of temperature, humidity and rainfall patterns over seasons years or decades
Climate is weather averaged over a long period of time
Climate change is the significant variation of average weather conditions over several decade or longer
Past climate offer predictions for future
Loss of reflective ice cooling ‘albedo’ Replaced by dark ocean warming
Albedo is measured by a surfaces ability to reflect radiation and rated between 0 and 1. snow (0.85), Ocean (0.1)
Ice albedo is a positive feedback group - initial warming leads to decreased ice cover = more absorption
Earth must radiate the same amount of energy it receives from the sun into space.
Moving energy around by circulation of the atmosphere and the oceans
Paleoclimate proxy data
Paleoclimate proxy data are physical, biological and chemical materials preserved in the geological record that can stand in for direct measurement of past climate
Physical proxies →
Biological proxies → fossils
Chemical Proxies → isotopes, silica and gas content in ice cores
Diatoms, forams and corals as well as ice cores, tree rings and sediment cores that contain diatoms, Microbiota, pollen an charcoal within a sedimentary record
Sediment composition
Shell chemistry or water temp and precipitation.
Opal - biogenic silica
Charles Lyell - explaining past climates. Coal shows past rainforest
White cliffs of dover ~170 Ma. Chak deposited in warm waters
Louis Agassiz’s - formulated the concept of continental glaciation
Glendonites and dropstones display cold climates
Salt deposits - Evapourites only form under warm to dry conditions. halite (NaCl), gypsum.
Sand dunes - typical desert environment
Coral reefs - moderately warm waters
Glacial deposits → diamictites or tillites have boulders and cobbles in a matrix of finer-grained sediment,
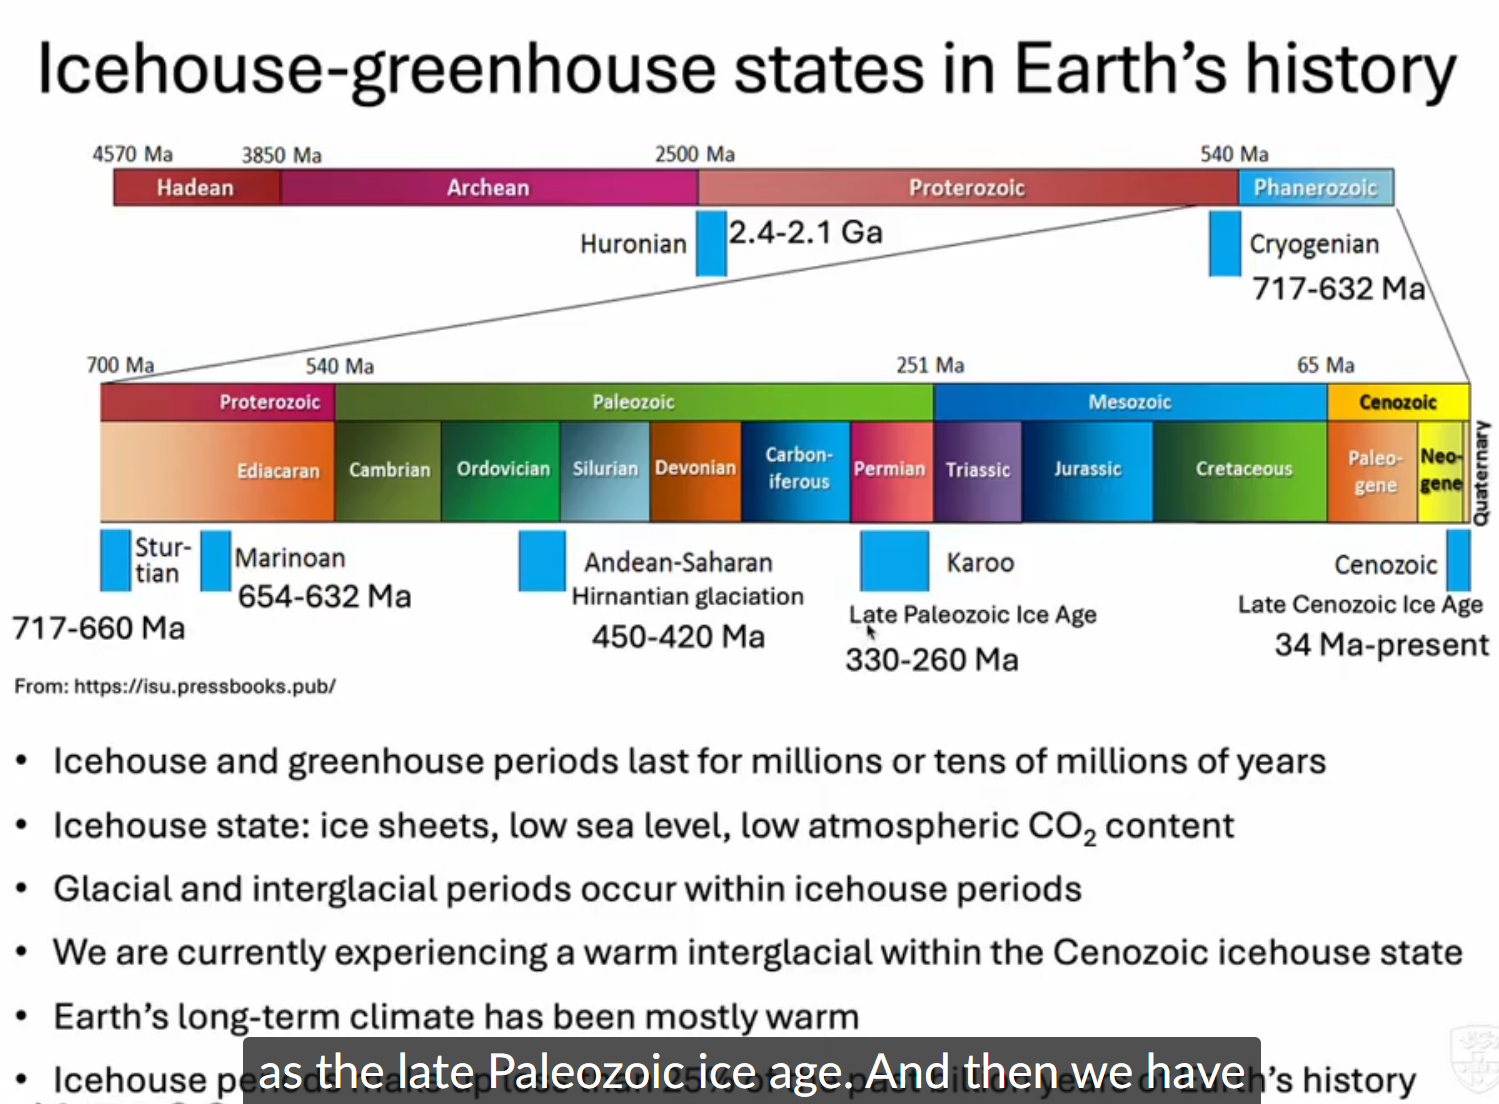
Icehouse-greenhouse states in Earth’s history
5 major ice ages
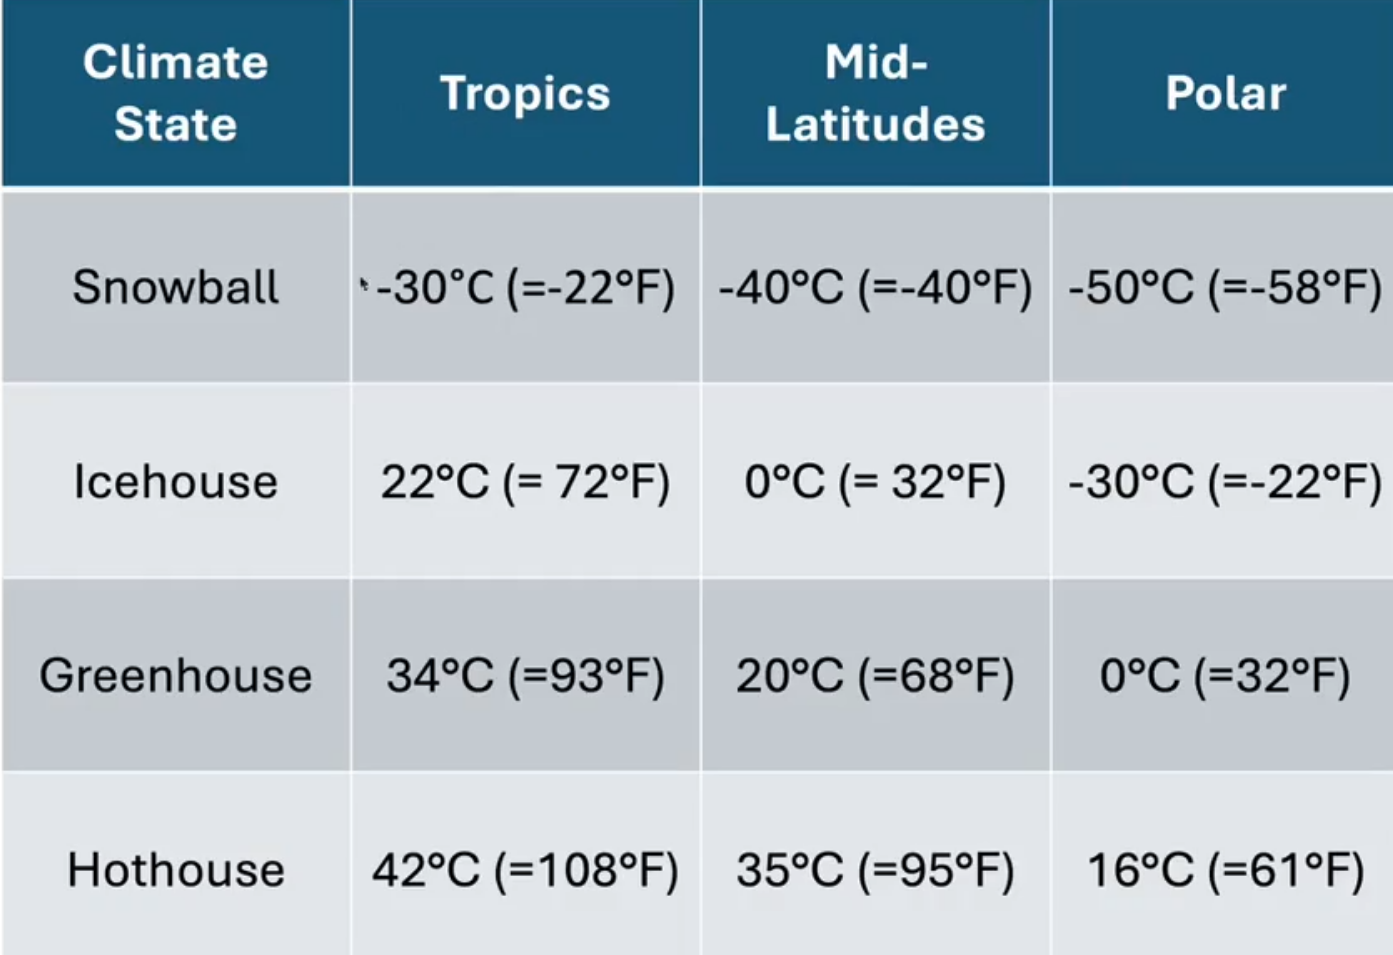
Geologists refer to global temp ~ < 20 degrees = 75% green house climate states
CO2 very abundant in the atmosphere
25% - icehouse
current temp 115-17
Hurron Ontario. 2.4 -2.1 billion years ago
Cryogenian - 60 million year glaciation
Post Cryogeninan large and complex life
Collison of Indian and Himalayan plate increased weathering and erosion rates
Higher than normal rates of weathering of rocks with silicate minerals (Feldspar) consumes CO2 from atmosphere → reduces greenhouse effect → long term cooling
How can we know what the temperature was million of years ago?
Causes of long-term Climate change
Athropogenic activity - short term
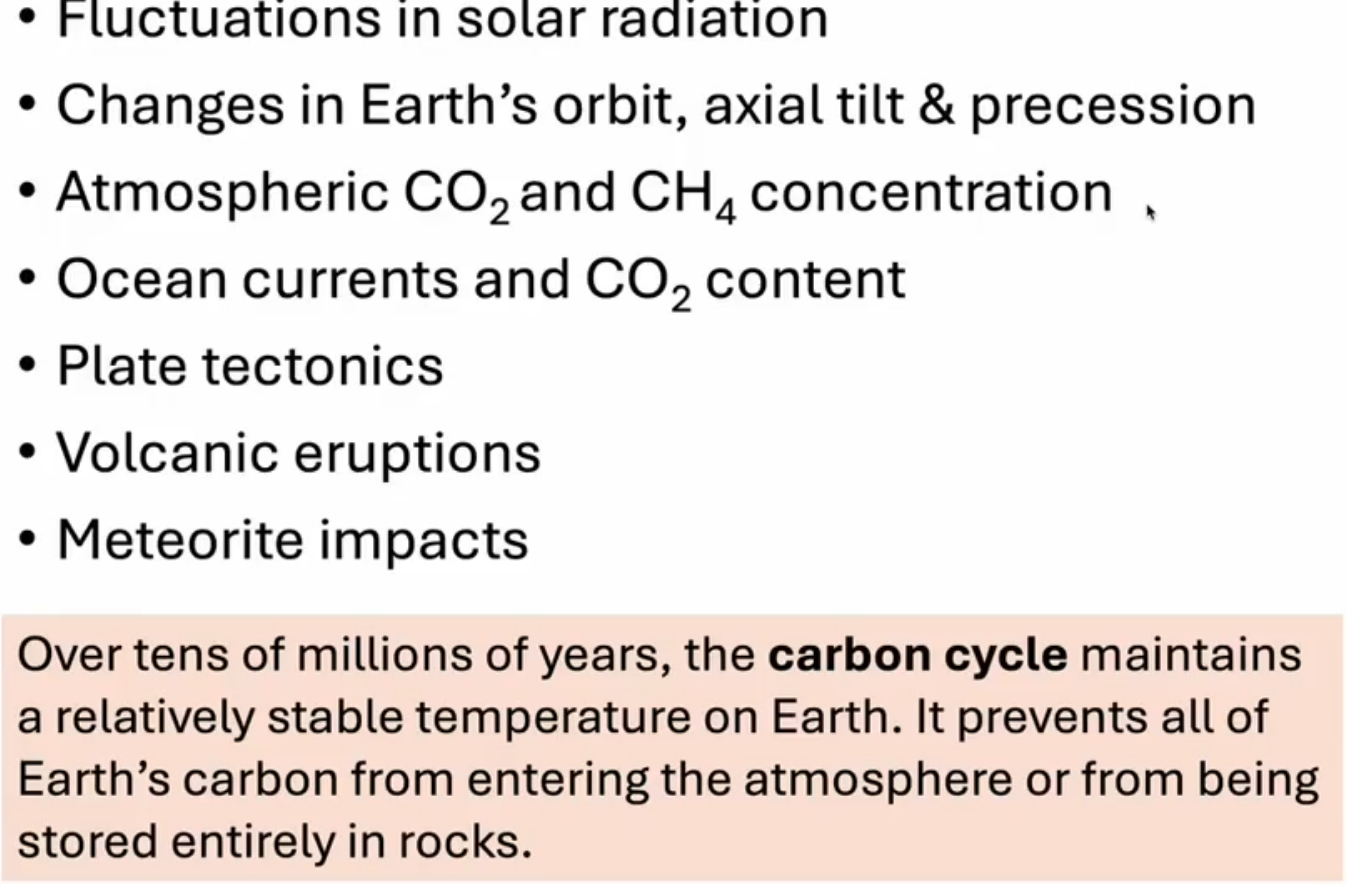
CO2 stays in atmosphere for decades. methane short time lived in atmosphere
Ocean currents store large amounts of heat
¼ co2 trapped in ocean
Plate tectonics, mountain forming and volcanoes → aerosols and → gaseous particles, tephra and ash → sunlight interacts with the material expelled.
Meteorites such as Chicxulub in the Gulf of Mexico → extinction of dinos → expell particles into the atmosphere
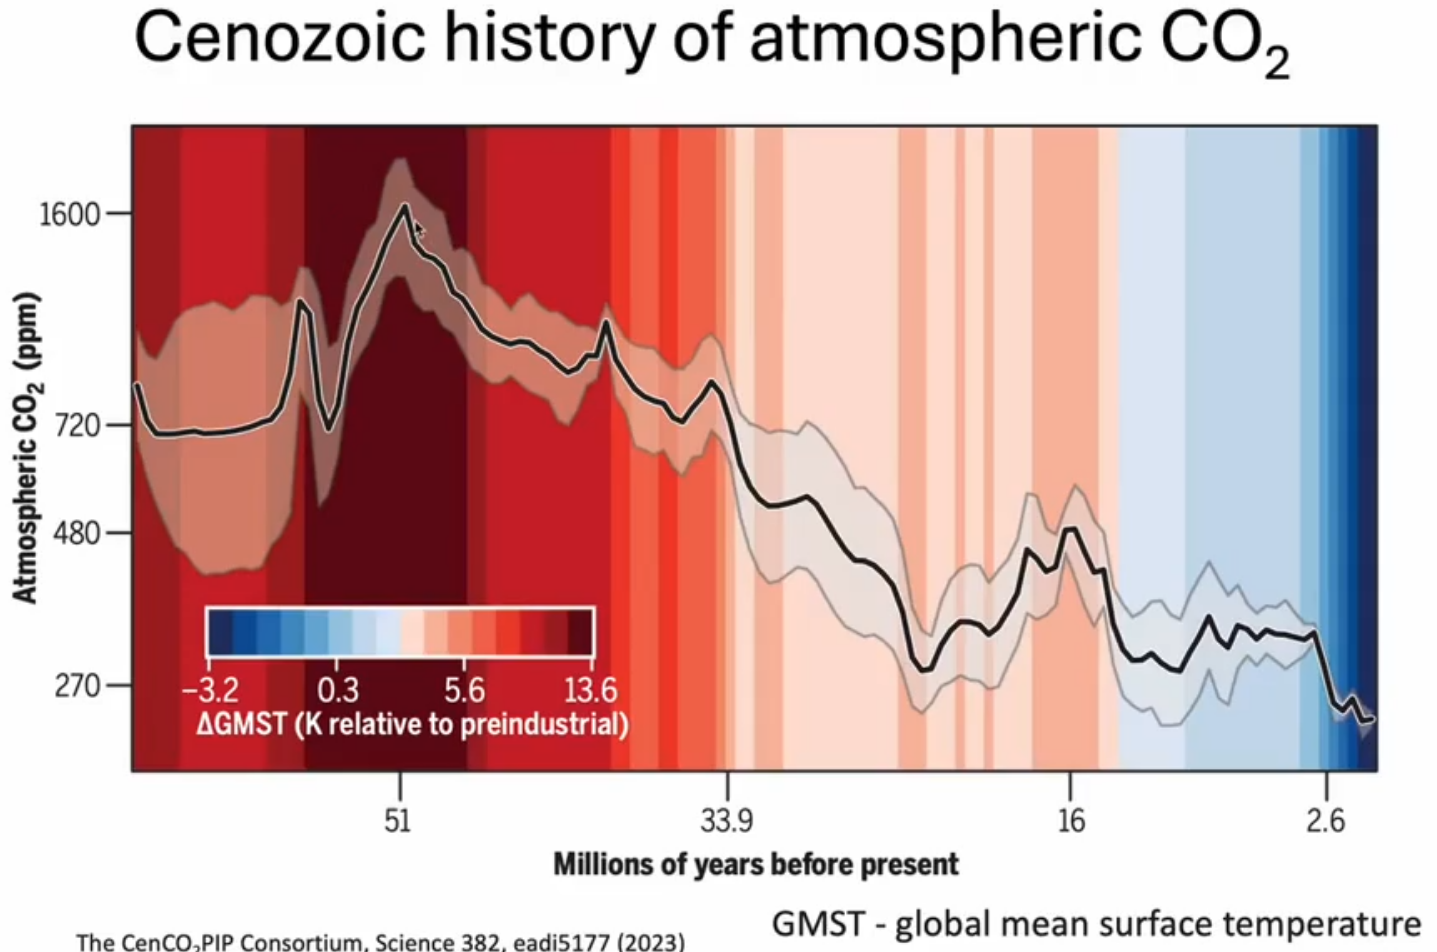
CO2 regulator of Phanerozoic Climate
Relative rates of volcanic outgassing, weathering of silicate rocks
intensified continental plate Collison results in more mountain building and chemical weathering
weathering uses atmos CO2 → reduces concertation → cooler global temps
Rain → carbonic acid and dissolves minerals (Ca, mg) silicate weathering
Mountains weather easiest, CaCO3 in the ocean → cocoliths or forams
Sink and bury in the rock - locks carbon away
Co2 returns the atmosphere through subduction and volcanism
100,000 years to go through this cycle
Slow carbon cycle is earths thermostat regulator
Lecture 1 - Earth’s Climate History
Snowball earth ~ 717 Ma
Hothouse Earth ~ 56 Ma
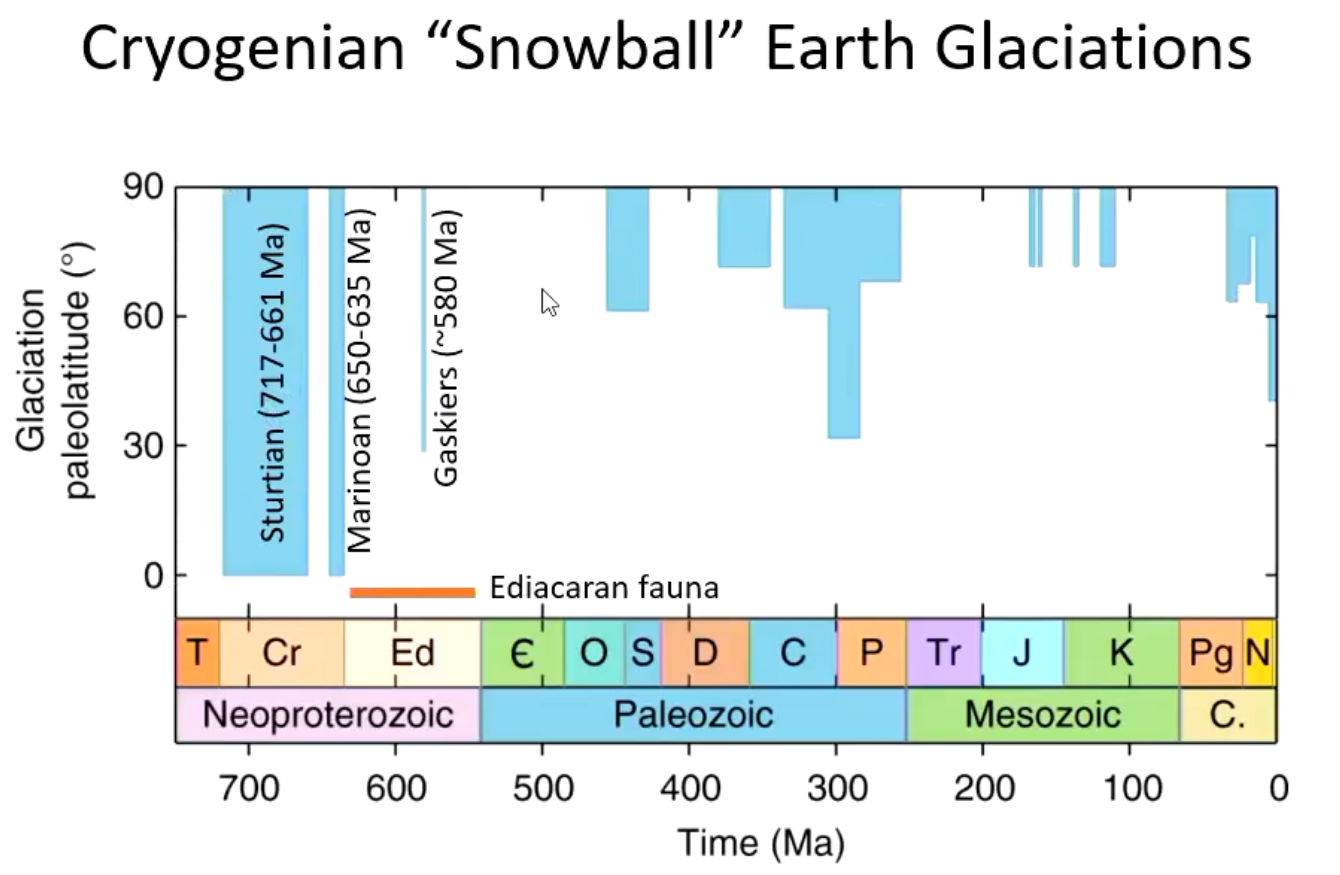
Cryogenian “snowball” earth Glaciations
Sturtian (717-661 Ma) extreme glaciation
Marinoan
Gaskiers - shorter
Australia - tillites found from sturtian
Evidence of glaciation → Striations (Rare), Tillites and drop stones
Glacial diamictite
erratics, dropped into deep sea sediments, layers are disrupted
Rodinia super continent before Pangea
Franklin Large Igneous Province (LIP) → started to weather and increased cold
humid environment weathers more
Late Paleozoic Ice Age (LPIA) - Permian Glaciation
330 - 260 Ma
CO2 level very low Oxygen levels were high
Only transition from icehouse to greenhouse when the earth was vegetated
Plants response to the changes
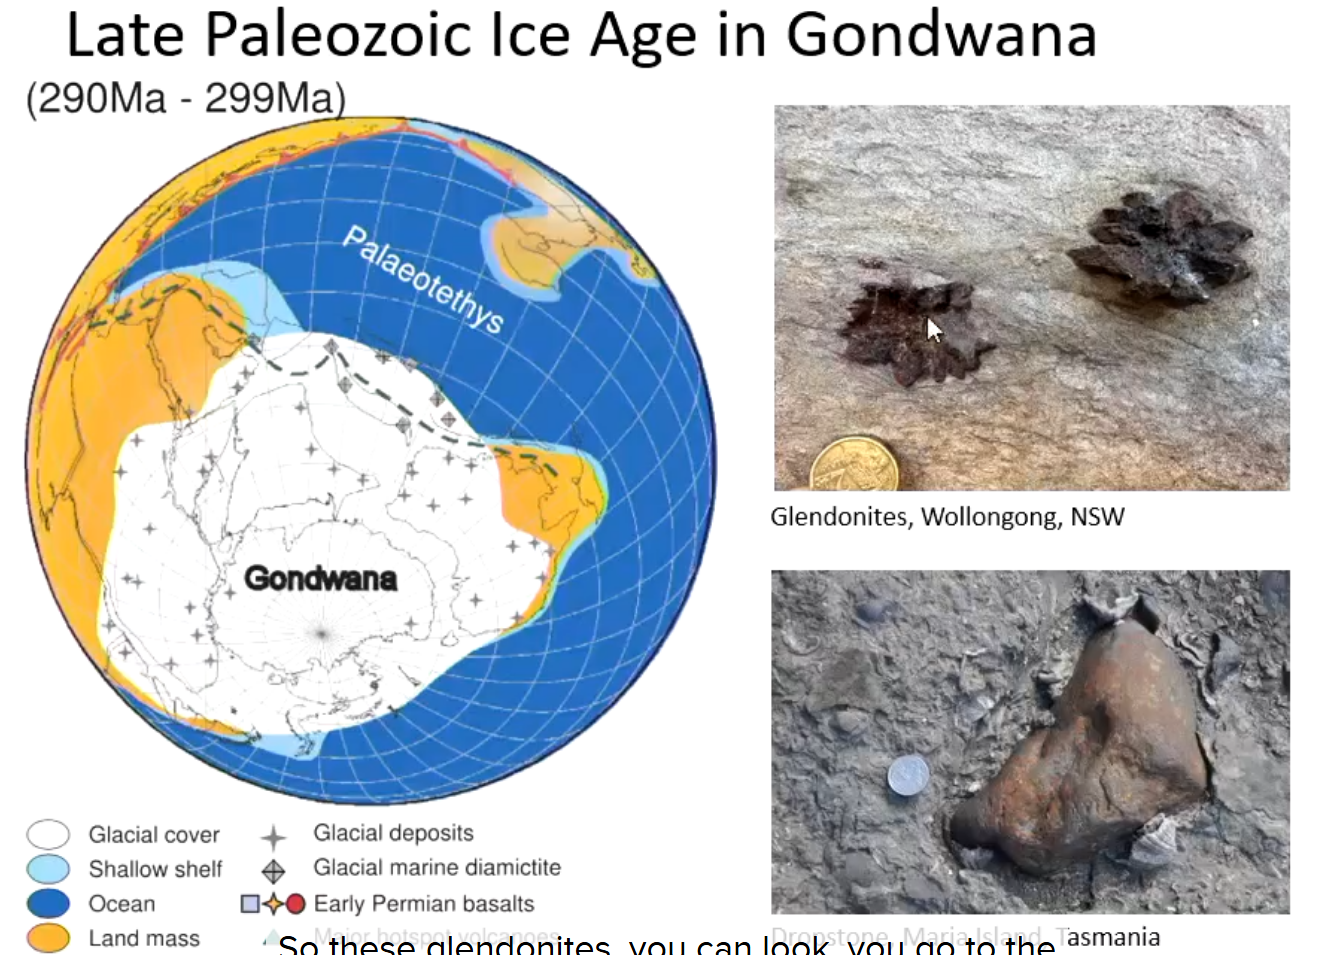
Gondwana in the early permian
Bivalves - large cold water
causes → Gondwana and Laurasia were sutured together. Different circulation
Expansion of plants - promote weathering and photosynthesis
Formation of swamp and riparian forest (Now coal forests)
Orbital change
Glossopteris fossil found in Austinmer - fern
Cretaceous Hot Greenhouse ~100 Ma
10 degrees warmer than present day
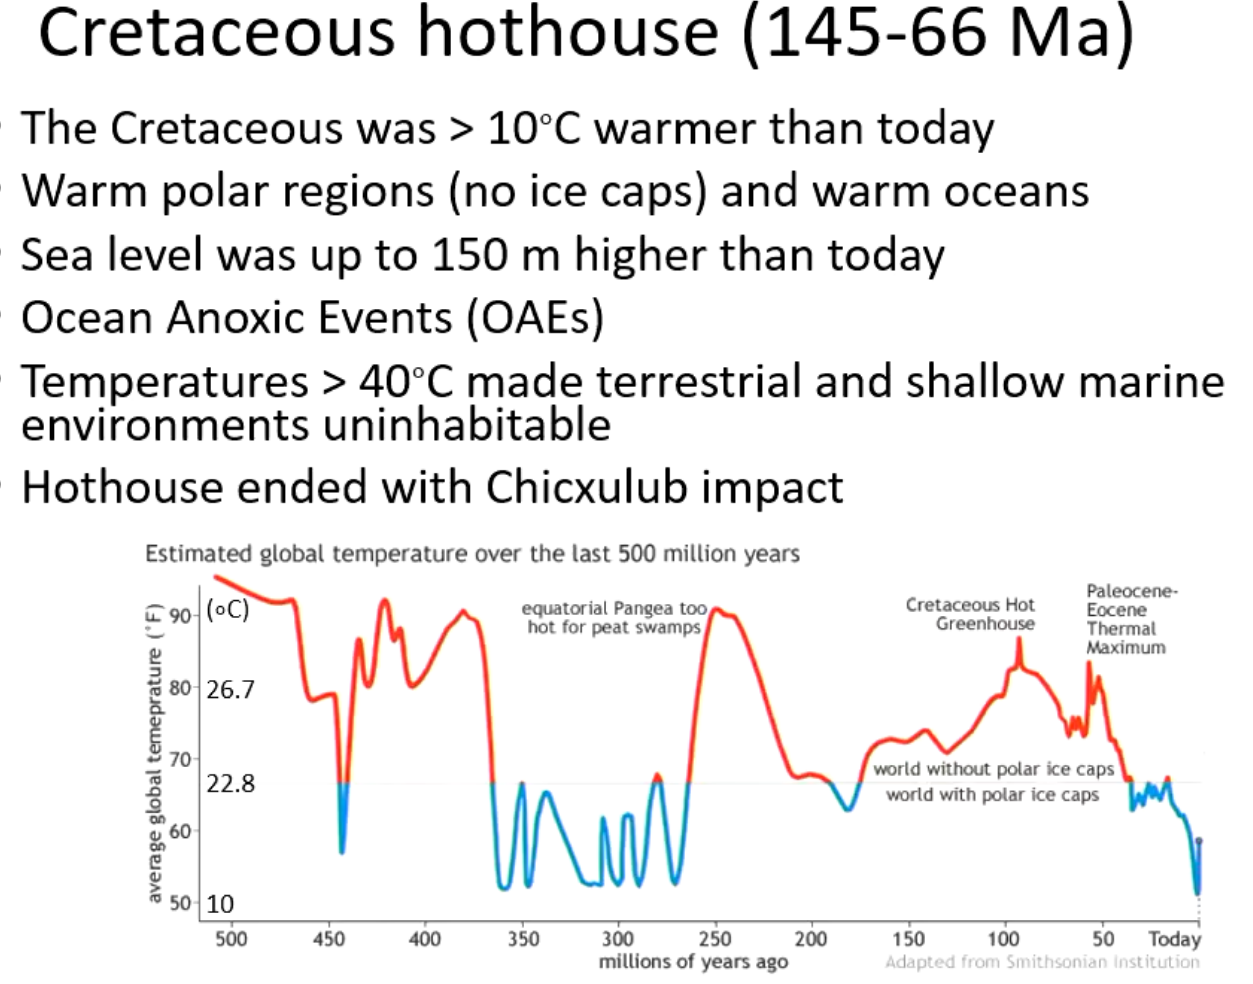
oceans not well mixed - ocean anoxic events
poorly ventilated - increased burial and preservation of organic matter
Paleocene-Eocene Thermal Maximum (PETM) and analogue for future global warming
delta O18 is good proxy for temperature
Delta C13 source of carbon responsible for the influx and the magnitude
every carbon source on earth has a different signature
Dissolution of carbonate ooze - ocean acidification
extinction of ~50% of benthic forams
Global warming of 5-8 degrees
permafrost oxidiation, wildfires, methane hydrates - decomposition of microbes
Chunk 2
Climate Forcing
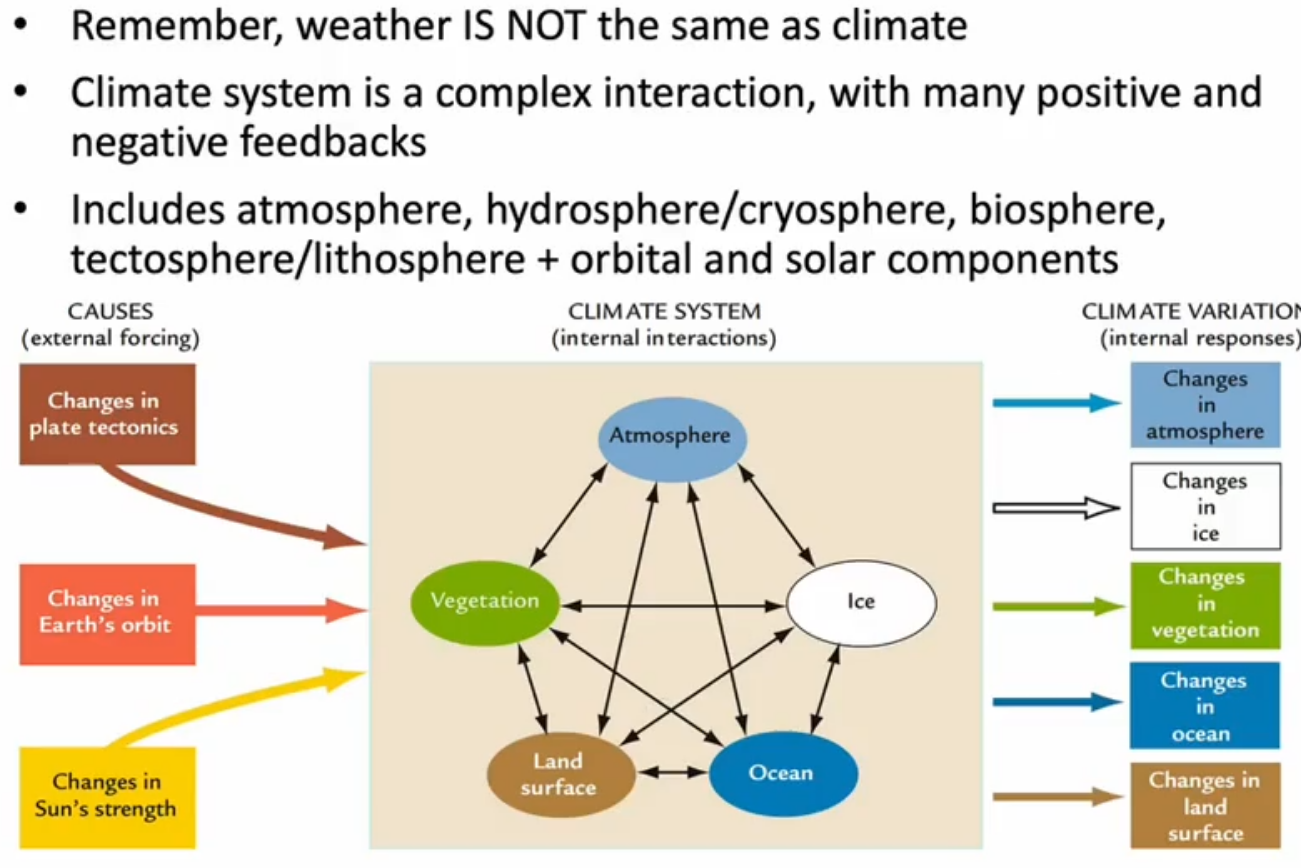
important: tectonic processes → mountain building → weathering
Changes in earth orbit → alter solar radiation, sunlight
Anthropogenic forcing → CO2 emissions
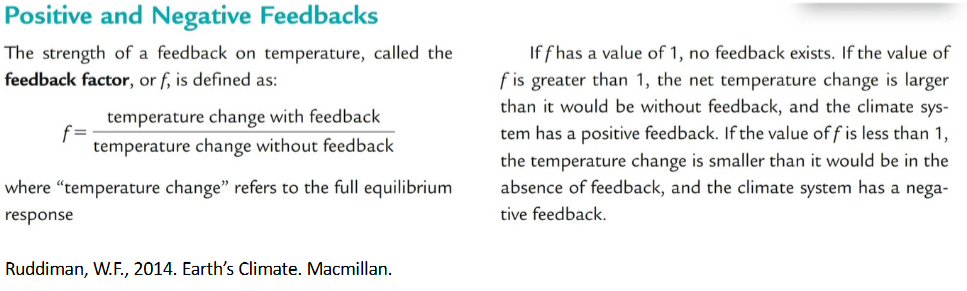
Postive feedback → ampifys climate change
Negative feedback → supresses climate change
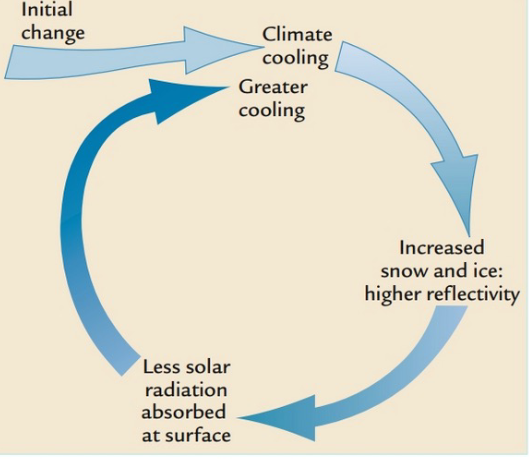
albedo effect → all adds to 1
When climate cools the oncrease extent of reflected snow and ice increase the albedo of Earths surface in hogh latiude regions
can go both ways
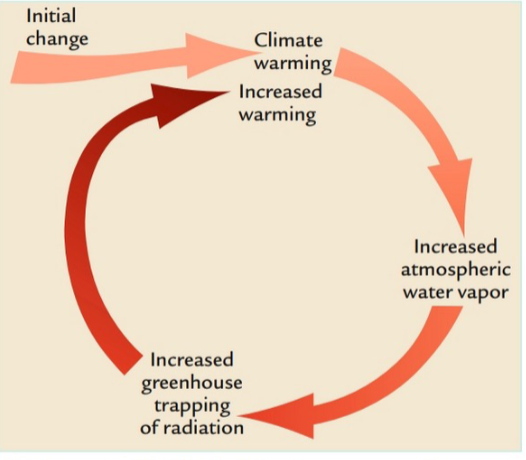
Water Vapour feedback
warm air hold more water than cold air
depend on temperature, strong feedback
Vegetation Climate feedback
3 types of vegetation in the arctic → spruce forest, and tundra
spruce forest - ice blown from tree, tree has low albedo. solar radiation absorbed.
Snow fall on tundra covers ground vegetation and creates a high albedo surface that reflects the solar radiation
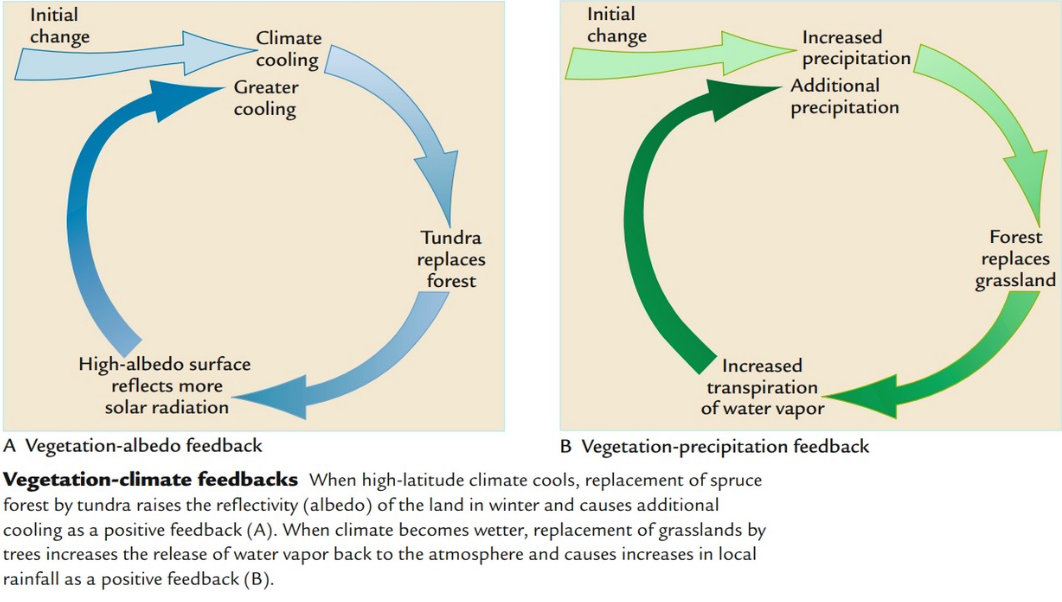
can also go back the other way in climate warming
when climate becomes wetter then trees replace grasslands and transpire more water vapour back to the atmosphere → increasing the available water for rainfall
Carbon Exchange Between Rocks and the Atmosphere
Slower carbon cycle evolves huge reservoirs measured in gigatonne.
carbon is locked in rocks and sediment
gradual climate change - slow carbon cycle → exchange between rocks, reservoirs and atmosphere. major driver → chemical weathering
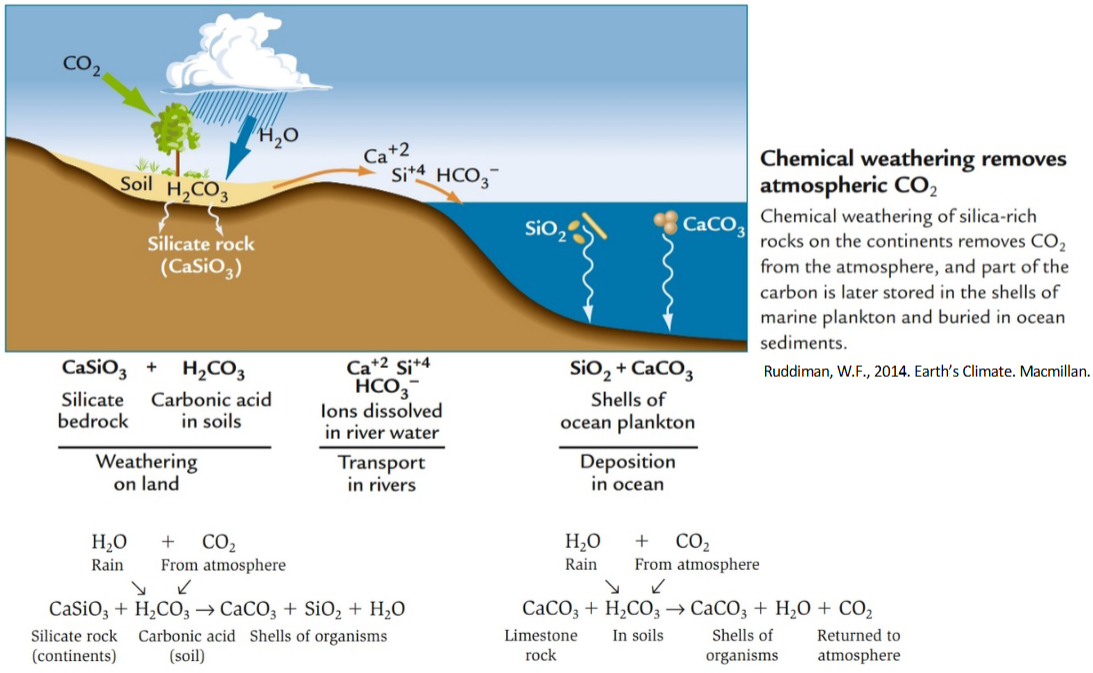
carbon dioxide removal
minerals, water (Rain) and CO2 (atmosphere)
Feldspar contains cations → Calcium
silicate minerals attacked by weak acid (Carbonic acid)
chemically converted to clay minerals
carried by rivers to the sea
used by plankton for shells, die and go to seafloor → limestone, lock away carbon
Dissolution of limestone occurs at much faster rates than the hydrolysis of silicates
Chemical weathering is negative feedback loop
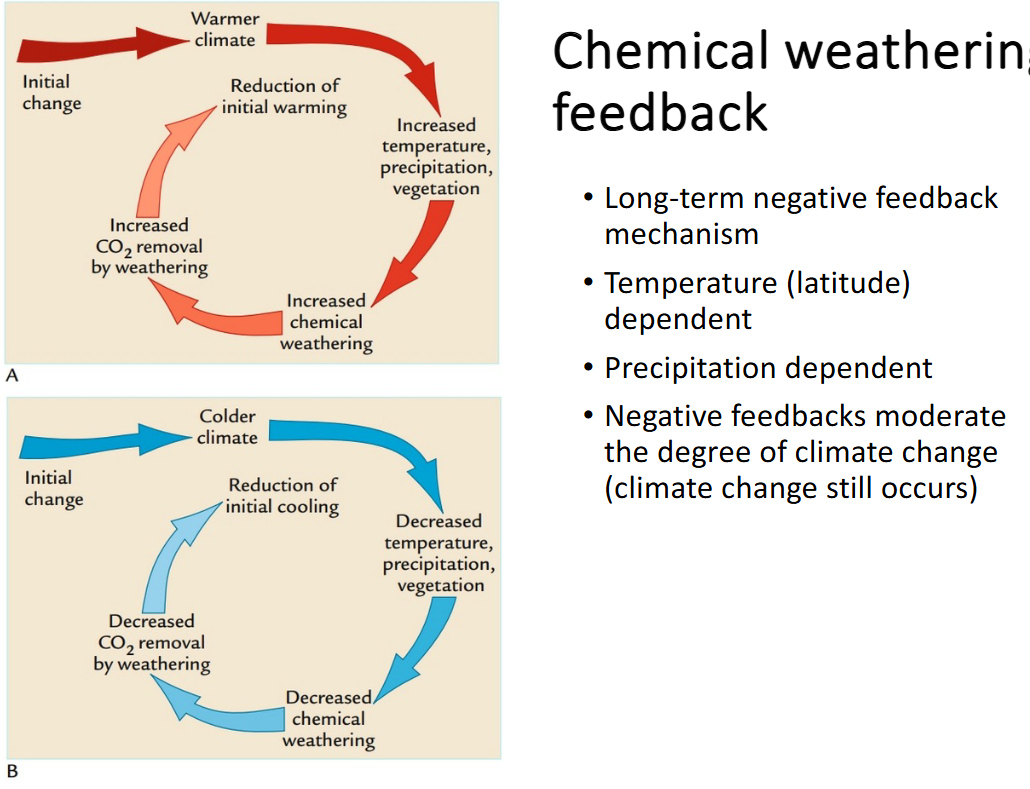
Mountain building + chemical weather = draw down of CO2 → Global Cooling
Fresh rock exposure → aerographic
Tibetan plateau makes its on monsoonal climate
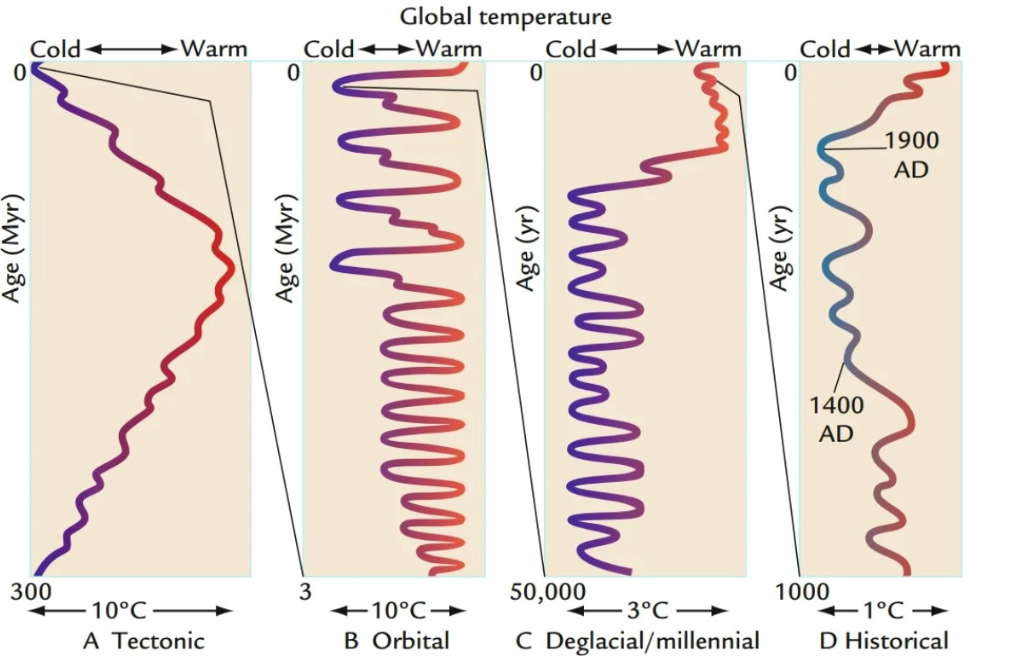
Causes of climate change
Atmospheric composition, Astronomical (solar variations , Orbital variation) , Earths surface (Plate Techtonics)
Climate cycles preserved in rocks → series of events repeated regularly and in order
Ocean drilling detected sediment cycles in the deep sea (Light and dark layers)
Cycles evident in glacial interglacial cycles
Isotope ratios VS Increasing ice volume
lower = interglacial
Quarternary → cycle
Orbital scale changes
seasons leave an imprint in the layer of snow → season can be extracted
temperature, trapped dust and atmospheric bubbles, water composition
Milankovitch Cycles
as earth orbits around the sun i
earths spin tilt and orbit changes
circular to elliptical → eccentricity (the shape of earth’s orbit)
The angle of earth’s axis is tilted with respect to earths orbital plane (obliquity)
Direction of earth’s axis of rotation is pointed (precession or wobble)
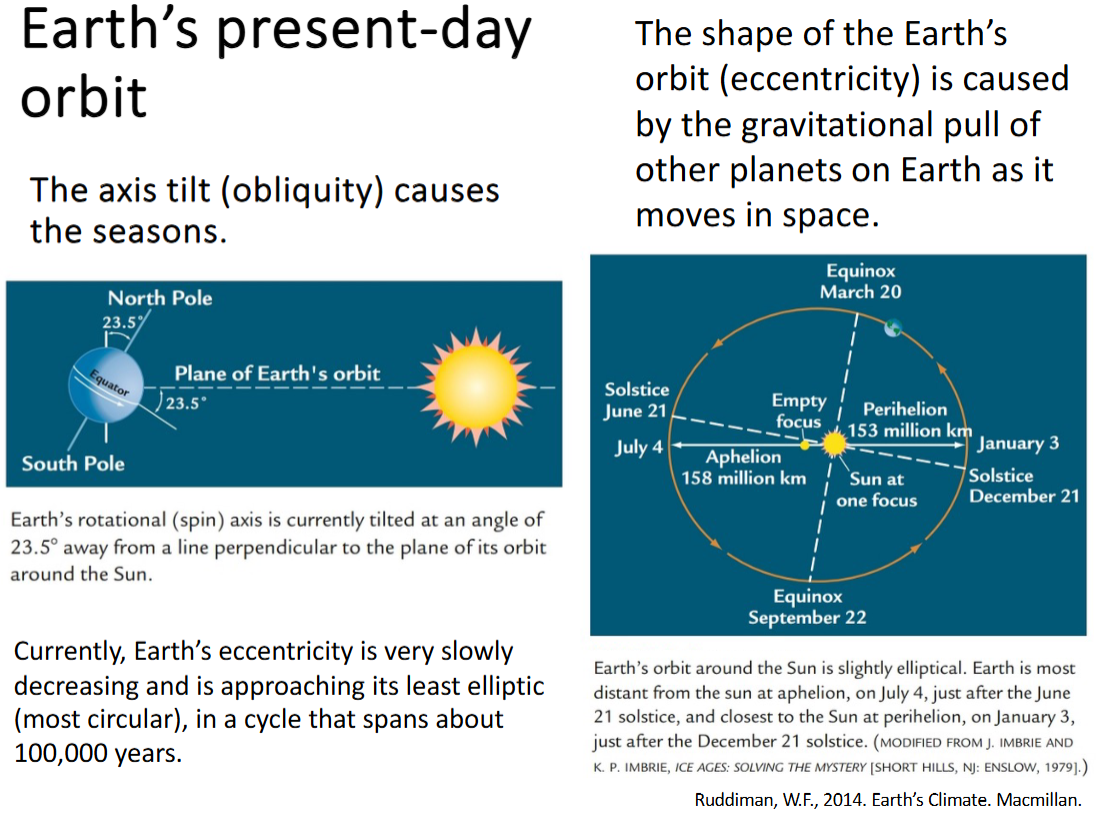
perihelion when orbit is closes to the sun
No Tilt perfect orbit around the sun, poles at 90 degrees. no seasonal change and all days same length
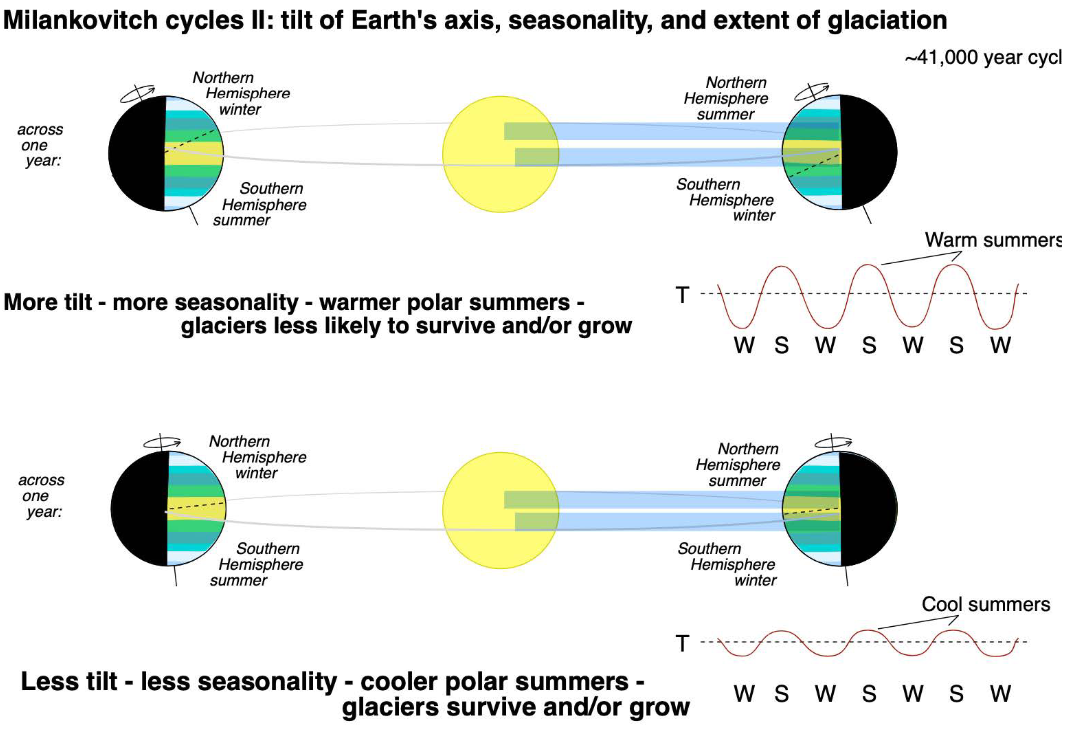
changes in earths axial tilt 22 degrees - 24 degrees
changes in angle decrease or increase seasonality
tilt increase = warm summer and decrease ice sheets
eccentricity - measures how much the shape of the earth’s orbit variates from a perfect circle
Less eccentricity orbit is more circular -. less seasonality, cooler polar summer, glaciers more
Earth wobbles (axial precession) when rotation → tidal forces, earth bulges at equator
makes seasonal more extreme in one hemisphere than the other → currently southern is hot
Apsidal precession - entire orbital ellipse wobbles → interaction with Jupiter and Saturn
Looking for Orbital scale changes in climate records
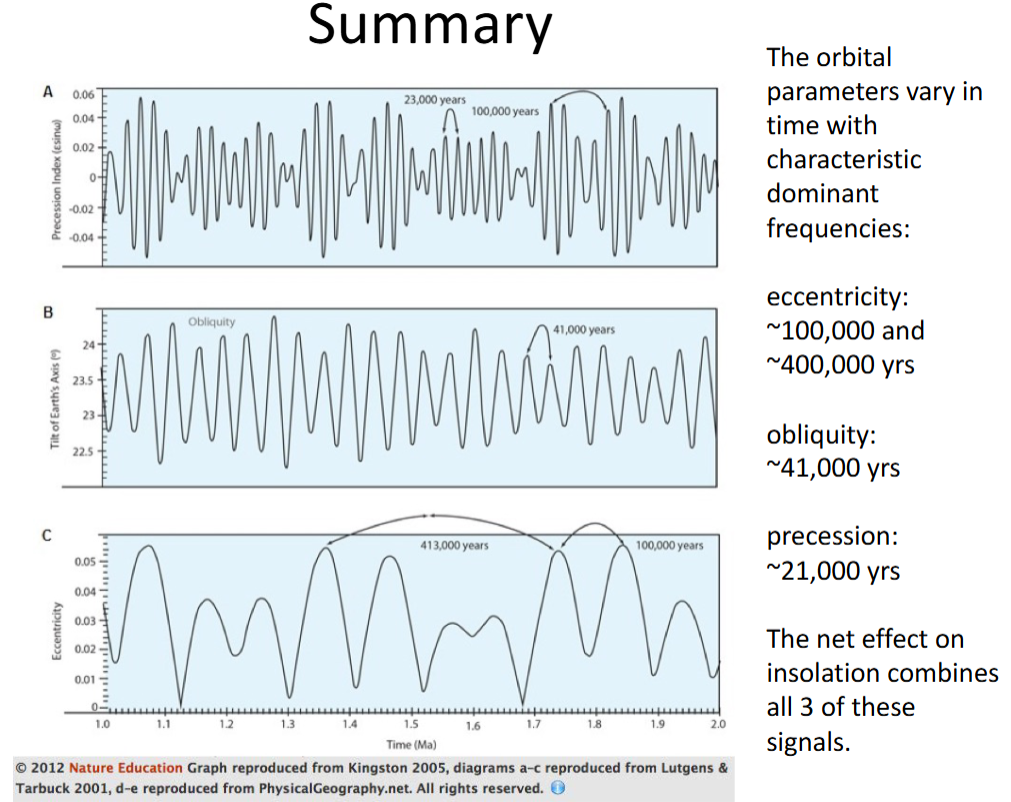
most climate records contain 2 or 3 superimposed orbital scale cycles
Constructive interference- hard to distinguish the cycles periods are close together
Cycles change in amplitude through time
time series analysis - records plotted against age. Rhythmic cycles
comvert climatic records to timeframe
O18 measurements plotted against age against age
Spectral analysis- sine waves across to find best fit
Power spectrum
1976 hays, imbrie and Shackleton demonstrated milankovicks equation could be found in climate sensitive data. - forams
The oxygen isotope ratio in seawater changes when continental inland ice expands, Ice preferentially stores like O16
Estimated summer sea surface temps based on
Lecture 2 - Climate cycles and Future Climate
Chunk 3
Why is sea level important
nearly 10% of global population lives within 5km of the coast
Australia 90% of our population lives within 100km of the coast
80% live within 50km of the coast
Climate change induced sea level rise direct threat
Consequences: extreme weather, flooding, land loss, salt water intrusion, climate migration
Some communities are more vulnerable, wealth gap will increase
Sea level consistently increasing
.31m 1.61 m by 2100
0.28m 1.95m by 2150
Depends on future greenhouse emissions
RCP -representative concentration pathways
Time evoluting greenhouse - radiative forcing
Areas most affected; Asia and India Bourne and Papua New Guinea
Kiribati nation was relocated - low lying
Fresh water supply was ruined and crops
Climate driven sea level rise will overwhelm Arabic oil ports
Eramunda sea - basin flooded
Netherlands is susceptible to sea level rise
Peat extraction - land reclamation
Timescale of sea level change
early Cretaceous- continents rifting apart → younge ocean basins
Oceanic was thermally elevated which boosted sea level 4m higher
4 degrees warmer = 4 meters higher
Long term sea level - geological time scale, driven by plate techtonics
Short term sea level rise - ice sheets
Global (eustatic) mean sea level - global average sea level - climate change
Relative sea level - local or regional sea level. Land may be sinking or rising
Sea is not level, earth is super lumpy and gravity is uneven around earth
Nearest ice will see least amount of sealevel rise
Regional climate cycle (la Nina ) change ocean circulation
Sea level around the globe is measured by tide gauges, satellites radar altimeters
Global sea level has grown 3.2 mm/yr thermal expansion
Queensland - reduction - coastal development
Eustatic sea level
Eustasy is global sea level - distance between the sea level and sea floor
Relative sea level - sea surface and local datum
Accumulated sediment relative to- eustasy
PIC : Determining ancient sea level