Geo Mocks
Population
1.1 Population Distributions
LICs/MICs/HICs | Nations with gross national income per capita (below $1,145)/($1,146 to $4,515 AND $4,516 to $14,005)/(above $14,005) |
Brandt Line/North-South Divide | Willy Brandt in 1980, visual divide between wealthier north and poorer south, outdated. |
Classification | Categorizing countries based on income, development, or other economic means |
Stratification | Hierarchical division into layers based on wealth/power/development. |
Emerging economies | Rapidly industrializing nations (China, India), transitioning from MIC to HIC status |
NICs | Newly industrialized countries, recently transitioned from agragarian to industrial |
BRICs | Brazil, Russia, India, China, South Africa. Major emerging economies |
CPE | Centrally planned economy, started controls production and distribution (USSR, N. Korea) |
MEDC/LEDC | More/Less economically developed country |
1st World/2nd World/3rd World | Cold war-era terms, 1=capitalist HICs, 2=communist, 3=poorer nations |
Physical/human factors pop. distribution | Physical = climate, water access, relief, soil fertility |
Core/Periphery | Core - powerful & wealthy (urban centers) |
GNI & GNI per capita | Gross national income (total income of residents + overseas earning) |
Factors determining rich/poor | Social - education, healthcare, inequality |
Population Case Study
China | USA | |
Population Distribution | Heihe-Tanchong Line: 94% east of line, 6% west of the line (1934 Hu Huanyong) | Population concentrated in east (New York) and west coast (Los Angeles) |
Population Density | 2000-4000 people per km² in urban centers (Shanghai 3900 people per km²) | 2000 people km² west California, Los Angeles, Washington |
Economic development | Beijing, Shanghai, Hong Kong, Taiwan most economically developed | New York, Chicago, Dallas, San Francisco most economically developed |
GDP per capita | GDP per capita around $22,000 Shanghai | GDP per capita around $97,000 New york |
Urbanisation | 65% are urban population 2023, up 36% from 2000 | 80% are urban population, east and west coast |
Suburbanisation | Satellite cities: growth in peripheries of megacities (Tianjin near Beijing) | Satellite cities (Irvine near Los Angeles) |
Core | Coastal China plus Beijing, Guangzhou, Shanghai, Chongqing | New York, Los Angeles, San Francisco, Washington (California, and east coast) |
Periphery | West and north, more rural, poorer access to trade and resources | Rest of the country, Nevada desert, Appalachians, etc. |
Megacities (over 10 million pop.) | Plan for over 19 megacities | NO MEGACITIES |
Rural to urban migration | Dongguang, zheijang, jiangsu most immigrated into | 2 million people a year move to cities (Texas, Florida, California) |
Urban to rural migration | Chinese new year + national day mass migration | Zoom towns (remote workers fleeing high living costs) |
Internally displaced people | floating population - 376 million (2020 consensus) | 1.2 million displaces by wildfires and hurricanes |
Remittances | Rural households rely on $150-300 a month from urban migrants | rural families rely on $200-500 a month from urban migrants |
Brain-drain | Migration of education elites, 1 million students abroad, 80% stay overseas | 1 million US students abroad, 40% stay overseas after graduation |
1.2 Structures
Crude birth rate | Annual live births per 1,000 population |
Crude death rate | Annual deaths per 1,000 population |
Natural increase | Births - Deaths ((CBR – CDR) / 10 = % growth rate) |
Total fertility rate | Average children per women in her lifetime |
Life expectancy | Average years a newborn is expected to live |
Replacement level | TRF needed to maintain population size |
Demography | Scientific study of human populations |
Demographic transition model | 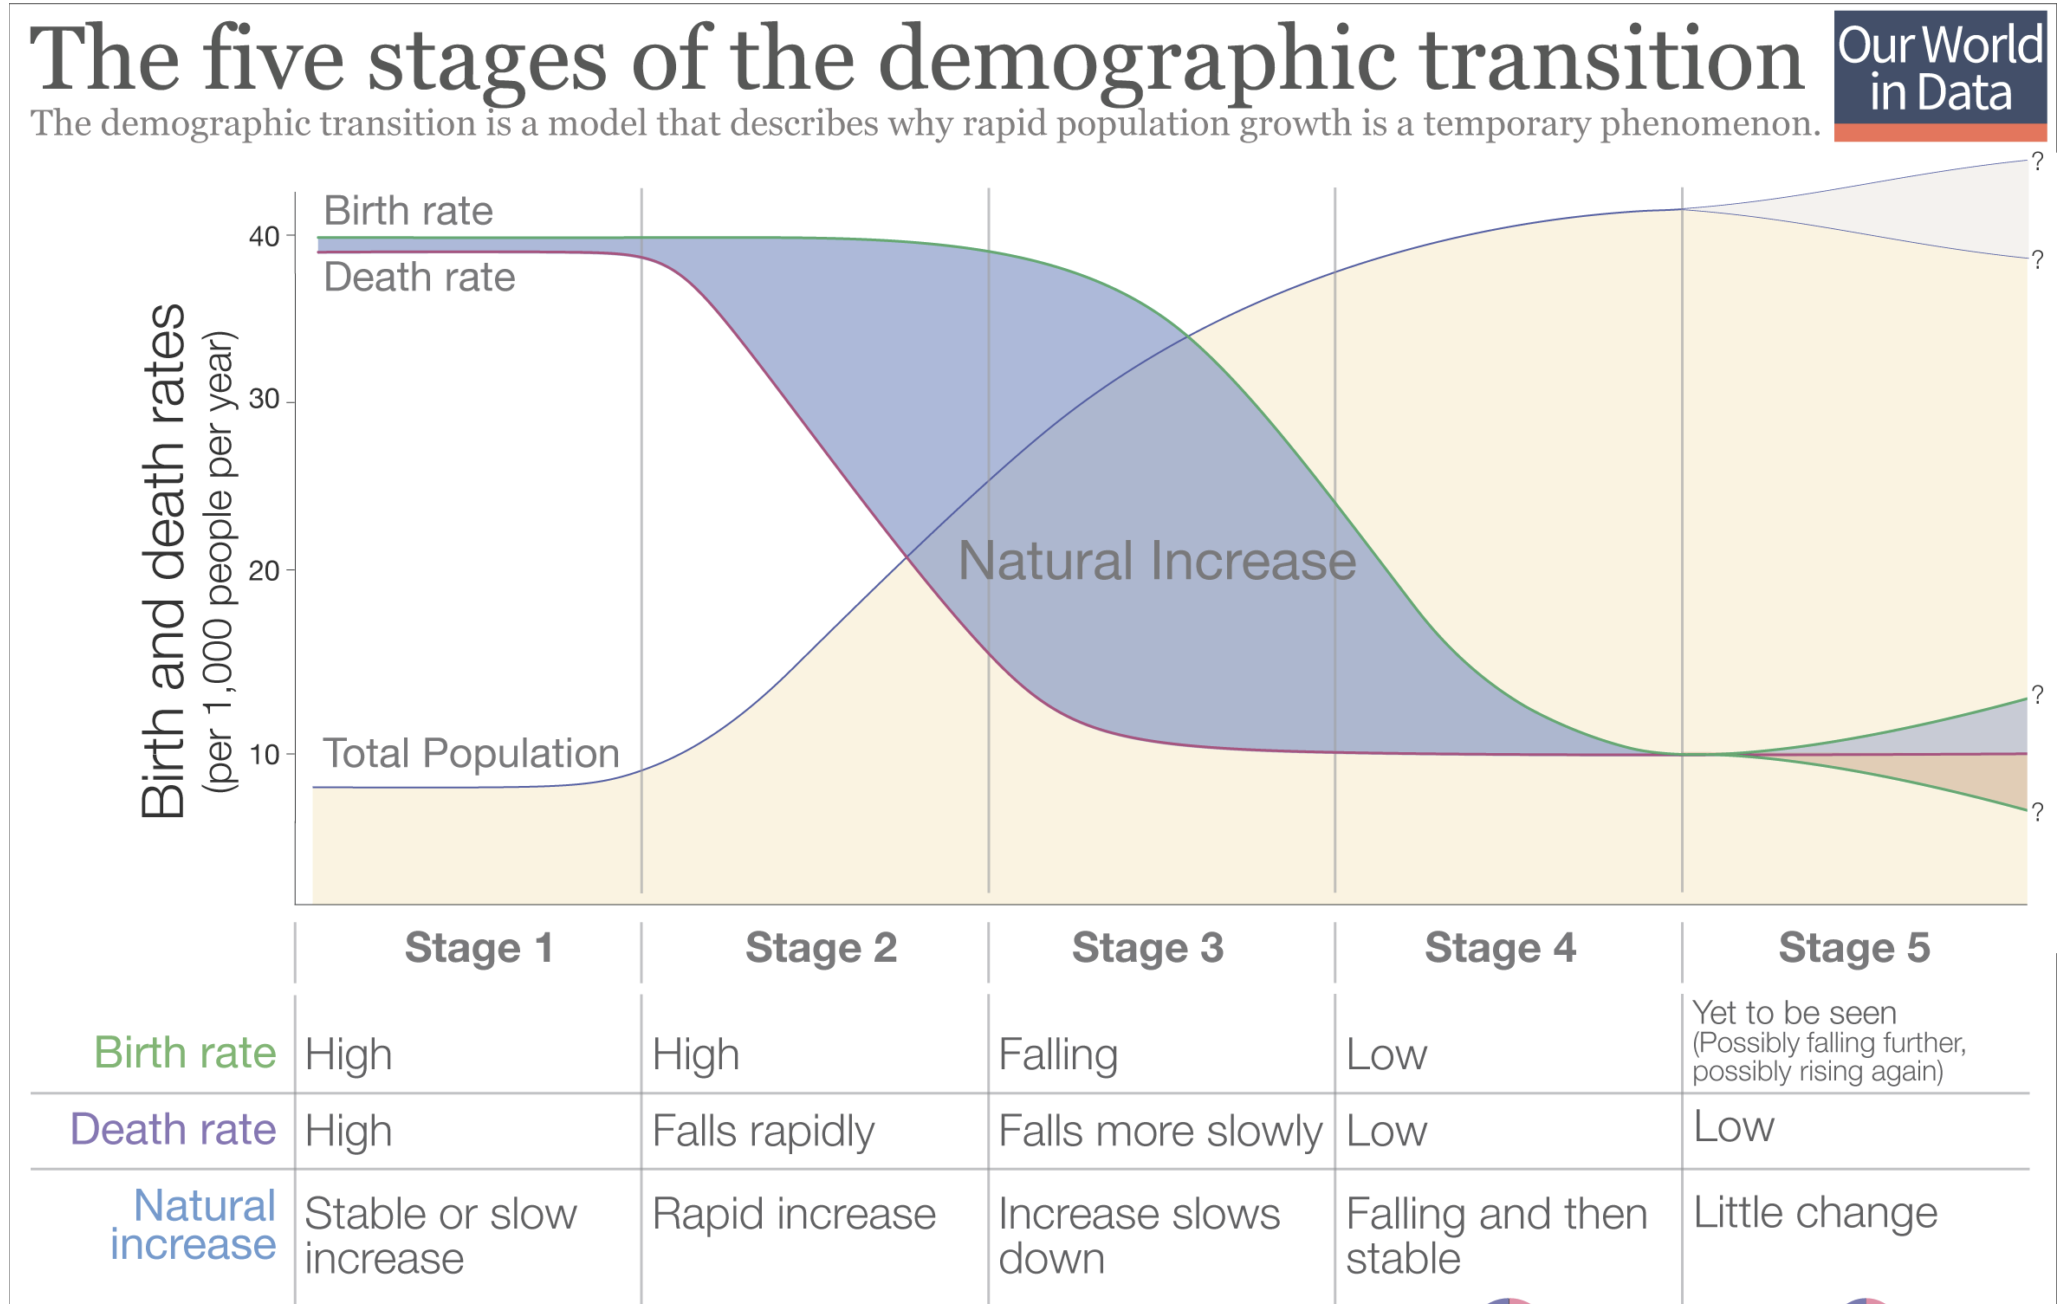 1-Indigenous, 2-sub-Saharan Africa, 3-India, 4-USA, 5-Japan |
Dependency ratios | (Young + Old dependents) / economically active x100 |
Population pyramids | Graphical representation of age/sex structure |
Old dependents | aged 65 and over |
Young dependents | aged 14 and under |
Economically active | working age population 15-64yo |
Causes of migration | Lee’s model (push and pull) |
Types and consequences of forced migration | Types: Refugees/Asylum seekers, IDPs (internally displaced due to disasters or conflict), trafficked people |
Emigration/immigration | E - leaving on country to move to another |
UNHCR | United Nations High Commissioner for Refugees, also known as the UN Refugee Agency. |
Case Study 3 countries’ demography
Niger | China | Japan | |
Fertility rates | 6.6 | 1.2 | 1.2 |
Life expectancy | 62 | 77 | 85 |
Population change | 3.8% | 0.3% | -0.5% |
Population pyramid structure | youth heavy | shrinking base | thin base |
Dependency Ratio | 100% (more youth) | 50% | 70% (more elderly) |
Impacts of youthful/ageing populations | Strain on job creation, high child mortality | Six pairs of pockets (2 parents, 4 grandparents), labor shortages | Pension system strain, rural depopulation, immigration reforms |
Forced Migration Case study
Ukraine (political) | Chad (environmental) | |
Causes | Russia invasion 2022-present, civilians bombed, forced deportations of 20,000+ children to Russia | Lake shrunk 90% since 1960s |
Consequences on people | Total 11.4m displaced | Total 5.3m displaced |
Consequences on places | Some ukrainian cities are 90% destroyed, $411 billion needed for reconstruction efforts | Fishing/agriculture collapse |
1.3 Power
Family Size | Members in a household, impacted by TFR, economics, and cultural norms |
Sex ratios | males to females in a population (105:100 at birth is typical) |
Ageing/Greying | Median population age increasing due to declining fertility and rising life expectancy |
Cohabitation | Living together without formal marriage, common in HICs |
Breadwinners | Primary income earnes, historically male dominated, but shifting in modern trends |
“Traditional” family | Nuclear family structure (2 parents, 2 children), declining in HICs due to diverse household types |
Gender imbalance | Skewed sex ratios due to cultural preferences or migration |
Sex selective technology | Prenatal screening to favour one sex, or abandoning children in early stages due to their gender |
Population pin code | Population division in Americas, Africa, Europe, and asia/australia = 1-1-1-4 or future 1-1-4-5 |
Anti-natalist policies | Policy reducing birth rates, through education on family planning and distribution of contraception, because they are overpopulated OR because it has a young population. |
Pro-natalist policies | Policy increasing TFR, through incentives such as cash rewards, extended maternity/paternity leave, subsidised childcare, education or healthcare, because they have an ageing population OR because they have a shortage of economically active people. |
Gender equality policies | international - UN goal 5 Gender Equality |
Anti trafficking policies | $236 billion worldwide industry, affecting 28 million people |
Demographic Dividend | family size down, lifespan up = human capital + economic growth |
Conditions required for DD | Declining fertility rates |
Case Study: China and Japan
China | Japan | |
Total population past, present, future | 1950: 0.55 b | 1950: 84m |
Ageing population factors | low birth rate: 1.2 | low birth rate: 1.3 |
Anti-natalist policies | One child policy prevented over 400m births | N/A |
Pro-natalist policies | Two/Three child policy (2016/2021), tax breaks, childcare subsidies | Angel Plan (1994), subsidized daycare |
China megacity growth
Shanghai | |
Social | 50+ universities and 40% China’s top hospitals |
Political | Tested China’s first free-trade zone (2013) |
Economical | $700B+ economy (4% china economy) |
Environmental | 23% green space, 100% electric buses |
Demographic | 300,000 foreign expats |
Climate
2.1 Causes of Global Climate Change
Short wave radiation | Solar radiation (UV & visible light) emitted by sun |
Long wave radiation | Infrared radiation emitted by Earth |
Albedo | Reflectivity of surface (snow 90%, oceans 6%) |
Greenhouse effect | GHGs (CO2, CH4, H2O) trap longwave radiation, warming the Earth |
Enhanced greenhouse effect | human-induced increase in GHGs amplifying heat retention, responsible for 1.1C warming since 1850 |
Open/closed/isolated system | Exchange (or not) from a system to outside factors |
Atmosphere processes | (inputs, processes/transfers/stores, outputs) |
Atmosphere layers | TSMTE (troposphere, stratosphere, mesosphere, thermosphere, exosphere) |
Global energy balance | Equillibrium between incoming solar radiation and outgoing terrestrial radiation (currently unbalanced) |
Positive/Negative feedback loop, | Positive - amplifies change (arctic ice melt) |
‘hothouse’ state | Climate scenario where positive feedback loops push Earth into irreversible warming |
emissions | largest emitter - China (total), Qatar (per capita) |
International variations in GHGs sources and emissions, | trend where emissions per capita increase with GDP per capita |
Carbon sinks | Natural (forests, oceans, peats)/artificial systems absorbing CO2. Oceans take 30% human emissions |
Paris agreement | 2015 treaty limit warming to less than 2C, 195 signatoris, requires updates every 5 years |
Milankovitch cycles | Changes in orbital variations: eccentricity (100k years), tilt (41k years), precession/spinning of tilt/axial precession (26k years) |
External Forcings | Factors altering earth’s energy balance |
Global dimming due to volcanic eruptions | Cooling effect from aerosols (volcanic SO2) reflecting sunlight, decreases 0.5C warming |
Methane (CH4) gas release | Earth's atmospheric methane concentration increased 150% since 1750 |
Methane sources | Methane sources inlude wetlands, human/livestok, oceans, fossil fuels, landfill/waste, biomass burning |
Why methane levels are increasing | Increase fossil fuel production, changing diet (more meat and rice), more waste due to higher population, methane emissions from fresh water, permafrost exposure |
2.2 Consequences of global climate change
Biosphere | System including living organisms (plants and animals) |
Climate change impacting biosphere | 50% of species face extinction by 2100 |
Hydrosphere | liquid, vapour, or ice, including: ocean, inland water bodies, and groundwater |
Hydropshere changes | Sea levels rising due to water from melting glaciers and ice sheets, thermal expansion of seawater as it warms |
Change in ice | Arctic ice sheet shrinking 13% per decade |
Change in oceans | Ocean is 30% more acidic than 1750 |
Atmosphere | Thin layer mixture of gases and particles suspended in the air around the earth (N2, O2, Ar, CO2, and H2O) |
Lithosphere | Earth’s outer layer (crust, mantle), affected by permafrost thawing (releasing CO2 and CH4) |
Cryosphere | Subset of Hydrosphere consisting of frozen water |
Geosphere | Solid Earth: core, mantle, crust, and soil layers |
Carbon Cycle | where its present, name given to store, or transfer between stores, what is abbreviation pg, list 5 natural carbon fluxes |
Carbon Cycle changes | Stores/sinks: atmosphere, biosphere (plants0, fossil fuels |
Extreme weather events | heatwaves, storms and flooding, fires |
Heatwaves | 5x more likely since 1900 |
Storms | hurricanes 8% more intense per 1C warming |
Flooding | Pakistan flooding 2022, $30 billion damage, 1,700 deaths |
Wildfires | Australia 2019/2020 46 million acres burned, over $100 billion in losses |
Droughts | 20 million people at risk of drought horn of Africa |
Impact of rising temperatures | 1C; 70% reefs die |
Deciduous | deciduous forests (shedding annually) growing seasons lengthened by 2 weeks |
Tundra | Shrinking 20% since 1980 |
Shift in Sahara | Sahara expanding 10% southward |
Shift in tropics | Amazon - 17% deforested = savannization risk |
Animal migration pattern changes | Birds migrate less south, livestock dies due to drought/heat, more often, etc. |
Link between Climate change and Cacao | Where does Cacao grow? What conditions are needed for Cacao to grow? What specific changes in climatic conditions will impact cacao cultivation? What impact will climate changes have on the location of cacao cultivation? Take a screenshot of the maps showing the limits of cacao cultivation How can cacao farmers adapt to climate change? |
Impact of climate change on human health | air pollution: 7 million deaths a year |
2.3 Responding to Global Climate change
Risk | potential for consequences where something of value is at stake and where the outcome is undetermined |
Vulnerability | The chance of being affected. |
Impact of climate change | Swiss Alps: loss in business, shorter skiing seasons |
Gender based impact | Higher mortality rate for women (due to cultural norms and their child-rearing responsibilities) |
COP | history of climate negotiations |
UNFCC | |
Mitigating | reducing climate change |
Adaptation | adapting to a life in a changing climate |
Carbon capture | Technology that captures CO₂ emissions at their source (e.g., power plants) before they enter the atmosphere. |
Carbon offsetting | Compensating for emissions by funding projects that reduce CO₂ elsewhere. |
Sequestration | Long-term storage of CO₂ in natural or artificial "sinks." |
Afforestation | Planting trees in areas not previously forested to create new carbon sinks. |
Geoengineering | Large-scale interventions to alter Earth’s climate systems. (Example spraying aerosols to reflect sunlight) |
fossil fuel alternatives | Energy sources replacing coal, oil, and gas to cut emissions (Solar, Nuclear, Wind, Hydro, etc.) |
Case study - climate action in China
government action | 2025 Target: 33% non-fossil energy in primary consumption (up from 15.9% in 2020). |
corporate strategies net zero | BYD - largest EV manufacturer, surpassing tesla with 3 million EVs sold annually. |
civil society responses | mossy earth |
Sports, Leisure, and Tourism