BIO152
Topic 1
Objectives
Describe and discuss cell theory
Identify and analyse limiting factors that determine the maximum and minimum size of cells
Compare and contrast features that distinguish prokaryotes from eukaryotes
Name contents, including major organelles found in eukaryotic cell, describe structure + function
Distinguish plant cells from animal cells based on cellular features
Introduction to Cells + Cell Theory
Cells = basic units of life
Organisms = either single-celled or multicellular
Cell Theory - History
Robert Hooke
(1665) Built a microscope: enlarged objects 30x
Came up with the name ‘cells’ (Latin ‘cellula’ (meaning little room))
Antoni van Leeuwenhoek
Produced small lenses: enlarged objects 300x
Observed living cells: in pond water and material scraped from teeth)
Various scientists (1830s)
Robert BrownL rounded structure (in plant cells) named nucleus (Latin for kernel)
Matthias Schleiden: plant tissues composed of cells
Theodor Schwann: animal tissues composed of cells
Cell Theory
Explains relationship between life and properties of cell
All organisms consist of one/more cells
The cell = basic unit of all organisms
All cells = from pre-existing, living cells
Functions
Duplicate DNA
Use DNA and RNA to make proteins
Handle energy transfer
Regilate exchange of materials
Cells of the World
Cells exist in different shape and sizes
Ge thierarcnerally small
Most bacteria and archaea: 1-5nm
Most higher plants and animals: 10-100nm
Unit of Measurement
1m = 1,000,000nm
One um is one million times smaller than one metre

Cell Size
Cells are limited in size - despite various shapes
Size restricted by:
Diffusion rates of molecules
Molecules move faster in smaller cells
Maintaining concentrations of substances in cell
Higher concentration → increase collision rate → more reactions happening
Surface area/volume ratio
Higher SA/V ratio = more efficient exchange of materials
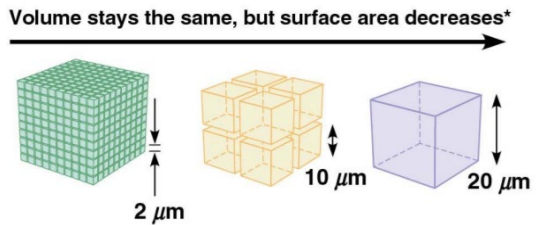

Calculating Total Surface Area
Formula for surface area: 6s²
Assuming cell is cube-shaped
s = length of the side
If s = 2nm → 6 x (2)² = 24nm²
If there are 1000 cells, TSA = 24nm² x 1000 cells = 24,000nm²

Organisms and Cells
Organisms can remain unicellular (prokaryotes) or multicellular (eukaryotes)
Bacteria and achaea: unicellular - cells small and efficient
Plants and animals: large, multicellular and complex in general - cells remain small and efficient.
Prokaryotes vs Eukaryotes
Prokaryotes
Greek; Pro = before, Karyon = nucleus
Genetic information not contained in nucleus, but contained in nucleoid (concentrated region)
Lacks membrane-bound organelles
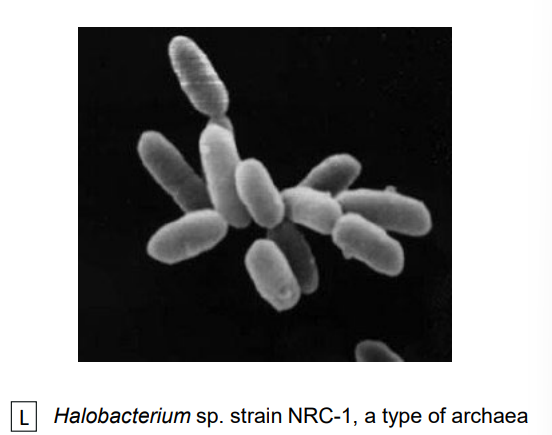
E.g. Bacteria, archaea
Eukaryotes
Greek; Eu = true, Karyon = nucleus
Genetic information contained in nucleus
Has membrane-bound organelles
E.g. Plants, animals, yeast
*Nucleoid ≠ nucleus

Bacteria, Archaea (Prokaryotes)
Bacteria
Genetic material folded and packed tightly in nucleoid.
Escherichia coli (E.coli) has genetic material (1,300nm) inside its cell (1-2nm)
Divided by binary fission

Archaea
Many species live in extreme environments, e.g. acidic hot springs (pH 2, temperature >100 deg C
Divided by binary fission
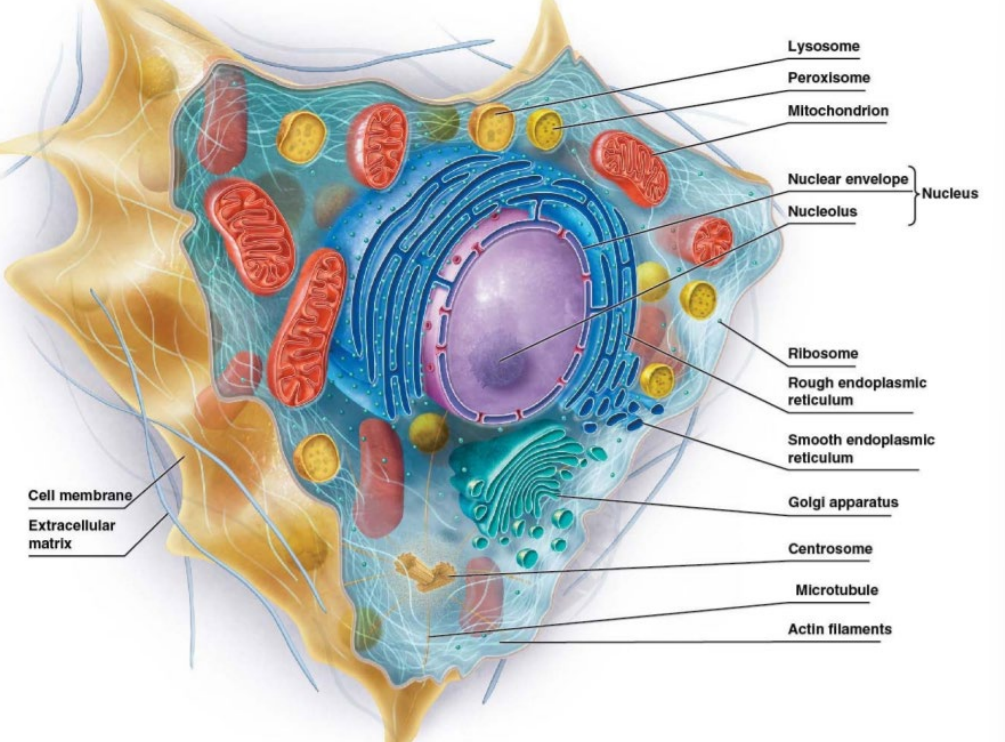
Animal Cells, Plant Cells (Eukaryotes)
Animal Cells
Membrane-bound organelles require membrane fusion events to exchange materials.
Divided by mitosis/meiosis + cytokinesis
Plant Cells
Have walls containing cellulose and large vacuoles
Divided by mitosis/meiosis + cytokinesis

Cell Ultrastructure
Cell (Plasma) Membrane
Structure
Lipid bilayer
Phospholipids have polar heads, twin non-polar tails
8-10nm thickness
Function
Defines boundary of cell/internal compartments, e.g. mitochondria
Site for biochemical functions, e.g. electron transport in mitochondria
Transport solutes in/out of cell (selective permeability)
Detect + transmit electrical and chemical signals
Provide mechanisms for cell-to-cell contact, adhesion, communication
Cytosol + Cytoplasm
Cytosol
Semi-fluid
Site of chemical reactions, e.g. glycolysis
Cytoplasm
Majority of internal volume of cell
Comprises cytosol, organelles, cytoskeletal fibres
Ribosomes
Not membrane-bound
Made of RNAs and proteins
Consists of two subunits
Large SU
Small SU
Free (individual) or grouped (as part of rough ER)
Function = protein synthesis

Animal Cell vs Plant Cell (Eukaryote)
Animal Eukaryotes | Plant Eukaryotes | |
Cell wall | NONE |
|
Nucleus |
| SAME |
Chloroplast | NONE |
|
Cytoskeleton |
| SAME |
Mitochondria |
| SAME |
Endoplasmic reticulum (ER) |
Smooth ER
Rough ER
| SAME |
Golgi complex |
| SAME |
Lysosome |
| **researched
|
Peroxisome |
| Specialised peroxisomes: Glyoxysomes:
|
Centrosome |
| NONE |
Vacuole |
|
|
Cilium |
| NONE |
Topic 2
Objectives
Know basic structure of amino acid + classify different amino acids according to R groups
Describe linkage of amino acids with different bonds + classification of proteins according to structure (primary, secondary, tertiary, quaternary structures)
Describe structure of cell membrane and major components
Describe types of lipids, carbohydrates, proteins in membranes
Analyse how membrane composition affects cell function with regards to cell and signal recognition, energy generation and transport processes
Proteins 1
Hierarchy of Structures
Biological molecules/structures classified into various levels:
Level 1 - soluble organic molecules
Level 2 - biological macromolecules
Level 3 - Supramolecular structures
Level 4 - organelles
Level 5 - cell

Amino acids
Building blocks of protein
Made of
α carbon
Hydrogen atom
Carboxyl group (carboxylic acid): (-COO^-)
Amino group (Amine): -NH3^+
R group
Exist in two stereoisomeric forms:
Mirror-image forms called L- and D-amino acids
Only L-aa found in proteins
20 Different kinds
Properties depend on R groups = classification
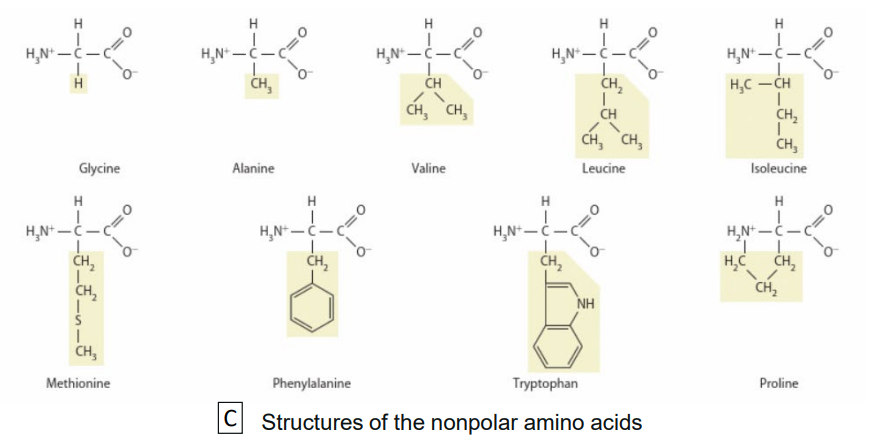
R Groups
Type of R group determines different characteristics (or combination) for amino acid
Nonpolar (hydrophobic): R group mostly contain hydrocarbon group e.g., CH3. May also have N or S atoms but effect of these atoms are diminished due to hydrocarbon portion.
Polar (hydrophillic): R group contain either hydroxyl group (OH), sulfhydryl group (SH) or amide group (CONH2).
Neutral R group has no charge, may contain highliy electronegative atom, e.g. O, N or S.
Negatively charged: R groups contain negatively charged group (e.g. -COO^-)
Positively charged: R groups contain positively charged group (e.g. -NH3^+)


Proteins
Important macromolecules in all organisms/cells
Greek: proteios = first place
Made of amino acids linked together by peptide bonds
Each protein has unique amino acid sequence
2 a.a. = dimer, 3 a.a. = trimer, 4 a.a. = tetramer
Structure important for functionality
Amino group = start (N-terminus)
Carboxyl group = end (C-terminus)


Peptide Bonds
Linkage of two amino acids via covalent bonding
Condensation reaction
Water removed
O from carboxyl group
2 H from amino group

Hydrogen Bonds
Donors (e.g. Amine/Hydroxyl group of a.a.) have H atom linked to more electronegative atom of acceptor (e.g. Carbonyl, sulfhydrall groups of a.a.)
Weak bond
Abundant in proteins

Disulfide Bonds
Form between sulfur atoms of two cystein amino acid residue via covalent bonding
Via oxidation: removal of H atoms
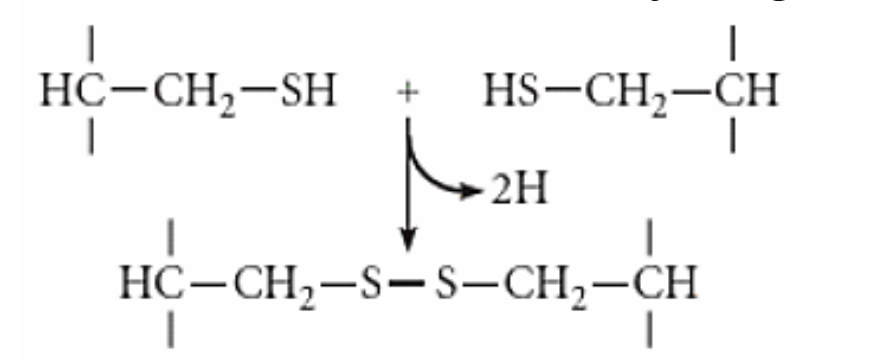
Disruption of disulfide bonds denatures proteins
Via reduction: addition of 2 H atoms to regen sulfide groups (SH)

Ionic Bonds
Opposites attract
R groups can be + or - charged
Electrostatic interactions between R groups
+ bind to - (attract)
Similar charge (repel)
Too high/low pH value affects ionic bonds
Results in proteins denaturing

Van Der Waals Interactions
Transient attraction of two nonpolar molecules
Typically weak, energy of 0.1-0.2 kcal/mol
Only effective if molecules are close
Hydrophobic Interactions
Tendency of hydrophobic molecules excluded from water interaction
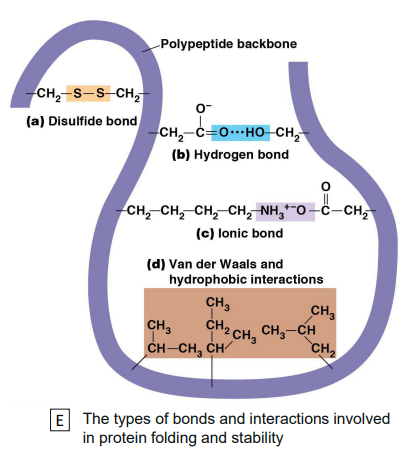
Primary Structure
Linear sequence of amino acid in polypeptide
Amino acid linked by peptide bonds
Sequence determines higher orders of structures


Secondary Structure
Backbone of polypeptide
Linear sequence fold upon itself
Structure stabilised by H bonds
Intermolecular (between CO and NH groups of amino acids of two different polypeptides)
Intramolecular (between CO and NH groups of amino acids of same polypeptide)
Structural patterns:
a-helix
b-sheet
Alpha Helix
Spiral in shape; coils around itself
Stabilised by H bonds
CO group bind to NH group of peptide bond, 4 a.a. downstream
Spiral turn has 3.6 a.a.
4th a.a. close to 3rd and 5th a.a.
Makes structure stretchable
Some a.a. disrupt alpha helix (helix breaker)
Proline (lacks H needed for H bonding)

Beta sheet
Sheet-like conformation
Forms when two parts of polypeptide chain lie side by side
Stabilised by hydrogen bonds

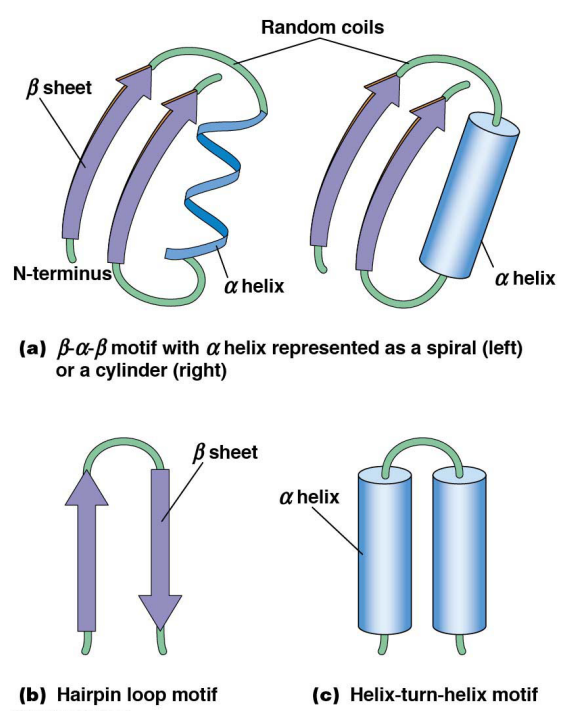
Motifs
Combinations of alpha helices and beta sheets
Connected via looped regions of varying length (random coils)
E.g. β-α-β, hairpin loop and helixturn-helix motifs
Primary | Secondary | Tertiary | Quaternary |
|
|
|
|
Tertiary Structure
Higher order of folding
Polypeptide chain folded back on itself → condensed structure
Depends on interaction between side chains
Stabilised by
Disulfide bonds, H bonds, ionic bonds, van der Waals interaction and hydrophobic interaction
Two main classes
Fibrous proteins vs Globular proteins

Fibrous | Globular |
Extended, filamentous | Compact |
Repetitive amino acid sequence | Different amino acid sequence |
Structural | Functional |
Only small fraction present in cell | Most proteins in cell |
Fibroin proteins of silk, keratins of hair, collagens, elastin | Enzymes, haemoglobin, antibodies . |
Proteins 2
Objectives
Describe classification of proteins according to function
Describe how pH affects charge of proteins
Describe how proteins can be separated based on given examples
Describe denaturation effects on protein structure
Proteins - Summary + Categories
Proteins made up of amino acids: Carboxyl, amino and R groups
Properties dependent on the R group
Four levels: Primary, secondary, tertiary and quaternary structure
Properties of a protein determined by
Types of amino acid
Number of amino acids
Amino acid sequence
Protein properties are important for its role and purpose
Can be categorised into:
Category | Function | Example |
Enzymatic | Selective acceleration of chemical reactions | Digestive enzymes catalyse hydrolysis of bonds in food molecules 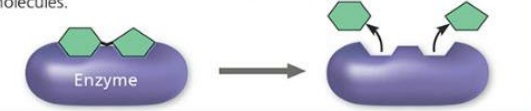 |
Defensive | Protection against disease | Antibodies inactivate and help destroy viruses and bacteria  |
Storage | Storage of amino acids | Casein, protein of milk, is major source of amino acids for baby mammals. Plants have storage proteins in seeds. Ovalbumin is protein of egg white, used as amino acid source for developing embryo.  |
Transport | Transport substances | Haemoglobin, iron-containing protein of vertebrate blood, transports oxygen from lungs to other parts of body. Other proteins transport molecules across membranes.  |
Hormonal | Coordination of an organism’s activities | Insulin, a hormone secreted by pancreas, causes other tissues to take up glucose, thus regulating blood sugar concentration.  |
Receptor | Response of cell to chemical stimuli | Receptors built into membrane of nerve cell detect signalling molecules released by other nerve cells.  |
Contractile and motor | Movement | Motor proteins are responsible for undulations of cilia and flagella. Actin and myosin proteins are responsible for contraction of muscles.  |
Structural | Support | Keratin is protein of hair, horns, feathers, etc. Insects and spiders use silk fibres to make cocoons and webs. Collagen and elastin proteins provide fibrous framework in animal connective tissues.  |
pH on Proteins
pH changes protonation state of charged residues
Acid | Neutral | Alkaline/Basic |
Low pH | Uncharged | High pH |
Increase H+ | Decrease H+ | |
Nett +ve charge | Isoelectric or pl (~has net electric charge of 0) | Nett -ve charge |
 |  |  |
Isoelectric Point (pl)
pH at which proteins are at 0 nett charge
Positive and negative charges balanced
Also dependent on R groups
Affects solubility
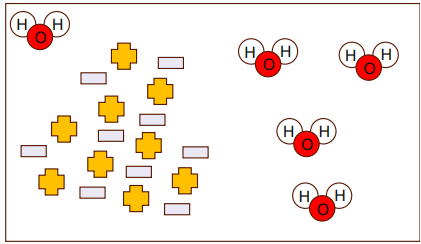
Proteins interact with each other rather than water
Might precipitate (fall out of solution = insoluble)
At pH away from pl, protein carries a charge (+)
Because water is polar → forms a hydration shell around charged regions of protein.
This water-protein interaction increases protein’s solubiliity in solution.
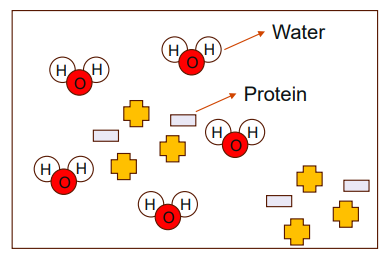
At pl point, there is no overall nett charge in protein
Hence, less attraction between protein and water, and proteins more likely to interact with each other = protein precipitating out of solution.
Separation of Proteins
Properties depend on R groups of amino acids
Nett charge of proteins
Size
Solubility - pl
Methods used in cell biology:
Charge | Size | Solubility |
Electrophoresis | Gel filtration | pl precipitation |
Ion exchange chromatography | Ammonium sulfate precipitation |
Charge: Electrophoresis
Separates mixture of proteins in gel matrix with voltage
Cathode (-) and anode (+) ends of gell
Opposite charges attract
Protein mix will separate based on
Charge
Rate proportional to size of charge
Chromatography
Separation of molecules suspended in a phase
Due to molecules having different properties (e.g. charges, affinity to certain molecules, polarity)
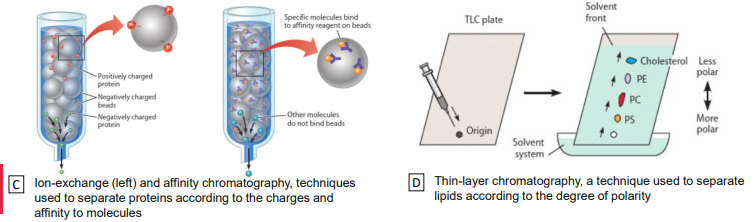
Charge: Ion Exchange Chromatography
Beads trap/slows dwn flowing proteins of opposite charge
Proteins of same charge flow through (elute) first
Collected in fracions to purify proteins
To get the proteins retained in column, change buffer (different pH and salt concentration)

Size: Gel filtration
Beads slow down small proteins
Migrate slower (“Included”) in resin and elute last
Larger proteins travel faster (“excluded”) through resin and elute first
Collected in fractions to purify proteins

Solubility: Isoelectric point precipitation
Separated based on solubility difference in water
Charge of protein attracts water forming hudrating shell and solubilises
At pH = protein pl, no nett charge
proteins interact with each other rather than water
Might precipitate

Solubility: Ammonium Sulphate Precipitation
(NH4)2SO4 stripcs away hydration shell
Decreases solubility allowing proteins to precipitate
Different proteins precipitate at different concentrations of (NH4)2SO4

Protein Denaturation
Structures must be maintained for biological function
Agents may cause loss of structures (2 degree, 3 degree and/or 4 degree) by disrupting bonds
Loss off structure + function = denaturation
Factors causing denaturation
Organic solvents - disrupt H bonds (2,3,4)
Detergents - disrupt hydrophobic bonds (3, 4)
pH extremes - disrupt H bonds (2,3,4) and ionic (electrostatic) bonds (3,4)
Heat - increase kinetic energy and disrupt all non-covalent bonds (2,3,4)

Enzymes
Objectives
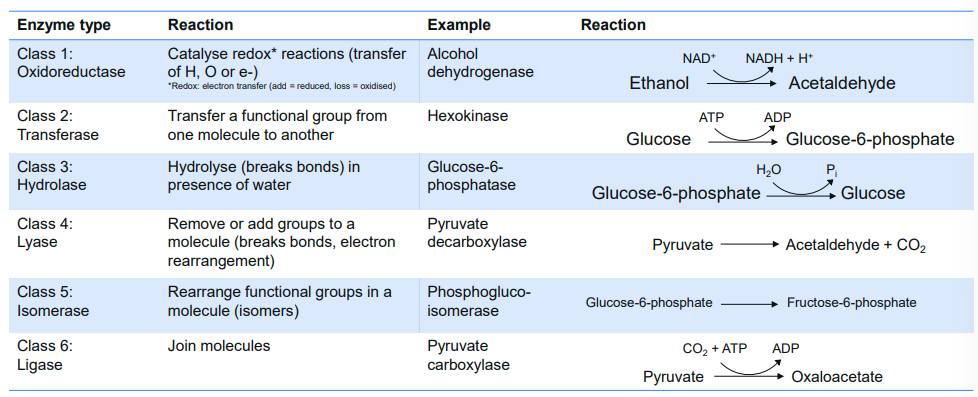
Distinguish between reaction types of six major classes of enzymes
Identify properties of enzymes
Explain how enzymes function and evaluate the influence of various factors on reaction rates
Enzyme Nomenclature (Naming) + Classification
Suffix “ase”
Naming based on what it reacts with and how
E.g. pyruvate decarboxylase
Remove carboxyl group from pyruvate
Forming acetaldehyde and CO2

Enzyme Properties
Catalyst: speeds up reactions
Equilibrium is attained more rapidly with enzymes
Stable: enzymes retain active structural conformation during reactions
Specific: only catalyse a single reaction (or a group of closely related reactions)
Specific choice of substrates
Tight regulation in cell (prevent chaos

Equilibrium Constant (Keq)
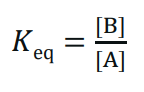
Measure directionality of reversible reaction (A ←→ B)
Reaction will strive towards Keq
Same regardless whether enzyme is present
E.g.
Glucose-6-phosphate (G6P) ←→ fructose-6-phosphate (F6P)


Activation Energy (Ea)
Activation energy - reactants must gain enough energy to collide effectively
Transition state - high energy, unstable arrangeent reactants must reach
Higher free energy - transition state has more free energy than starting reactants
Catalysts - lower activation energy so transition state is easier to reach
Temperature increases - gives particles more magnetic energy to overcome energy barrier

Enzymes as Catalysts
Lowers activation energy requirement
Forms transient, reversible complexes with substrate, facilitates interaction and stabilises intermediate transition state
Substrate binding occurs at active site of enzyme
Induced fit model: conformation change in active site as substrate binds
Changes the rate at which Keq is achieved

Catalytic enzymes are dependent on:
Enzyme concentration [E]
Substrate concentration [S]
Temperature
pH
Enzyme concentration [E]
As [E] increases, reaction velocity increases
Positive linear relationship
When [S] is in excess

Substrate concentration [S']
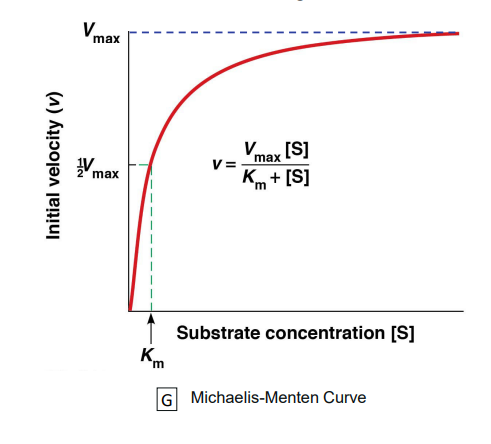
As [S] increases, reaction velocity increases until a certain point
Low [S]: reaction velocity increases linearly with [S]
Km: [S] where reaction velocity is half of max velocity
High [S]: reaction velocity increases independent of [S] until Vmax
Vmax: Maximum velocity (rate of reaction)
Where all available enzymes are working at maximum
Importance of Km, Vmax
Used to calculate rate at which substrate → product
Vmax: measure of potential maximum rate of reaction
Km (Michaelis constant): [S] where reaction velocity is half of max velocity
Tells binding affinity between anzyme and substrate
Km has inverse relationship with binding affinity of an enzyme for its substrate
High Km = low affinity
Low Km = high affinity
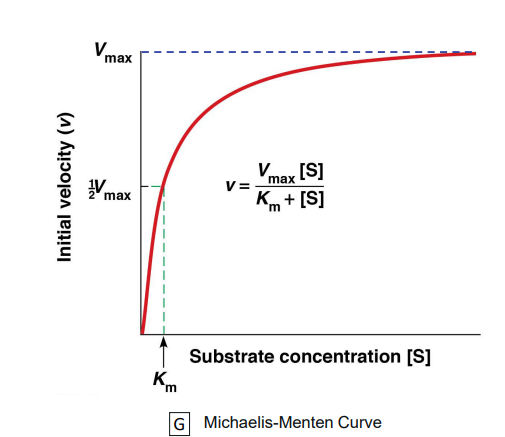
*Km and Vmax help calculate reaction rate at different substrate concentrations
*High Km needs more substrate to reach half-max speed → weak binding
*Low Km means enzyme reaches half-max speed at low substrate → strong binding
Temperature
Low temperature = enzymes inactive
Temperature up, reaction velocity up
Kinetic energy increases collision rate
Extreme temperature denatures proteins
Non-covalent bonds in proteins affected
Diminished enzyme activity

pH
Most enzymes active within pH range of ~3-4 units
Extreme pH denatures enzymes
Amino and carboxyl groups affected leading to disruption in electrostatic bonds
Hydrogen and ionic bonds affected
Diminished enzyme activity

Enzyme Regulation
Substrate-level regulation
Regulation that affects substrate/products and enzyme interactions - reaction rate changes depending on how much substrate/product present
More substrate → enzyme works faster
More product → reaction may slow down
Not efficient - regulation type is basic and often not enough to control enzyme activity in cells
Feedback inhibition
Allosteric regulation
Allosteric inhibition
Allosteric activation


Covalent modification
Addition or removal of chemical group
E.g. phosphorylation/dephosphorylation
Proteolytic cleavage
E.g. Enterokinase removes a hexapeptide segment from trypsinogen


Membranes and Transport
Membrane Recap
Defines boundaries of cell and any internal compartments
Site for biochemical functions
Transport solutes in/ut of cell (selective permeability)
Detect and transmit electrical/chemical signals
Provide mechanisms for cell-to-cell contact, adhesion, communication

Membrane Structure
Fluid mosaic model
Proposed in 1970s
Fluid: lipids, proteins can move
Side-ways (lateral)
Around (rotation)
Flip-flip (transverse)
Mosaic: presence of different kinds of proteins (mainly) and lipids such as cholesterol

Components:
Phospholipid bilayer
Hydrophilic heads
Hydrophobic tails
Proteins - lipid ratios differ among membranes (protein:lipid)
E.g. outer mitochondria (~1.2:1), inner mitochondria (~3.5:1)
Carbohydrates
*Membranes that do lots of work, have more proteins
*Membranes that are more structural have more lipids
Membrane Lipids
Phospholipids
Glycolipids
Sterols
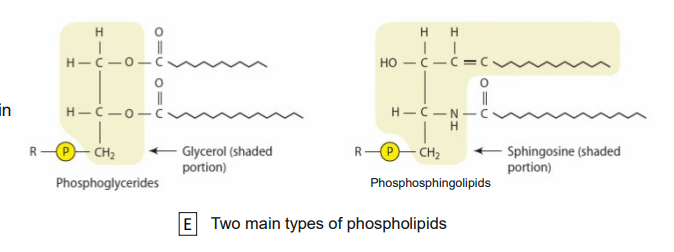
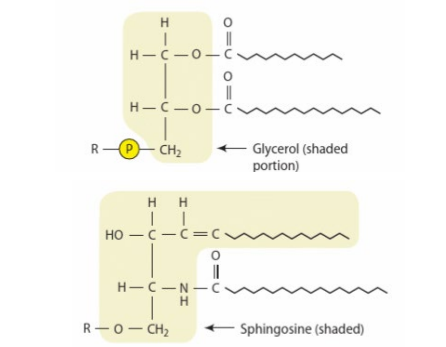
Phospholipids
Most abundant
Consists of polar head (attached to phosphate), backbone, non-polar fatty acid tails
E.g. Phosphoglycerides, phospholingolipids

Phospholipid structure
Polar head
Phosphate group
Variable R group (e.g. serine, ethanolamine, inositol)
Charged, therefore hydrophillic (polar)
Backbone
Glycerol/sphingosine
Non-polar tails
Hydrophobic
Fatty acids
Long unbranched hydrocarbon chain with carbonyl group
Saturated or unsaturated


Fatty Acids

Saturated fatty acids | Unsaturated fatty acids |
SIngle bonds | Double bonds → bends/kinks/chains |
Pack tightly | Do not pack tightly |
Solidify at room temperature (RT) | Remain liquid at RT |
E.g. palmitic acid, stearic acid | E.g. oleic acid, linoleic acid |

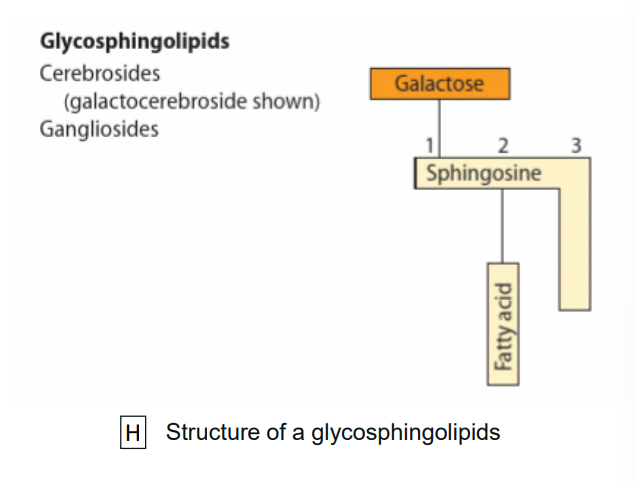
Glycolipids
Lipid with carbohydrate group
E.g. glycoglycerolipids/glycospingolipids
Sterols
Have four-ringed hydrocarbon
E.g. Cholesterol, phytosterols (plant)

Membrane Carbohydrates
Oligosaccharides that can be attached to proteins (glycpproteins) or lipids (glycolipids)
Help signalling
Act as molecular markers (antigen) for recognition of substances
E.g. glycosphingolipid: A antigen and B antigen
Cell surface markers for different group of red blood cells
Membrane Proteins
Mosaic part of model

Integral proteins
Hydrophobic regions embedded within lipid bilayer
Classified by mode of attachment
Integral monotopic proteins
Transmembrane protein that acts as proton pump/channel

Peripheral proteins
Extrinsic - lacks hydrophobic sequences
E.g. Enzymes
Lipid-anchored
Hydrophilic proteins - on membrane surfaces
E.g. glycosylphosphatidylinositol (GPI) - anchored membrane proteins

Membrane Protein Function
Transport
Ion homeostasis
Enzymatic
Localises metabolic pathways such as ETC and ATP production
Singal transduction
Binds to signalling molecule and relays messages
Cell-to-cell recognition
Functions as markers for cellular identification
Cell junctions
Glue cells together for barrier
Structure attachment
Attachment to cytoskeleton

Membrane Permeability
Selective permeability
Hydrophobic barrier to most molecules and ions
Permeable to small molecules (O2, Co2, but H2O is slower)
Hardly permeable to larger molcules (>100 MW molecules, glucose, - MW 180)
Impermeable to ions (H+, Na+, K+, Cl-)
Most substances needed by cell are hydrophilic, may require transport protein to enter cell
Transport Across Membranes
Simple diffusion (passive)
Osmosis (passive)
Facilitated diffusion (passive)
Active transport (active)
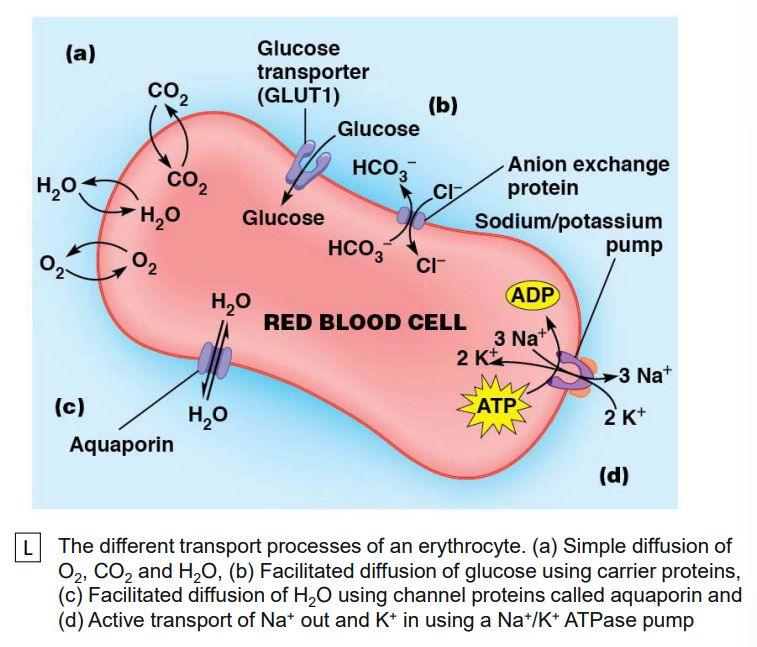
Simple diffusion
High → Low
Bidirectional movement depends on concentration gradient
Does not require energy
Does no require membrane protein
Slow; may not meet cellular needs
E.g. Gases (02, CO2)

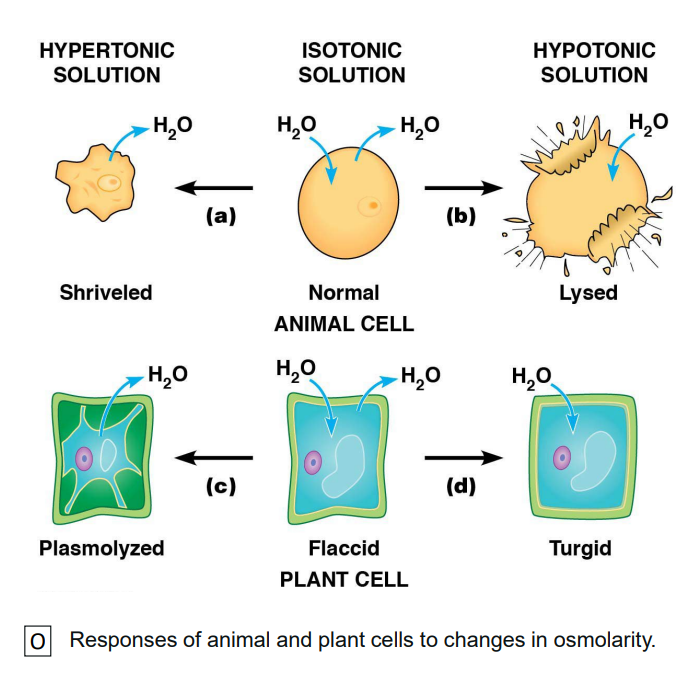
Osmosis
Diffusion of water across selective permeable membrane
Dependent on relative osmolarity (total solute concentration)
Different species have different osmolarities

Types of solutions:
Hypertonic
Higher solute concentration outside cell
Isotonic
Same solute concentration to cell
Hypotonic
Higher solute concentration inside cell
Facilitated
Requires membrane proteins
Channel protein or carrier protein
Selective permeability (controlled passage)
High → low
Faster than simple
Does not require energy
Temperature-sensitive
Can be saturated at high solute
E.g. transport of glucose via carrier protein
Active
Requires membrane carrier protein (pump)
Requires energy (ATP)
Molecules able to move against concentration
Uptake scarce essential nutrients
Remove waste and secretory products
Maintain [ions]
E.g. Na+/K pump (Na+ out and K+ in)

Transport Processes
Transport may differ in number of solutes transported and direction of movement
Uniport
Symport
Antiport


Topic 3
Objectives
Define and discuss examples of autotrophs and heterotrophs
Consider Solar and chemical sources of energy
Define Metabolism
Compare catabolism and anabolism
Introduce role of ATP as an energy currency
Compare Anaerobic vs aerobic respiration
Understand ATP’s role as an “energy currency”
Describe catabolic and anabolic metabolism
General overview of anaerobic vs aerobic catabolism
Introduce intermediate electron acceptors
Define and describe the steps of glycolysis
Understand the fate of pyruvate
Introduction to Energy Metabolism
Energy
Cell growth requirements:
Energy
Chemical building blocks
Building blocks = C O N P S
Building blocks are used to make macromolecules
Macromolecules:
Macromolecules | Structure | Function |
Proteins | Keratin | Enzymes |
Carbohydrates | Blood group antigens | Starch, glycogen |
Lipids | Membranes | Energy store, insulation |
Nucleic acids | Molecular scaffolds | Genetic code |
Carbon sources
Organisms classified by how they obtain carbon
Autotrophs - C from atmospheric CO2
Heterotrophs - C from other organisms

Autrotrophs
‘Self feeding’
Obtain energy from CO2
Energy dependent process
How autotrophs obtain energy classifies them as either photosynthetic or chemosynthetic
Photosynthetic organisms
Use solar energy

Green plants
Photosynthetic bacteria and algae
Chemosynthetic organisms
Use chemical energy
From oxidisation of inorganic molecules
E.g. nitrifying bacteria

Heterotrophs
‘Feeding off others’
Carbon is derived from assimilated compounds
E.g. glucose, a 5-carbon sugar
Energy also obtained from these compounds
Animals
Most bacteria
Non-green plant cells

Carbon sources
Not all cells in an organism are the same
E.g in plants:
Roots = heterotrophic
Leaves - autotrophic
Cells can be flexible
E.g. leaves:
During day, sunlight = auto
At night, no sunlight = hetero


Cellular metabolism
Metabolism = all of enzyme-catalysed reactions in a cell
Two phases:
Catabolism
Anabolism

Catabolism
Degradative reactions of metabolism
Larger compounds are broken down into smaller ones generating energy
E.g.

Anabolism
Synthetic (building) reactions of metabolism
Smaller compounds combined into larger ones
Requires energy
E.g.

Cellular processes require energy for:
Anabolism - generation of more complex biomolecules
Transport - active transport of molecules within/between cells
Mechanical work - e.g. muscle contraction
All these processes require an input of energy such as ATP
ATP
Energy carrier, transmitter, currency
NOT energy store
Nucleoside triphosphate

Nucleoside triphosphates
Only differ in their nitrogen bases

Used in
Polysaccharide synthesis (UTP)
Protein synthesis (GTP)
Lipid synthesis (CTP)
RNA synthesis (CTP, GTP, UTP)
Ribonucleoside triphosphates

Deoxyribonucleoside triphosphate
If change sugar from ribose to deozyribose
Used in DNA synthesis
dATP
dCTP
dGTP
dTTP

DNA = deoxyribonucleic acid
Ribo vs deoxyribonucleoside triphosphates


ATP hydrolysis
ATP energy released via hydrolysis


ATP generation
ATP generated via catabolism in cell
Two processes:
Fermentation
Aerobic respiration
Fermentation
Under anaerobic conditions ( no O2)

Lactic acid fermentation
E.g. in muscle, in absence of O2

Ethanol fermentation
E.g. in yeast, in absence of O2

Aerobic respiration
Fuel molecules (e.g. glucose) completely oxidised to CO2
ATP produced by both substrate-level phosphorylation and oxidative phosphorylation
Hydrogen ions (H+) and their associated electrons (e-) are transferred from fuel molecules to O2
O2 is reduced to H2O while fuel molecules are oxidised to CO2
This is an oxidation-reduction reaction
Under aerobic conditions (O2)
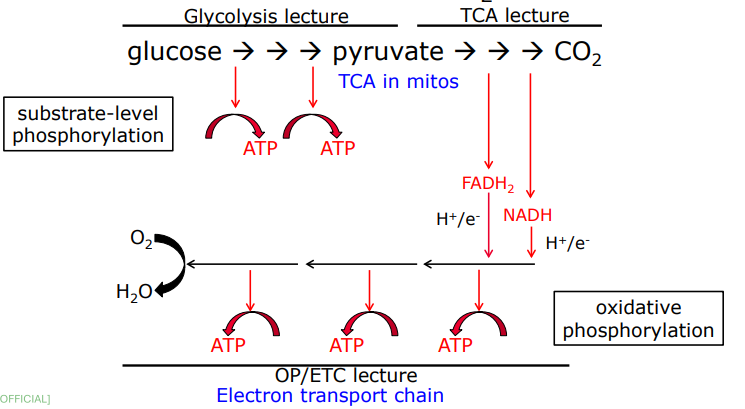
Summary table:
In ABSENCE of O2
Fermenation occurs;
Glucose converted to pyrubate then to ethanol OR lactate
Substrate phosphorylation only
In PRESENCE of O2
Glcose coverted to pyruvate then CO2
Both substrate-level and oxidative phosphorylation
Glycolysis
Cellular Energy
Cells require energy (ATP) to grow
ATP - Adenosine triphosphate
Cells generate ATP via catabolic metabolism
ATP Generation

Catabolism
Fermentation
Lactic acid fermentation
Ethanol fermentation
Aerobic respiration
NAD^+ = nicotinamide adenine dinucleotide
FAD = flavin adenine dinucleotide
Lactic Acid Fermentation (Anaerobic)
(slides + Khan Academy)
E.g. in muscle (O2 absent)
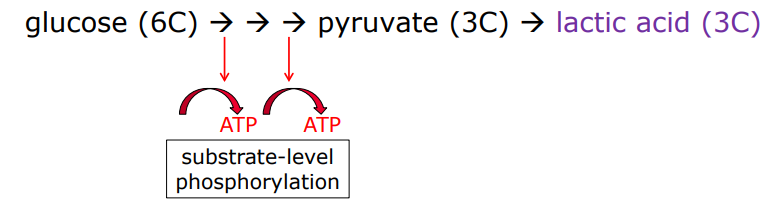
NADH transfers electrons directly to pyruvate → pyruvate as byproduct
Lactate = deprotonated form of lactic acid (deprotonated = removal of H ion or proton from molecule by base in acid-base reaction)
Lactic acid produced in muscle cells transported via bloodstream to liver then converted back to pyruvate and processed in remaining reactions of cellular respiration
4 ATP is produced in lactic acid fermentation but 2 ATP is consumed in initial priming steps, leaving 2 ATP
Ethanol Fermentation (Anaerobic)
(slides + Khan Academy)
E.g. in yeast (O2 absent)

NADH donates electrons to a derivative of pyruvate, produces ethanol
Pyruvate to ethanol:
Carboxyl group removed from pyruvate and released as CO2, producing two-carbon molecule (acetaldehyde)
NADH Passes electrons to acetaldehyde, regenerating NAD^+ and forming ethanol
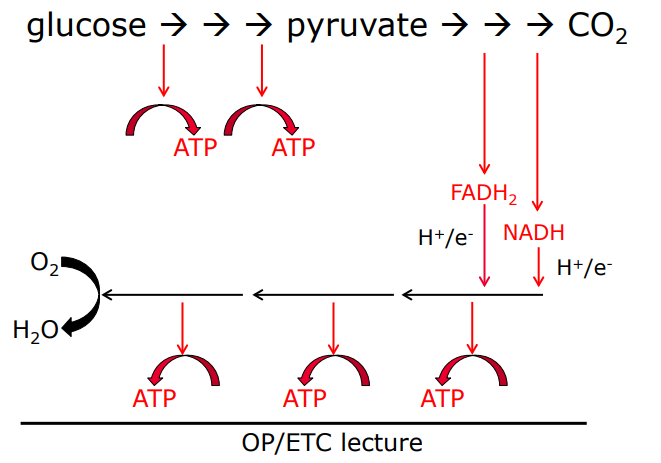
Aerobic Respiration I

Glycolysis
Glucose (6C) converted to 2 pyruvate (2× 3C). Produces ATP and converted NAD^+ to NADH
Pyruvate oxidation
Each pyruvate goes into mitochondrial matrix, converted to two-carbon molecule bound to coenzyme A (AKA acetyl CoA)
CO2 released
NADH generated
Citric acid cycle
Acetyl coA from last step, combines with 4-carbon molecule
ATP, NADH, FADH2 produced
CO2 released
Oxidative phosphorylation
NADH and FADH2 from other steps deposit electrons in electron transport chain, turning back into NAD+ and FAD.
As electrons move down chain, energy released and used to pump protons out of matrix (forms gradient)
Protons flow back into matrix through ATP synthase (enzyme), produces ATP
At end of ETC, O2 accepts electrons and takes up protons to form water
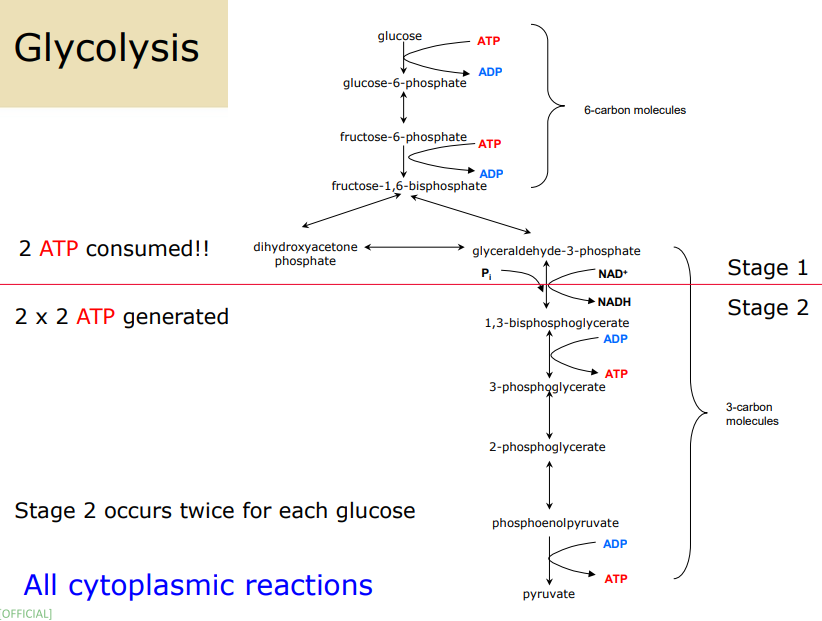
Glycolysis Steps
Glycolysis phosphorylated to glucose-6-phosphate
Consumption of 1 ATP
ATP → ADP
One-way reaction catalysed by hexokinase
Once phosphorylated, glucose → polar + “trapped” in cell with phospholipid membrane
Glucose-6-phosphate isomerised to fructose-6-phosphate
Substrate and product have same molecular weight
Reversible reaction catalysed by phosphoglucoisomerase (an isomerase)
Fructose-6-phosphate phosphorylated to fructose-1,6-bisphosphate
Consumption of 1 ATP
One-way reaction catalysed by phosphofructokinase
ATP → ADP
Fructose-1,6-biphosphate cleaved to produce 2× 3-carbon molecules
dihydroxyacetone phosphate (DHAP) and glyceraldehyde-3-phosphate (G3P)
Reversible reaction catalysed by aldolase
Only G3P can proceed through glycolytic pathway
DHAP isomerised to G3P
DHAP → G3P
Reversible reacction catalysed by triose phosphate isomerase
All reactions here will occur twice for the one glucose — started with glycolysis 6C glucose, continue with 2× 3C metabolites
Glyceraldehyde-3-phosphate oxidsed to 1,3-biphosphoglycerate
Requires 1x NAD^+ and 1x P
Coupled to reducion of NAD+ to NADH
Reversible reaction catalysed by G3PDH
Note: Pi (inorganic phosphate) and NAD^+ substrates
1,2-biphosphoglycerate dephosphorylated to 3-phosphoglycerate
One phosphate group transferred to ADP, forming first ATP
Substrate level phosphorylation
Reversible reaction catalysed by phosphoglycerate kinase
3-phosphoglycerate converted to 2-phosphoglycerate
Remaining phosphate group transferred to different carbon
Reversible reaction catalysed by phosphoglyceromutase
2-phosphoglycerate converted to phosphoenolpyruvate (PEP)
Reversible reaction catalysed by enolase (a DH)
Phosphoenolpyruvate is dephosphorylated to pyruvate
Phosphate group transferred to ADP, forms ATP (second generation of ATP)
[STEPS 6-10 OCCUR TWICE FOR EACH GLUCOSE]

AFTER glycolysis:
Aerobic respiration @ mitochondrion
Ethanol fermentation @ cytoplasm
Lactic acid fermentation @ cytoplasm
Glycolysis Steps (REWRITTEN)
Hexokinase
• Glucose becomes glucose-6-phosphate.
• A phosphate is added.
• Glucose is trapped inside the cell.
• Uses 1 ATP.
• Irreversible.Phosphoglucoisomerase
• Glucose-6-phosphate becomes fructose-6-phosphate.
• Molecule is rearranged to prepare for splitting.
• Reversible.Phosphofructokinase (PFK)
• Fructose-6-phosphate becomes fructose-1,6-bisphosphate.
• Second phosphate added.
• Commits molecule to glycolysis.
• Uses 1 ATP.
• Irreversible.Aldolase
• Fructose-1,6-bisphosphate splits into DHAP and G3P.
• Produces two 3-carbon molecules.
• Reversible.Triose Phosphate Isomerase
• DHAP is converted to G3P.
• Only G3P continues through glycolysis.
• From here, all steps occur twice per glucose.
• Reversible.G3P Dehydrogenase
• G3P becomes 1,3-bisphosphoglycerate.
• G3P is oxidised.
• NAD+ becomes NADH.
• Pi is added.
• Reversible.Phosphoglycerate Kinase
• 1,3-bisphosphoglycerate becomes 3-phosphoglycerate.
• High-energy phosphate transferred to ADP.
• Produces ATP.
• Substrate-level phosphorylation.
• Reversible.Phosphoglyceromutase
• 3-phosphoglycerate becomes 2-phosphoglycerate.
• Phosphate moved to another carbon.
• Reversible.Enolase
• 2-phosphoglycerate becomes phosphoenolpyruvate (PEP).
• Water removed.
• Creates high-energy PEP.
• Reversible.Pyruvate Kinase
• PEP becomes pyruvate.
• Phosphate transferred to ADP.
• Produces ATP.
• Irreversible.
Overall Glycolysis Equation
• Glucose + 2 ADP + 2 Pi + 2 NAD+ → 2 pyruvate + 2 ATP + 2 NADH
• Input: 2 ATP
• Output: 4 ATP
• Net: 2 ATP
Fate of Pyruvate
Aerobic respiration:
• Occurs in mitochondria.
• Pyruvate becomes acetyl-CoA then CO2.
• Produces large amounts of ATP.
• Requires oxygen.
Ethanol fermentation:
• Pyruvate becomes acetaldehyde then ethanol + CO2.
• Regenerates NAD+.
• Occurs in cytoplasm.
Lactic acid fermentation:
• Pyruvate becomes lactate.
• Regenerates NAD+.
• Occurs in cytoplasm.
Energetics of Fermentation
• Only 7 percent of glucose’s energy is released.
• Only 30 percent of that is trapped as ATP.
• Overall efficiency is about 2 percent.
• Most energy remains in lactate or ethanol.
• Fermentation produces little ATP.
Why Ferment?
• Glycolysis needs NAD+.
• Without oxygen, NADH cannot be oxidised in mitochondria.
• Fermentation regenerates NAD+.
• Allows glycolysis to continue.
• Prevents energy shutdown.
TCA Cycle (Kreb’s Cycle)
Occurs in the mitochondrial matrix
Purpose:
Completely oxidises acetyl CoA to CO2.
Produces NADH and FADH2 (electron carriers).
Produces 1 GTP (equivalent to ATP).
Regenerates oxaloacetate to continue the cycle.
Aerobic/Anaerobic Fate of Glucose
Without oxygen:
Pyruvate becomes lactate (muscle, microbes) or ethanol + CO2 (yeast).
NADH is re-oxidised to NAD+.
Allows glycolysis to continue.
With oxygen:
Pyruvate becomes acetyl CoA.
Acetyl CoA enters the TCA cycle.
NADH and FADH2 feed electrons into the electron transport chain to generate ATP.
Steps
Pyruvate to Acetyl CoA
• Pyruvate (3C) is decarboxylated to acetyl CoA (2C).
• Releases CO2.
• Produces NADH.
• This is the link between glycolysis and the TCA cycle.Acetyl CoA + Oxaloacetate to Citrate
• Acetyl CoA (2C) combines with oxaloacetate (4C) to form citrate (6C).
• CoA is released and recycled.Citrate to Isocitrate
• Citrate is rearranged to isocitrate.
• Prepares molecule for oxidation.Isocitrate to Alpha-Ketoglutarate
• Isocitrate (6C) is oxidised to alpha-ketoglutarate (5C).
• Produces NADH.
• Releases CO2.Alpha-Ketoglutarate to Succinyl CoA
• Alpha-ketoglutarate (5C) is oxidised to succinyl CoA (4C).
• Produces NADH.
• Releases CO2.
• By this step, all 3 carbons from pyruvate have been released as CO2.Succinyl CoA to Succinate
• Succinyl CoA becomes succinate.
• Produces GTP (equivalent to ATP).
• Only substrate-level phosphorylation in the TCA cycle.Succinate to Fumarate
• Succinate is oxidised to fumarate.
• Produces FADH2.
• Only step producing FADH2.Fumarate to Malate
• Fumarate is converted to malate.Malate to Oxaloacetate
• Malate is oxidised to oxaloacetate.
• Produces NADH.
• Oxaloacetate is ready to combine with another acetyl CoA.
Yield
Per pyruvate:
3 NADH
1 FADH2
1 GTP
2 CO2
Per glucose:
Glucose produces 2 pyruvate.
Therefore:
6 NADH
2 FADH2
2 GTP
4 CO2
ETC (Phase II)
NADH produces 3 ATP.
FADH2 produces 2 ATP.
Oxygen is the final electron acceptor.
Water is produced.
ATP Yield from TCA Cycle and ETC (per pyruvate)
4 NADH = 12 ATP
1 FADH2 = 2 ATP
1 GTP = 1 ATP
Total = 15 ATP per pyruvate
ATP Yield from TCA Cycle and ETC (per glucose)
2 pyruvate = 2 x 15 = 30 ATP
Glycolysis NADH and the Glycerol Phosphate Shuttle
Glycolysis produces 2 NADH in the cytoplasm.
These cannot directly enter mitochondria.
Glycerol phosphate shuttle transfers electrons into mitochondria.
Converts cytoplasmic NADH into mitochondrial FADH2.
Each FADH2 produces 2 ATP.
Total from glycolysis NADH = 4 ATP.
Total ATP from Complete Oxidation of Glucose
Glycolysis: 2 ATP
TCA/ETC: 30 ATP
Shuttle: 4 ATP
Total: 36 ATP per glucose
Overall Aerobic Respiration Equation
Glucose + 6 O2 + 36 ADP + 36 Pi → 6 CO2 + 6 H2O + 36 ATP
Energetics
Energy released from glucose oxidation: 2870 kJ.
Energy trapped in ATP: 1098 kJ.
Efficiency: 38%
Much higher than fermentation (7% released, 2% trapped).
Summary of Glucose Metabolism
Glycolysis: glucose to pyruvate, 2 ATP, 2 NADH.
Without oxygen: fermentation regenerates NAD+.
With oxygen: pyruvate to acetyl CoA, enters TCA cycle.
TCA cycle produces NADH, FADH2, GTP.
ETC uses NADH and FADH2 to generate ATP.
Total ATP per glucose: 36.
ETC and Oxidative Phosphorylation
Location:
ETC and ATP synthase embedded in inner mitochondrial membrane
Cells with high energy demand have many mitochondria with extensive cristae
Respiratory control
ETC has multiple steps with free energy release
Electrons do not flow unless ADP is available
ADP availability regulates ETC and OP
Prevents unnecessary fuel burning
Transport mechanisms
Outer membrane permeable (<5000 MW)
Inner membrane impermeable
ADP and Pi must enter mitochondria
ATP must exit mitochondria
Transport via translocase proteins
Inhibitors
ETC inhibitors
Cyanide, azide, hydrogen sulphide, carbon monoxide
Block cytochrome a + a3
Antimycin
Blocks cytochrome b → c1
Rotenone
Inhibits NADH oxidoreductase
Oxidative phosphorylation inhibitors
Oligomycin
Inhibits ATP synthase
Atractyloside
Inhibits translocase proteins
Uncoupling
ETC and OP normally coupled
Uncouplers allow electron flow without ATP production
Proton gradient destroyed
Energy released as heat
Occurs naturally in brown adipose tissue (thermogenesis)
Synthetic uncoupler: DNP
2,4‑dinitrophenol
Shuttles protons across membrane
Eliminates proton gradient
Energy lost as heat
Used as a diet pill in 1930s; banned due to deaths
Still used illegally
Electron Transport Chain
Electrons removed from NADH
Passed through redox intermediates to O2
O2 is final electron acceptor
ETC proteins contain Fe atoms (Fe3+ / Fe2+)
Purpose: oxidise NADH and FADH2, transfer electrons to O2, pump H+
ETC Pathway
NADH oxidoreductase
FMN
Coenzyme Q
Cytochrome b
Cytochrome c1
Cytochrome c
Cytochrome a + a3
O2 → H2O
FADH2 entry
FADH2 enters later in the chain
Produces less ATP than NADH
ETC complexes
Located in inner mitochondrial membrane
NADH oxidation pumps ~10 protons
Coupling of ETC and OP
Electron flow pumps H+ into intermembrane space
Proton gradient drives ATP synthesis
Chemiosmotic theory: electron flow → H+ pumping → gradient → ATP
Oxidative phosphorylation
ATP synthase uses H+ returning to matrix
ADP + Pi + H+ → ATP + H2O
Proton gradient provides energy
ETC and OP are coupled processes