Assumptions for ANCOVA
Tests for the assumptions of normality:
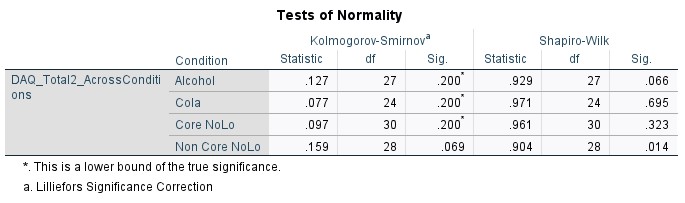
looking for a nonstatistically significant result that indicates that the dependent variable (postDAQ) for the individual level of the independent variable would be normally distributed
All levels except from the Non core NoLo condition has a non-statistically significant result (>.05)
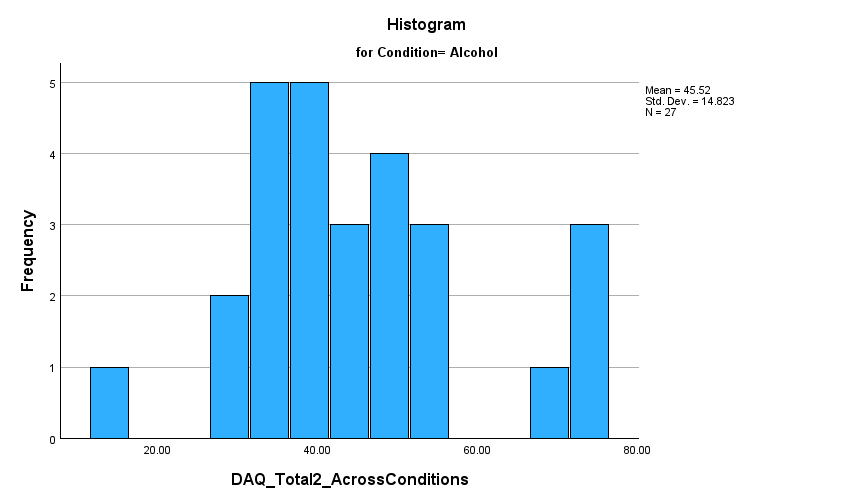
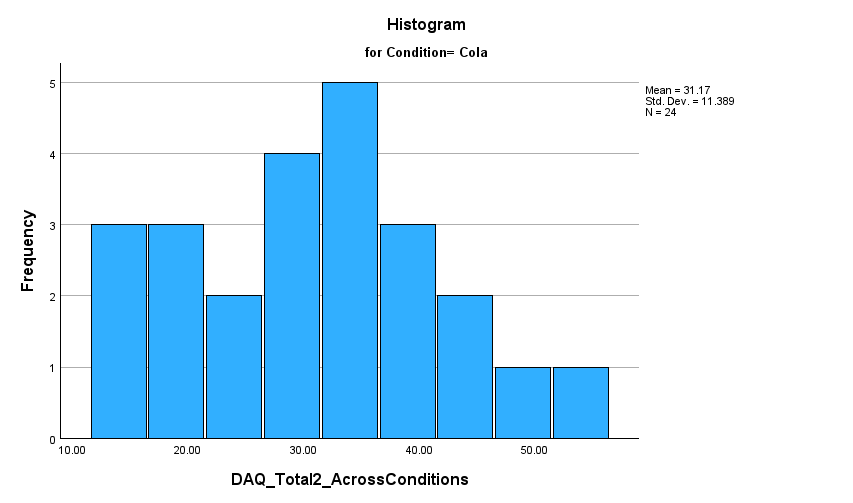
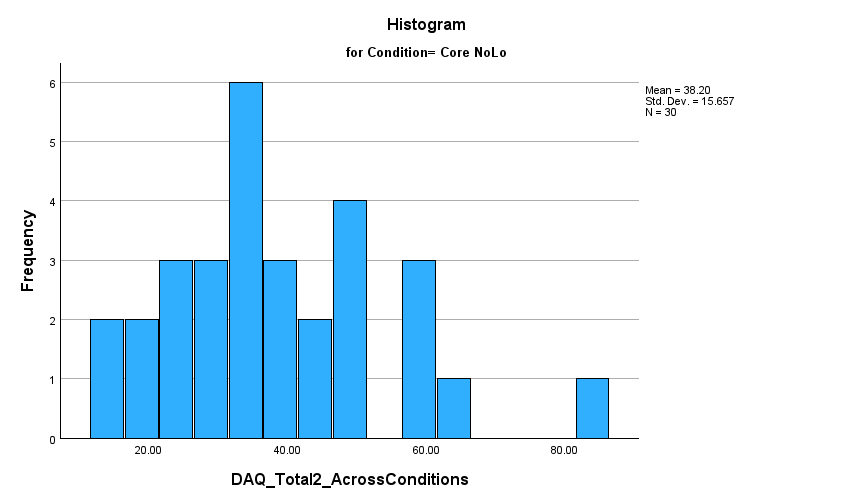
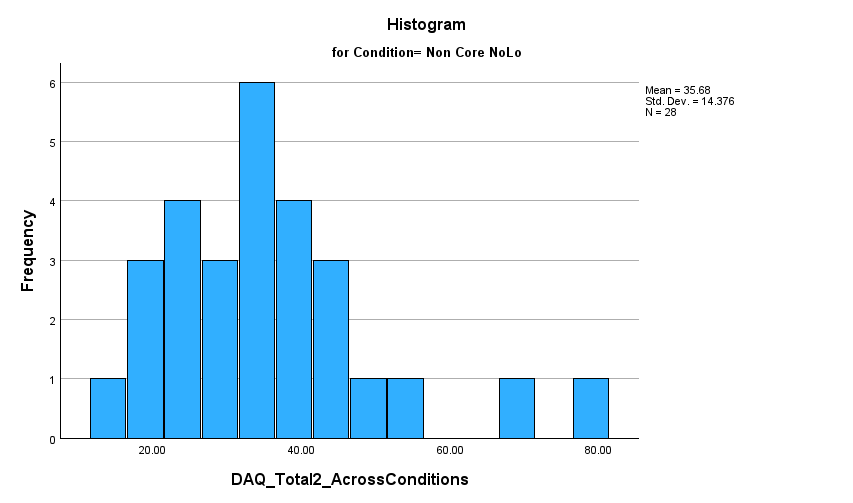
We can then look at the histograms, to see if there is a normal distribution of data
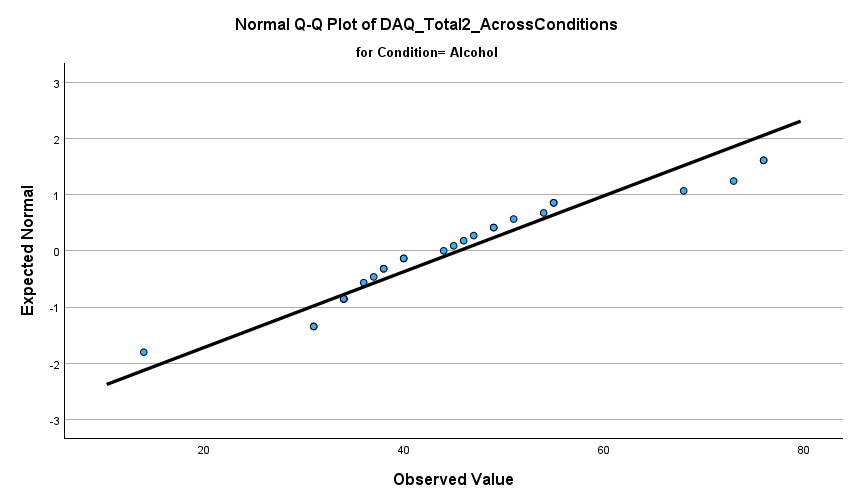
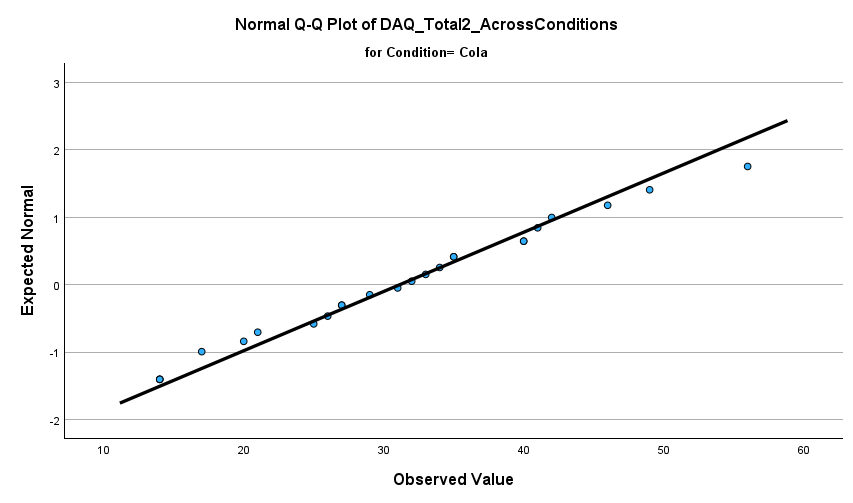
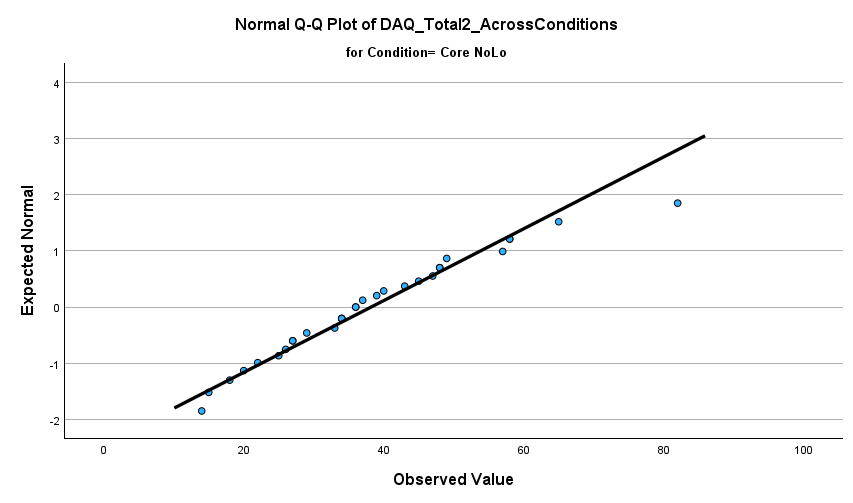
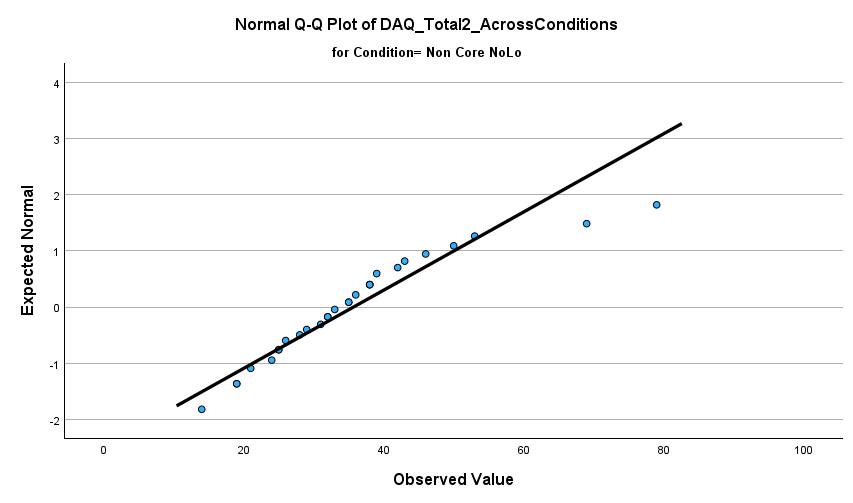
With the Q-Q plots, we want the points to be fairly close to the lines
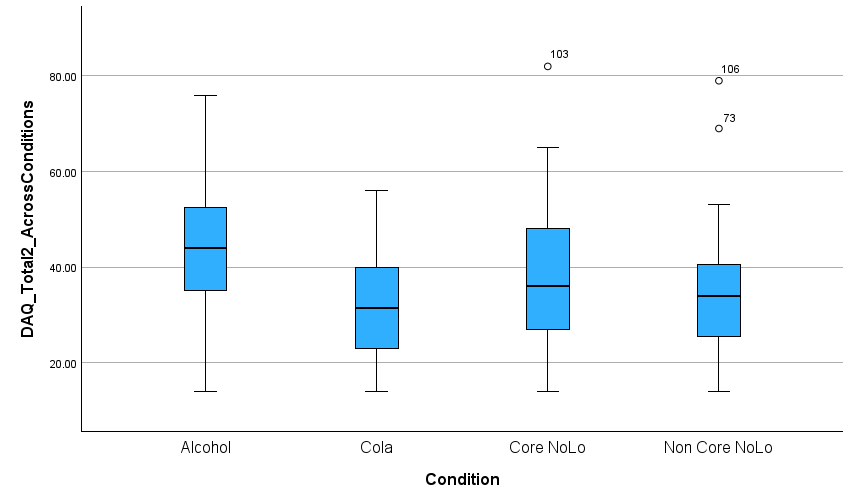
We want no outliers on the box plot diagrams
Violation of assumptions:
outliers above top whisker for core and non core NoLo conditions
The problem with outliers is that they can have a negative effect on the one-way ANCOVA, reducing the validity of your results. Fortunately, when using SPSS Statistics to run a one-way ANCOVA on your data, you can easily detect possible outliers.
Result:
assumption of normality NOT met on
shapiro-wilk
Non-core NoLo
box plot
core NoLo
Non-core NoLo
histogram
Non-core NoLo
unsure for Q-Q plot
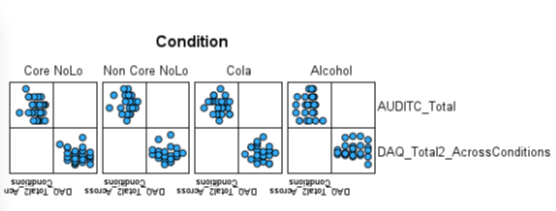
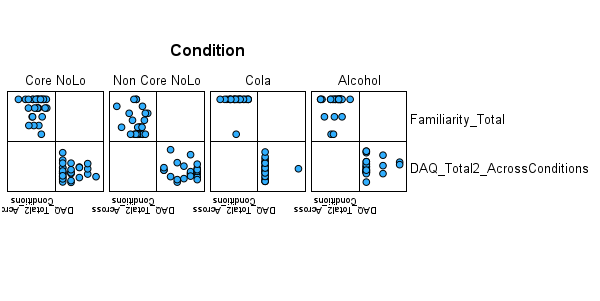
Assumption of linearity
Liner relationship between covariates and the dependent variable for each level of the independent variable
post DAQ, conditions, liking,
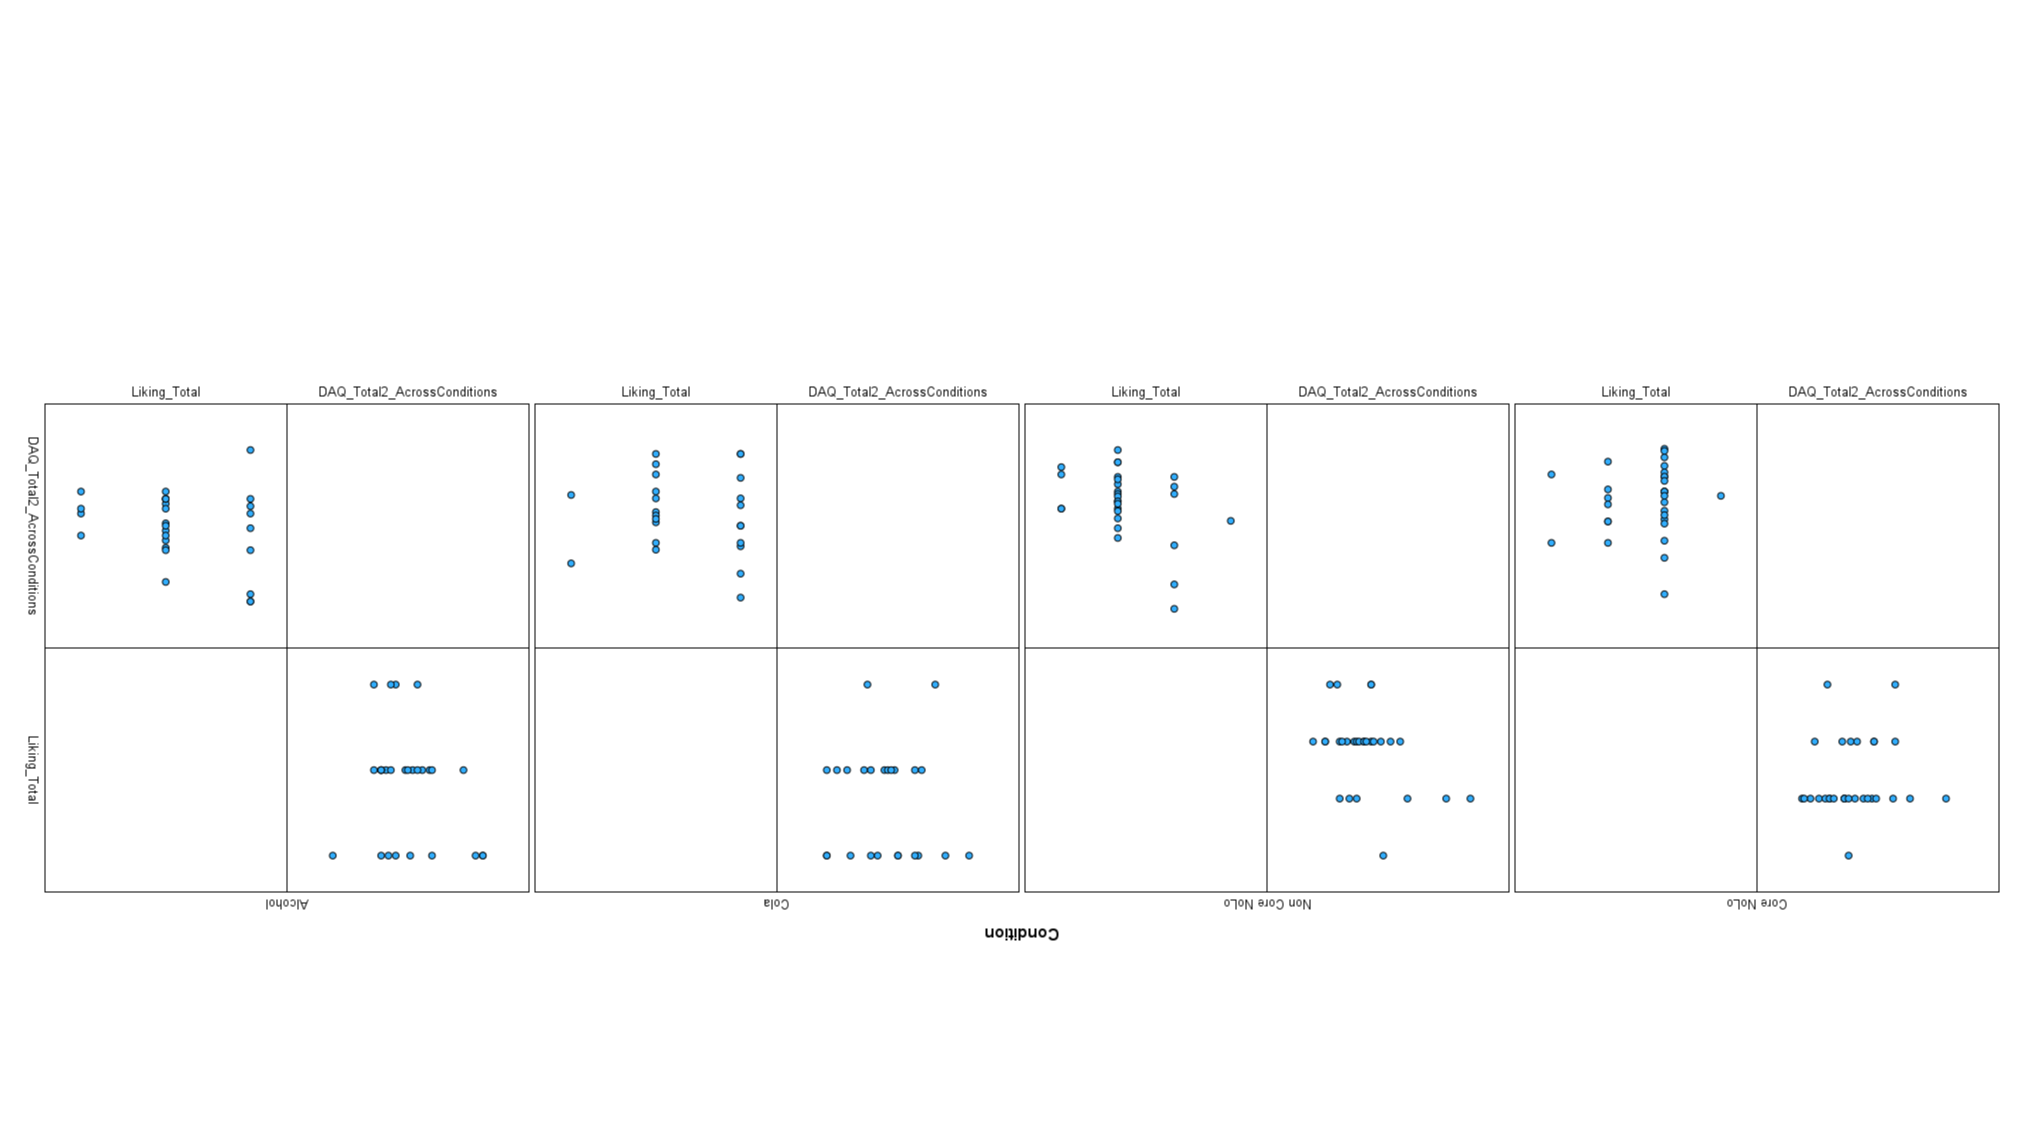
No elliptical shape
post DAQ, conditions, baseline DAQ
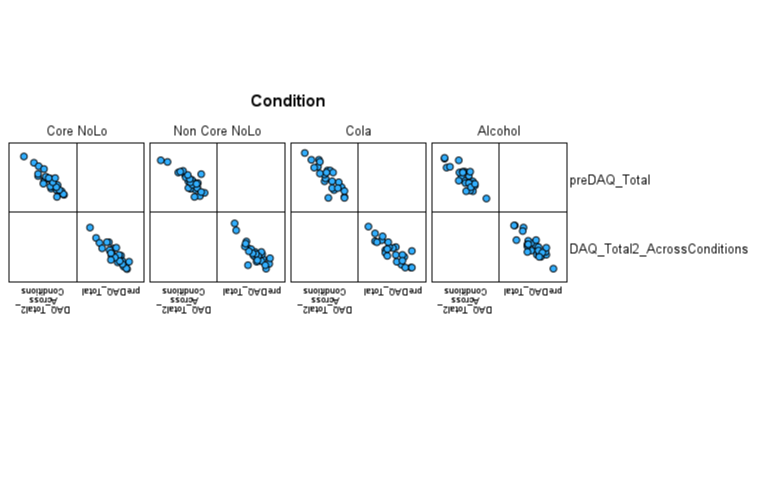
elliptical
postDAQ, condition, AUDIT-C
PostDAQ, condition, familiarity
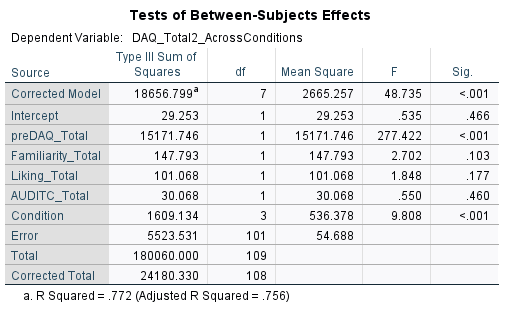
Assumption of homogeneity of regression slopes
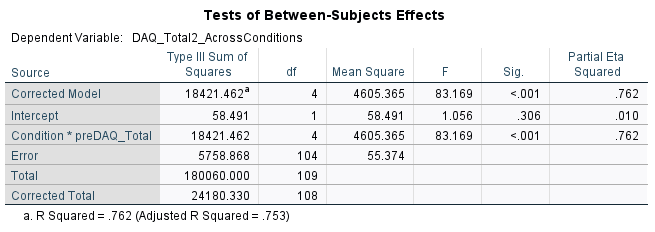
looking at the test of between-subjects Effects ‘condition*preDAQ_Total’ has a statistically significant results p < .05 (p < .001)
so we have not met the assumption for homogeneity of regression slopes
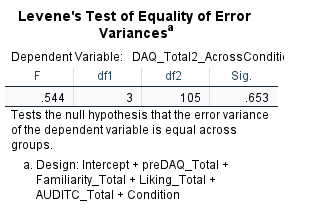
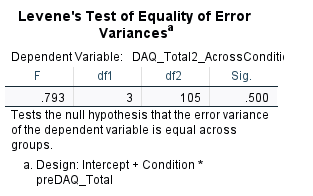
Assumption for homogeneity of variance (my version)
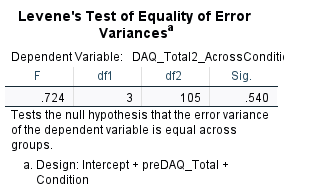
a non-statistically significant value indicates it met the assumptions of homogeneity for variance
this uses the dependent variable postDAQ total, covariant: preDAQ, independent variable: conditions
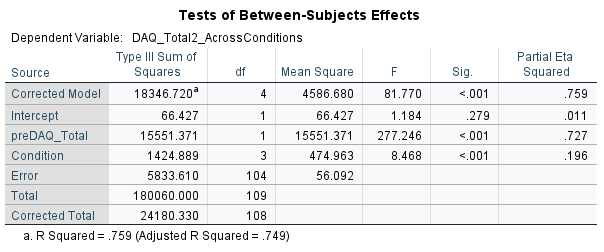
both the independent variable and the dependent variable are statistically significant (p < .05)
so whilst controlling for preDAQ values, we have a statistically significant difference on the postDAQ values
Assumption for homogeneity of variance (with Liv’s help)
Univariate Analysis of Variance