Investment Risk Management
📈 Monthly Returns
Definition: The percentage change in a stock's value from the start to the end of each month.
Formula:
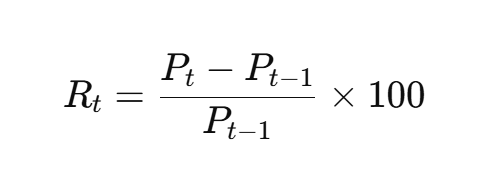
Purpose: Breaks down performance over shorter periods to detect seasonal trends, momentum, or volatility patterns.
Kid-Friendly Notes
What it is:
“How much money the stock made or lost each month.”
📉 Standard Deviation (σ)
Definition: Measures how much monthly returns deviate from the average return.
Indicates:
High σ = High risk/volatility.
Low σ = Stable returns.
Strategic use: Investors may prefer lower σ for long-term holdings, higher σ if seeking aggressive gains with controlled exposure.
Kid-Friendly Notes
What it is:
“How bumpy the ride is.”
📊 Task 3: Calculating Beta (β)
📐 Beta (β)
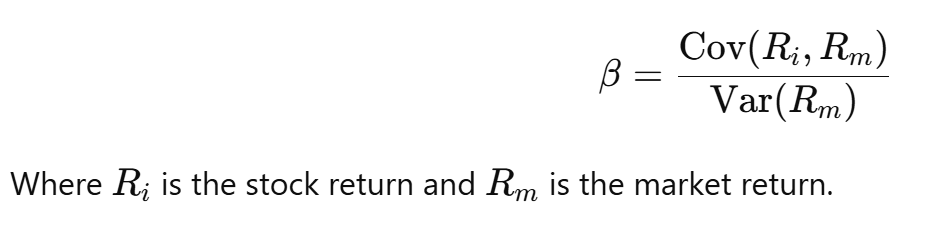
Definition: A stock’s sensitivity to movements in the overall market (systematic risk).
Formula: β = Covariance (stock, market) / Variance (market)
📌 Interpretation:
β=1: Stock moves in line with the market.
β>1: More volatile than the market.
β<1: Less volatile (defensive).
β<0: Moves opposite to the market.
🧠 Strategic use:
Use high-beta stocks in bull markets for leverage.
Use low-beta stocks in downturns for protection.
Beta informs portfolio diversification and asset allocation.
Kid-Friendly Notes
What it is:
“How much a stock moves when the whole market moves.”The market is like a dog pulling a leash. Some stocks run fast with it (high beta), some walk slowly (low beta), and some even go backward (negative beta).
📐 Task 4: Calculating Treynor Ratio
📊 Treynor Ratio (TR)
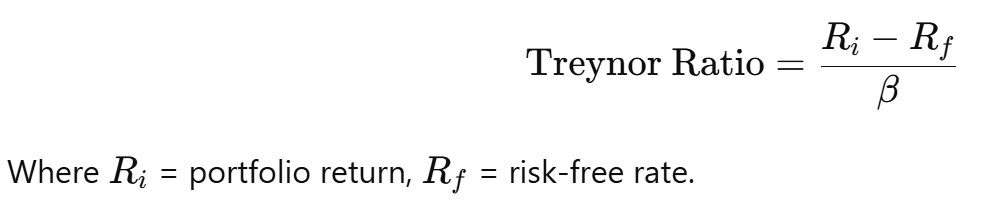
Definition: Measures return per unit of systematic risk (beta).
Formula:
📌 Interpretation:
High TR → Better risk-adjusted return for market risk.
It complements Sharpe Ratio, but focuses only on systematic risk, not total risk.
🧠 Strategic use:
Ideal for comparing well-diversified portfolios.
Helps assess performance of fund managers who take systematic risk.
Kid-Friendly Notes
What it is:
“How many points you score for each level of danger from the market.”You’re in a video game. If you earn lots of coins without facing too many monsters (market risk), you’re really good at playing. That’s a high Treynor Ratio.
📉 Task 5: Calculating Value at Risk (VaR)
🧮 Value at Risk (VaR)
Definition: The maximum expected loss over a period, at a given confidence level.
Formula (Parametric Method): VaR=Z×σ×t
Where:
Z-score for confidence level (e.g. 1.65 for 95%)
σ = standard deviation of returns
t = time horizon
📌 Interpretation:
E.g. “At 95% confidence, we won’t lose more than $X in a day.”
Types: Parametric (normal), Historical, Monte Carlo
🧠 Strategic use:
Essential for capital allocation, stress testing, and regulatory compliance.
Helps managers cap tail risk and plan for worst-case scenarios.
Kid-Friendly Notes
What it is:
“How much money you might lose on a really bad day.”You have $100. VaR tells you, “You might lose $5 tomorrow — but only if things go really wrong.” It’s like checking the weather for money storms.
🧠 Summary: Decision-Making Framework
Metric | Purpose | Use For |
|---|---|---|
Mean Return | Measures average gain | Return expectation |
Std. Deviation | Measures total risk | Volatility assessment |
Beta (β) | Sensitivity to market | Portfolio construction |
Sharpe Ratio | Return per total risk | Comparing diversified assets |
Sortino Ratio | Return per downside risk | Managing drawdowns |
Treynor Ratio | Return per market risk | Evaluating fund managers |
VaR | Worst-case loss estimation | Risk control & capital planning |
✅ Monthly Returns
excel複製編輯
=(B2 - B1) / B1
(Assumes B1 and B2 are consecutive monthly closing prices)
📉 Standard Deviation of Returns
excel複製編輯
=STDEV(C2:C13)
(Assumes C2:C13 contains monthly return values)
📐 Beta (β)
excel複製編輯
=SLOPE(C2:C13, D2:D13)
(C2:C13 = stock returns, D2:D13 = market returns)
🏆 Treynor Ratio
excel複製編輯
=(AVERAGE(C2:C13) - RiskFreeRate) / Beta
Replace
RiskFreeRateandBetawith actual values or cell references
🚨 Value at Risk (VaR) – Parametric (95%)
excel複製編輯
=NORM.S.INV(0.05) * STDEV(C2:C13)
(Negative number = expected loss)
📊 Sharpe Ratio
excel複製編輯
=(AVERAGE(C2:C13) - RiskFreeRate) / STDEV(C2:C13)
📉 Sortino Ratio
excel複製編輯
=(AVERAGE(C2:C13) - RiskFreeRate) / STDEVP(FILTER(C2:C13, C2:C13 < RiskFreeRate))
.