Venn Diagram
Venn Diagram
- You can use a venn diagram to show frequencies in a probability question
- This venn diagram shows the results when 50 people were asked whether they owned a dog or a cat
- The rectangle represents everyone who was surveyed
- The number in each section tells you how many people that section represents
- Some people owned a dog and a cat so the ovals overlap
- The overlap can be represented by D n C
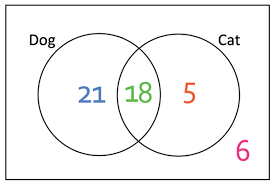
- 21+18+5 = 44 people owned a dog or a cat, you can write this as D u C