2.2.1 - Aggregate demand curve
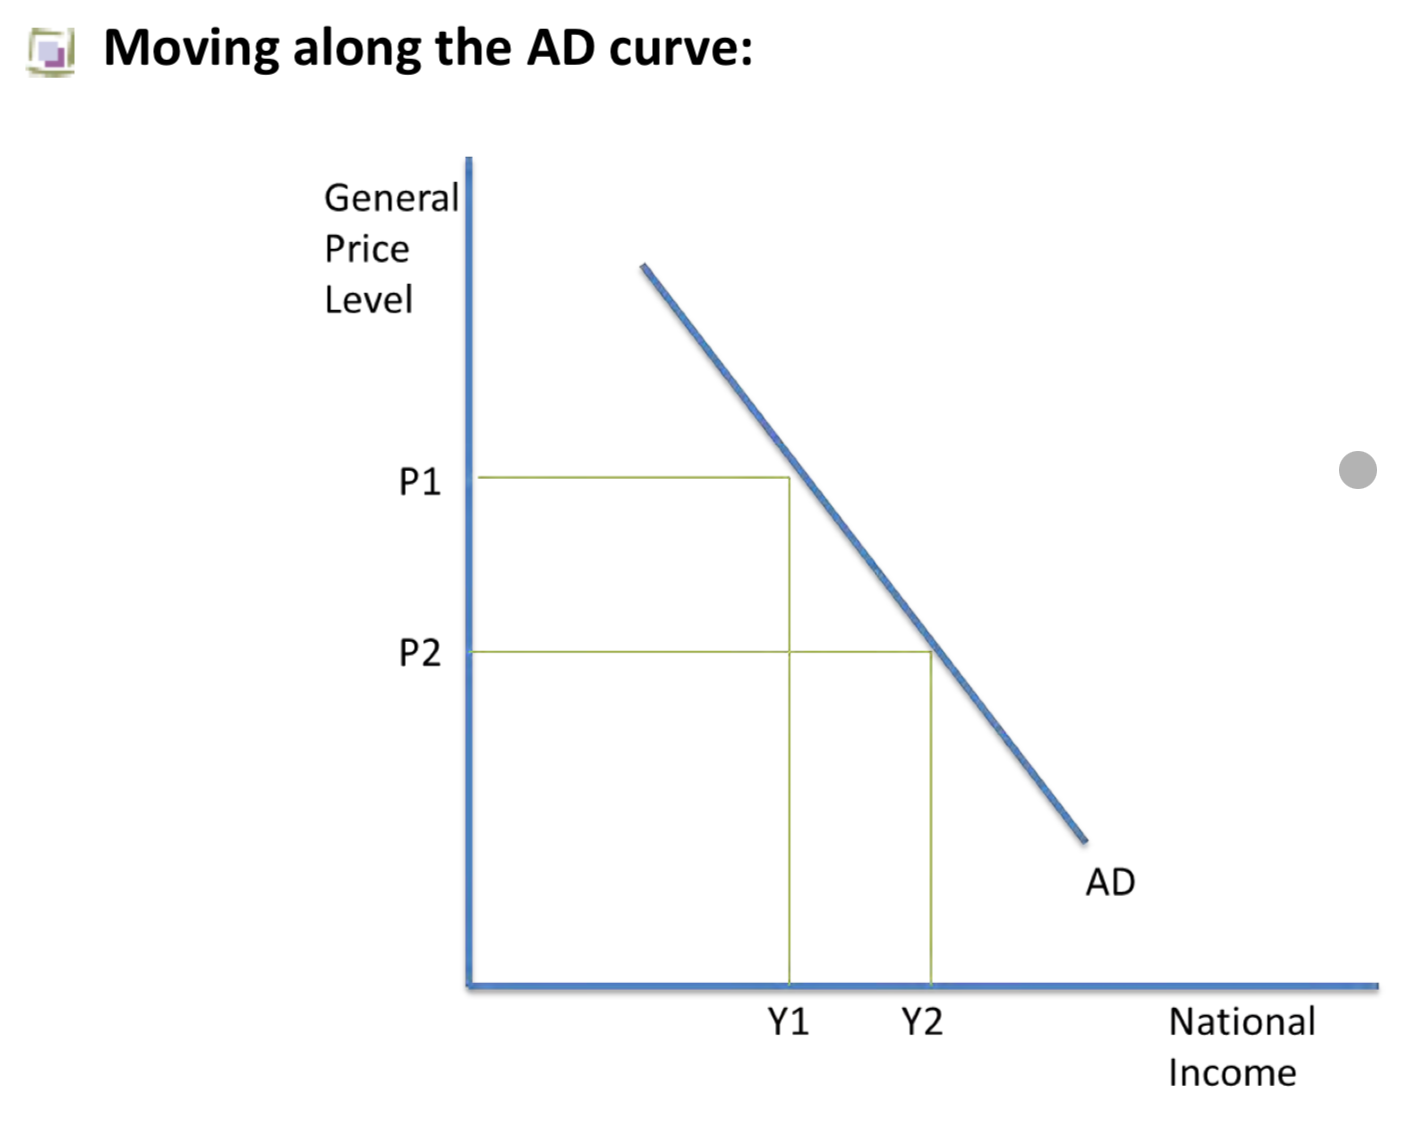
A fall in the price level from P1 to P2 causes an expansion in demand from Y1 to Y2
A rise in the price level from P2 to P1 causes a contraction in demand from Y2 to Y1
Downward slope of the AD curve can be explained by
Higher prices lead to a fall in the value of real incomes so goods and services become less affordable in real term.
If there was high inflation in the UK so that the average price level was high, foreign goods would seen relatively cheaper. Therefore, there would be more imports so the deficit on the current account might increase and AD would fall.
High inflation generally means higher interest rates which discourages spending since saving becomes more attractive and borrowing becomes expensive
Shifting the AD curve
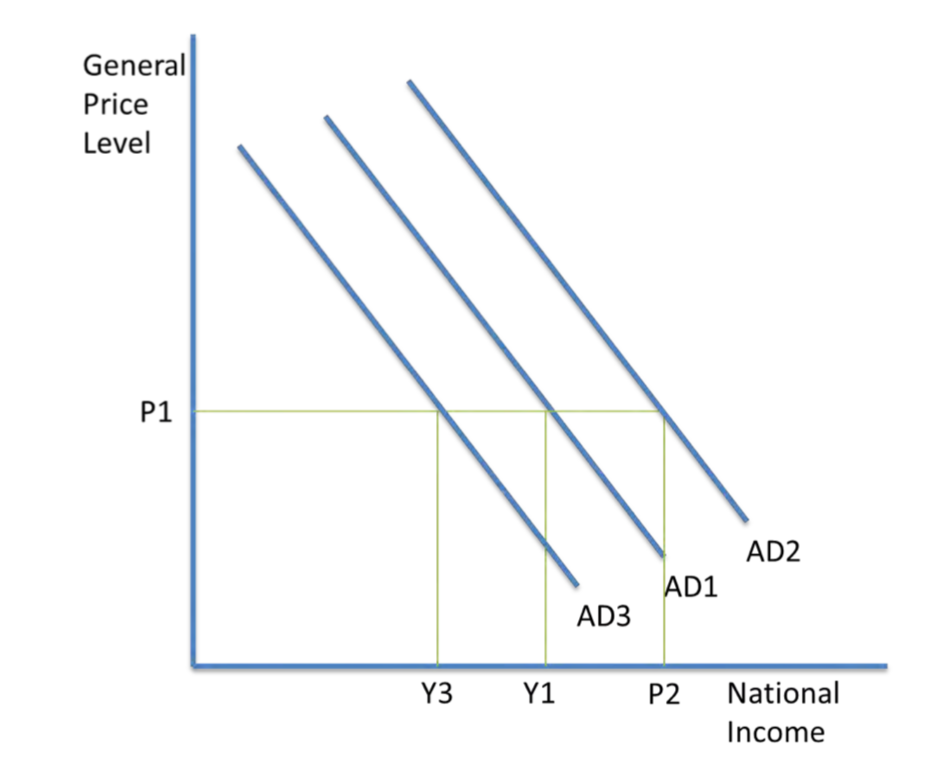
A rise in AD is shown by a shift to the right in the demand curve (AD1-AD2). The rise in economic growth occurs when any of the components of AD increase.
The distinction between a movement along and a shift of the AD curve
Changes in price level cause movements along the demand curve
Whereas the AD curve is shifted by changes in the components of AD (C,I, G or X-M)