W1 L3 Variable Features, Scales, Variance, and Measurement Quality
Variable Scales & Core Definitions
A variable (a.k.a. factor) is any attribute that varies across participants/observations.
Defining property: possesses at least two values that can differ from person to person or situation to situation.
Four classic scales of measurement determine how those values are represented and interpreted.
1. Nominal Scale
Values are names / categories only—labels are arbitrary.
Example coding of “Country of Birth”: …
Numerical difference (e.g.
) is meaningless; numbers simply stand for categories.
Data type: typically categorical / integer codes.
2. Ordinal Scale
Has identity + magnitude (order).
Values indicate rank; intervals are not guaranteed equal.
Example: 7-point Sleep Quality rating.
“5/7” signifies better sleep than “3/7”, yet the gap doesn’t necessarily equal the subjective difference between “4” and “2”.
Use when order matters but precise distance does not.
3. Interval Scale
Possesses identity, magnitude, equal intervals.
Differences of unit are the same anywhere along the scale.
Can include negative values because zero is arbitrary, not absolute.
Classic example: temperature (°C)— is the same change as .
Mathematical operations of addition/subtraction are meaningful; ratios are not (because is not true absence).
4. Ratio Scale
Includes all four features: identity, magnitude, equal intervals, absolute zero.
Zero denotes true absence of the quantity.
Example: height (cm).
In botanical context, a seedling can truly be cm tall at germination.
Allows full range of arithmetic: ⇒ twice as tall.
Four Fundamental Features of Variables
Identity – each value has a unique meaning.
Magnitude – values are ordered from lesser to greater.
Equal Intervals – distance between successive units is constant.
Absolute Zero – a value of indicates none of the attribute.
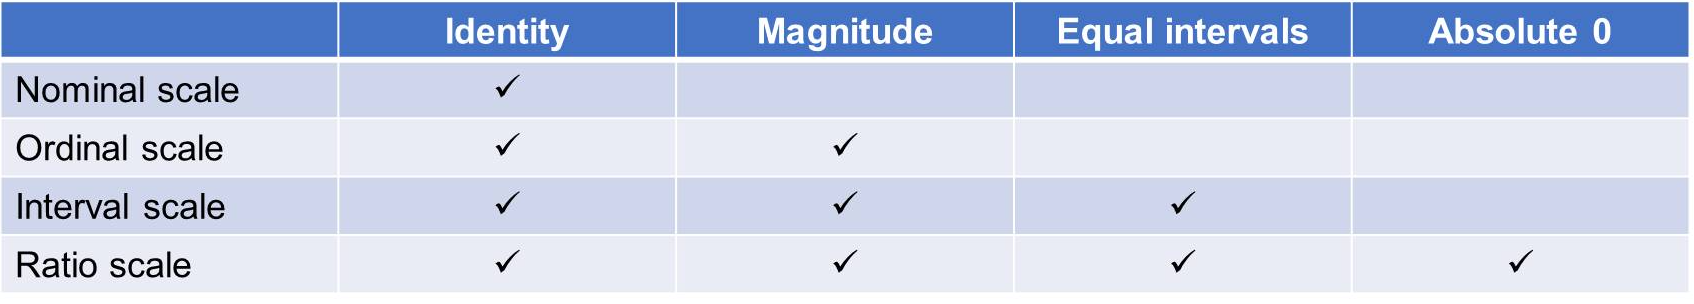
Feature Matrix (Conceptual)
Nominal: Identity only.
Ordinal: Identity + Magnitude.
Interval: Identity + Magnitude + Equal Intervals.
Ratio: Identity + Magnitude + Equal Intervals + Absolute Zero.
Linking Scales to Real-World Examples & Data Types
Height – Ratio; continuous real numbers.
Country of Birth – Nominal; categorical integer codes.
Sleep Quality (1–7) – Ordinal; categorical/integers.
Academic Performance (0 = Not Meeting, 1 = Meeting) – Ordinal binary; categorical integers.
Variability & Variance in a Mini Data Set
Table with 7 fictitious people recorded on the four variables.
Each column header (Height, Country, Sleep Quality, Academic Performance) is a variable.
Each row is one participant’s data.
Variance captures how individual scores differ from one another within a variable.
If every participant had identical height, variance for height , but that would contradict the very idea of it being a variable.
Terminology:
Variability – general concept of differences.
Variance – specific statistical quantification of variability.
Measuring Psychological Constructs
Psychology often targets latent constructs not directly observable (intelligence, anxiety, optimism, cognition).
Cannot be “measured with a ruler.”
Necessitates carefully designed instruments, surveys, or tasks.
Quality of a Measure
Reliability (Consistency)
Produces similar results under consistent conditions.
Low random error → low scatter around true value.
Validity (Truthfulness)
Actually measures the intended construct, not something else.
“Hits the bull’s-eye.”
Dartboard Illustration (Metaphor)
A. Reliable & Valid – tight grouping around bull’s-eye.
B. Unreliable & Valid – scattered but centered.
C. Reliable & Invalid – tight cluster in wrong quadrant.
D. Unreliable & Invalid – wide scatter, off target.
Ultimate goal: high reliability + high validity.
“Our data are only as good as the measures we use.”
Course Connections & Future Relevance
Concepts of scales, features, variance, reliability & validity underpin later topics in statistics, experimental design, and psychometrics.
Understanding data types informs choice of statistical tests (e.g., chi-square for nominal, t-test/ANOVA for interval/ratio).
Reliability & validity will reappear in courses on test construction, clinical assessment, and survey design.
Key Takeaways
There are four measurement scales, each adding an extra feature over the previous.
Identity, magnitude, equal intervals, absolute zero define how numbers map onto reality.
Variance is inevitable and essential—without it variables would not vary.
Psychological measurement demands attending to reliability and validity; mastering these concepts is critical for sound research.