3. Risk factors and diagnosis
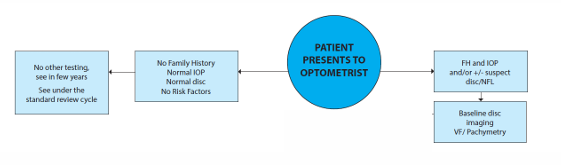
Diagnosing glaucoma: Key factors during eye examinations
Patient risk factors: age, race, refractive error, systemic disease
Anterior chamber angle (ACA)
IOP (and central corneal thickness [CCT])
Optic nerve head (ONH) appearance
Retinal nerve fibre layer (RNFL)
Visual field (VF)
Interocular symmetry: IOP, ONH, VF
Changes over time
Marriage between ONH and VF (correlation of structure and function)
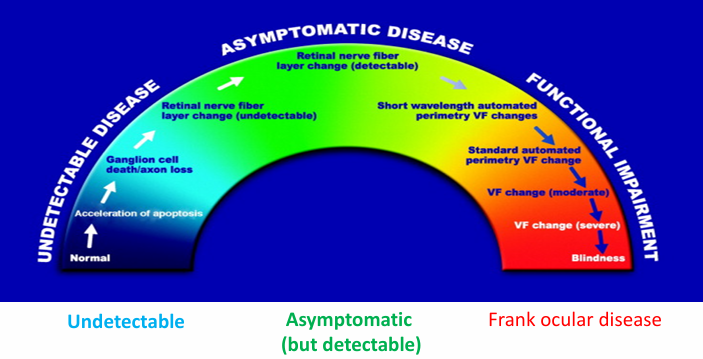
Glaucoma progression as a continuum
Glaucoma progression described as a continuum from asymptomatic to symptomatic, with detectable structural changes preceding functional loss and potential progression to blindness
Stages and relationships:
ASYMPTOMATIC DISEASE with detectable RNFL change
UNDETECTABLE DISEASE with neuronal apoptosis but undetectable RNFL change
Retinal nerve fiber layer change (undetectable) before VF changes
Short wavelength automated perimetry indicates VF changes before standard automated VF tests
Functional impairment progresses from detectable VF changes to moderate and severe VF loss
Final stage: Blindness
Epidemiological factors
Age:
POAG is age-related with increasing incidence after 60
Race:
Higher POAG prevalence in black Americans
Lower POAG prevalence in Asians (though higher prevalence of ACG in Asians)
Family history:
first-degree relatives confer markedly higher risk (up to 4–10× greater likelihood
2× if a parent
4× if a sibling
Systemic disease
Diabetes and systemic hypertension are important conditions to consider
Diabetics or hypertensives with untreated or uncontrolled glaucoma exhibit ONH damage sooner and faster
Glaucoma occurs more frequently in diabetics than in non-diabetics (possible ischemic contribution)
Other factors
Refractive status:
Myopia increases risk for POAG
Hyperopia increases risk for PACG
Medication use:
Topical steroids
Topical decongestants (slight risk of mydriasis and PACG in susceptible individuals)
History of eye trauma or surgery
Cataract surgery status: aphakia or pseudophakia
especially in young patients (congenital)
What raises suspicion?
Positive family history
Disc appearance:
cup-to-disc ratio (CD) ≥ 0.7
CD asymmetry ≥ 0.2
IOP characteristics:
raised IOP (> 22 mmHg)
IOP asymmetry > 5 mmHg
diurnal variation > 6 mmHg
Anterior chamber angle status: shallow angle (Van Herick grading)
Reduced central corneal thickness (CCT)
Clinical workup
Case history
Refraction and best corrected visual acuity
Optic nerve head appearance: stereoscopic view; photography for documentation over time
RNFL assessment: red-free filters (ophthalmoscopy, photography, OCT, etc.)
IOP assessment: serial/phase tensions (diurnal sampling if possible)
Computerised perimetry (threshold visual fields)
Pachymetry (CCT)
Anterior chamber/corneal assessment plus gonioscopy
Always correlate visual fields with disc and RNFL appearance
Intraocular pressure (IOP)
Mean IOP in adult population:
Upper limit of “normal”:
Many glaucoma patients have IOP < 21 mmHg
Framingham study: of glaucoma patients have IOP < 21 mmHg on a single reading
IOP – diurnal variations
IOP typically highest in the morning (around 6–7 AM) and lowest in the late evening (around 6–7 PM)
Average diurnal variation:
Ocular hypertensives: diurnal variation around
POAG: higher diurnal curve, range
Low-tension or normotensive glaucomas may also have IOP spikes
Suspicion if: IOP asymmetry > or diurnal variation >
Always note time of day and instrument used when measuring IOP
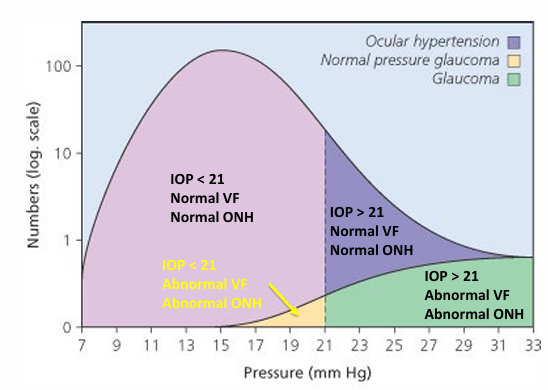
IOP and VF/ONH correlations (simplified)
IOP < 21 with Normal VF and Normal ONH
IOP > 21 with Normal VF and Normal ONH
IOP > 21 with Abnormal VF and Abnormal ONH
IOP < 21 with Abnormal VF and Abnormal ONH
Corrections for CCT and IOP
Thicker than average cornea = overestimate of IOP
Thinner than average cornea = underestimate of IOP
IOP correction factor for CCT: 0.5 mmHg per 10 µm
No correction factors have been validated
New tonometric techniques thought to give more accurate IOP reading closer to the true IOP (based on internal algorithms/design).
Central corneal thickness (CCT) and glaucoma
A thinner CCT is a risk factor for the development of glaucoma
In POAG: thinner CCT associated with larger CD ratio and more advanced visual field loss
Reasons for association:
Delayed diagnosis due to IOP underestimation with applanation tonometry in thin corneas
Potential intrinsic susceptibility: thinner CCT may reflect thinner lamina cribrosa (limited evidence)
Studies of “normal” healthy eyes (baseline references)
Framingham study: average CD ratio
Jonas (1988, n=475 normals): horizontal (H) ; vertical (V)
Direct ophthalmoscopy: average CD ≈
Stereoscopic view: average CD ≈
Prevalence in normal populations:
86% have CD ratio < 0.4
7% have CD ratios ≥ 0.5
CD asymmetry > 0.2 present in only ~6% of normals
Conclusion: “Normal” ONH definitions rely on cup-to-disc metrics and symmetry thresholds
When to get suspicious?
General rule: CD ≥ or CD asymmetry ≥ warrants closer evaluation
A funny-looking disc or asymmetric CD/disc appearance warrants VF, OCT, and IOP monitoring
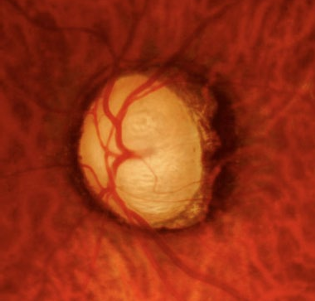
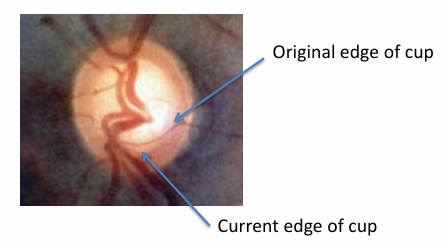
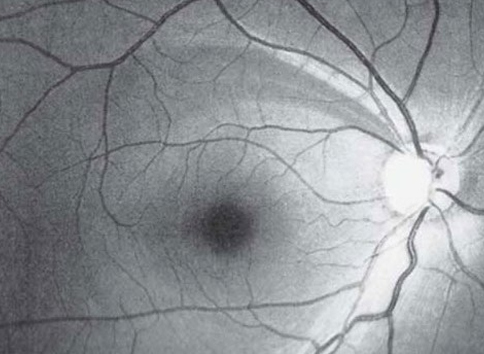
Pathological optic nerve head changes
Evidence of neural rim thinning and cell loss
Cupping patterns:
Concentric enlargement: cup enlarges in all directions
Focal enlargement (polar notch): cup elongated vertically compared to disc; inferior-temporal notching (avocado sign)
Laminar dot sign: lamina cribrosa becomes spotty and visible
Bean pot cup: end-stage with deep excavation and almost no neural rim left
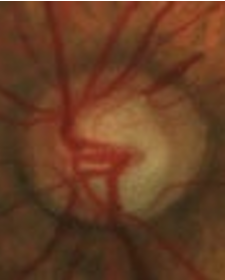
Progression of glaucomatous cupping (illustrative sequence)
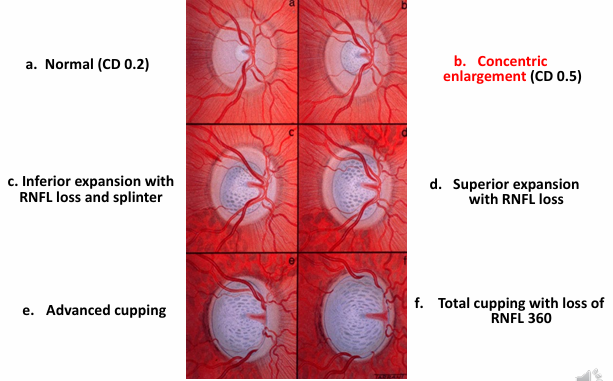
Focal enlargement (polar notch): cup is more vertically elongated than the disc, infero-temporal notching (avocado sign)
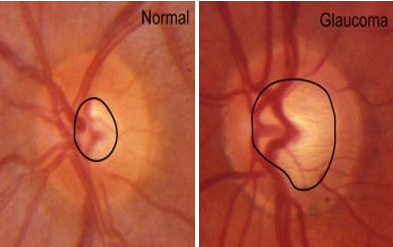
ISNT rule and neural rim tissue configuration
ISNT: Inferior – Superior – Nasal – Temporal
In glaucoma, rim tissue is often lost from inferior or superior poles
Result: nasal or temporal rims appear thicker than inferior or superior rims
Some healthy eyes do not follow ISNT; some glaucoma eyes do follow ISNT
End stage cupping
Cupped-out optic nerve head appearance in advanced disease
Pathological optic nerve head changes – vascular aspects
Disc pallor: neural rim tissue appears greyish; reduced capillaries
Baring of circumlinear vessels: vessels follow cup edge and are left behind as the cup enlarges
Splinter/Drance/Flame haemorrhages: within or at 1 disc diameter (1 DD) of the disc; common near the disc
Peripapillary atrophy: halo of pale retina around disc; RPE atrophy due to vascular deficiency
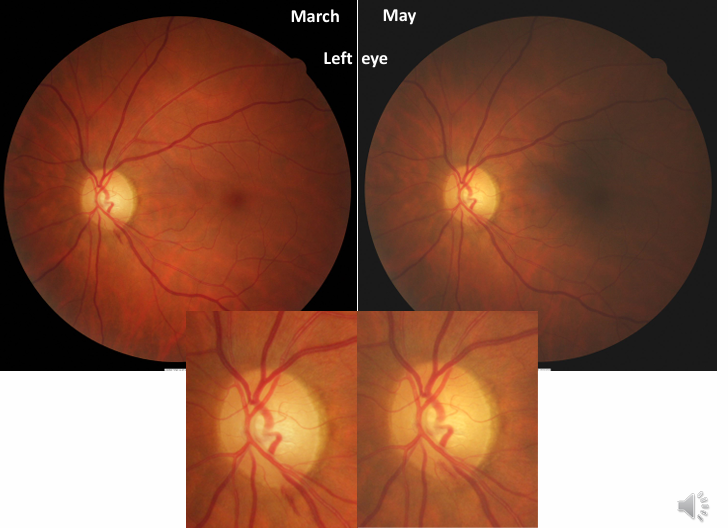
Optic disc haemorrhage (Drance/splinter haemorrhage)
Small flame-shaped haemorrhage, usually superficial NFL
Located on or adjacent to the disc (within 1 DD); most commonly inferotemporally
Resolves in 1–3 months; recurrences are common
More frequent in normotensives than in high-tension glaucoma
Indicator of early or progressive nerve damage, especially if recurrent
May precede ONH or VF defects
Easily missed; a deliberate search improves detection
Glaucoma patients with Drance haemorrhage are ~4× more likely to have VF progression than those without
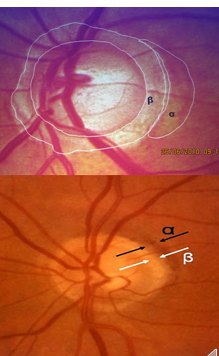
Peripapillary atrophy and zones
Peripapillary atrophy: halo of pale retina surrounding disc; RPE atrophy due to vascular deficiency
Beta zone atrophy: RPE loss with choriocapillaris loss (more common in glaucoma)
Alpha zone atrophy: pigmentation changes (more common in normal eyes)
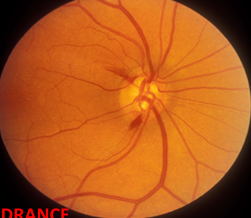
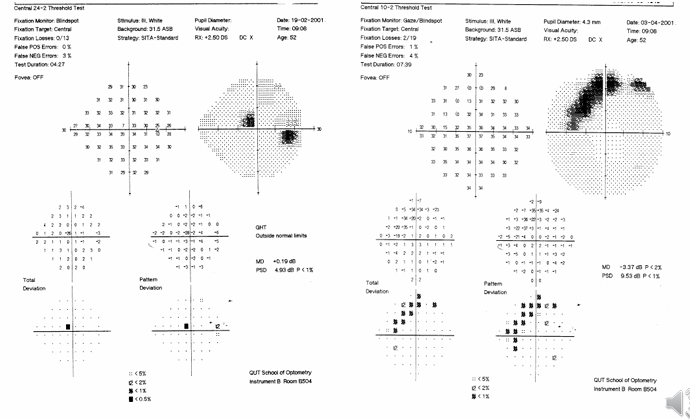
Visual fields in glaucoma
Within normal limits vs. severe glaucomatous loss
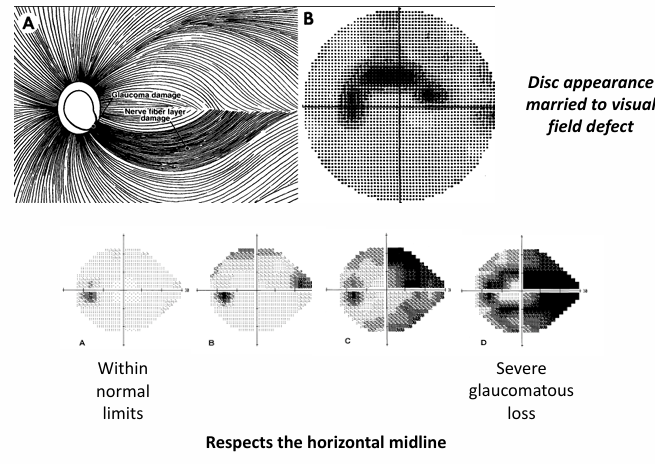
Disc appearance married to visual field defect: structure–function relationship
Glaucomatous defects (types and testing)
Earliest defects: generalized depression and nerve fibre bundle defects
Paracentral island scotomas: small, isolated, 5–15° from fixation; higher incidence in the superior field
Relative (reduction in sensitivity) or absolute (total loss of sensitivity) scotomas along the course of the arcuate nerve fibre path
Arcuate scotoma (Bjerrum scotoma): islands scotomas enlarge/coalesce along nerve fibre paths
respects the horizontal midline
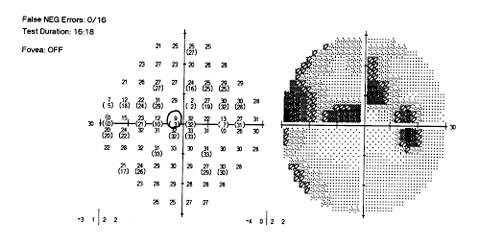
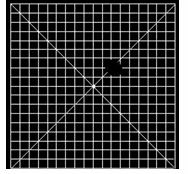
Nasal step: sensitivity difference across horizontal raphe; may be central or peripheral; often with island scotomas
may take form of a depression or scotoma
may occur in isolation
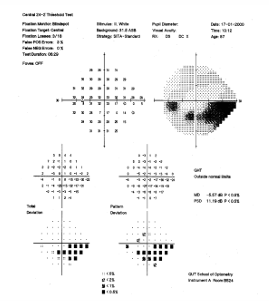
Visual field testing in glaucoma (automated perimetry): designed to detect these defects; consider the Glaucoma Hemifield Test (GHT)
Emphasis on respect of horizontal midline; focal arcuate patterns are common
Paracentral island scotomas
Located along arcuate fibre paths; 5–15° from fixation
Predominantly found in the superior field in studies
Arcuate scotoma (Bjerrum pattern)
Island scotomas may enlarge and coalesce into an arcuate pattern following the fibre pathways
Nasal step
A sensitivity difference across the horizontal raphe; can appear as a depression or scotoma
May occur within central isopters (about 30°) or more peripherally
Often associated with island scotomas
Consider 10-2 VF in early and late stage; Central 24-2 Threshold Test
Mimic glaucoma VF loss (different etiologies that can resemble glaucoma VF loss)
Arcuate NFL bundle loss can be mimicked by:
Optic disc pit
Optic nerve head drusen
Optic nerve coloboma
Branch retinal vascular occlusions
Normal vs damaged optic nerve head (DIFFERENTIATORS)
ONH coloboma example: structural anomaly that can affect interpretation of RNFL and VF
Retinal nerve fibre layer defects (RNFL)
RNFL defects are among the earliest signs of glaucomatous damage in POAG
RNFL loss can precede VF loss and ONH damage
Normal RNFL appearance features:
fine white striations in the anterior retina
white haze over underlying areas
brighter closer to the ONH
RNFL thickness maps and deviation maps
RNFL Thickness Map and RNFL Thickness Deviation maps are used to visualize thinning relative to normative data
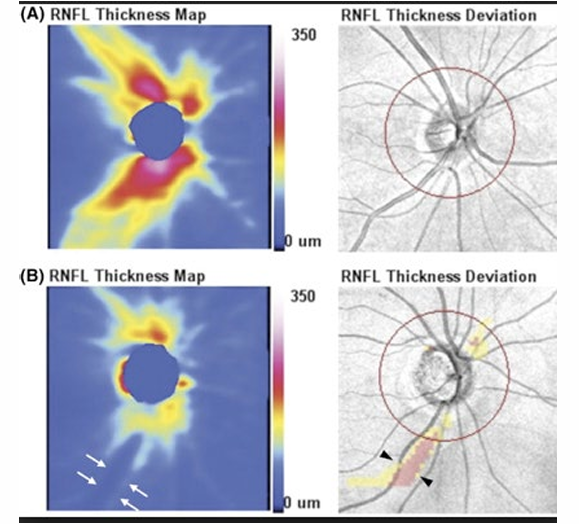
Detecting glaucoma before development of VF defect
35% of eyes had abnormal average RNFL thickness 4 years before development of visual field loss
19% of eyes had abnormal results 8 years before field loss
Clinical take-home messages
Evaluate ONH cupping and search for neural tissue loss and disc haemorrhages
Always search for RNFL defects in patients suspected of having glaucoma
Use dilated, stereoscopic observation for a thorough ONH assessment
Measure IOP in everyone (when possible)
Maintain a high degree of suspicion: symmetry of IOP, discs, and VF between eyes
RANZCO pathway for glaucoma management
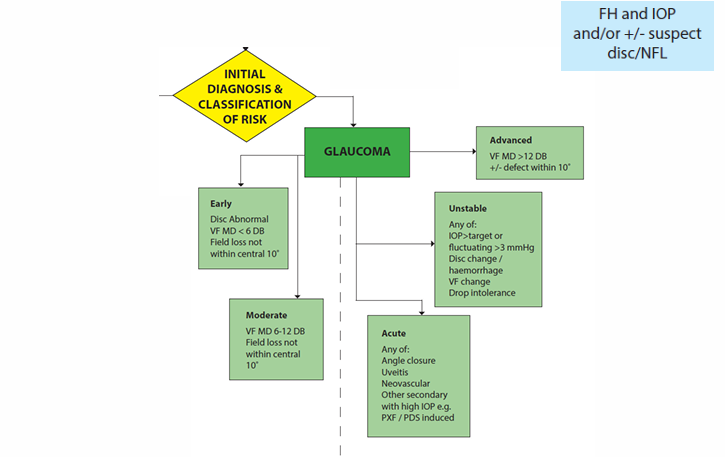
Initial diagnosis and risk classification (RANZCO framework)
Early disc abnormality with some VF MD < 6 dB indicates Early glaucoma risk
Moderate glaucoma: VF MD 6–12 dB with field loss not within central 10°
Advanced glaucoma: VF MD > 12 dB with potential central involvement
Unstable: IOP not within target or fluctuating > 3 mmHg; disc changes/haemorrhage; VF changes; intolerance to treatment
Acute: angle-closure, uveitis, neovascular, or secondary glaucoma with high IOP (e.g., PXF/PDS-induced)
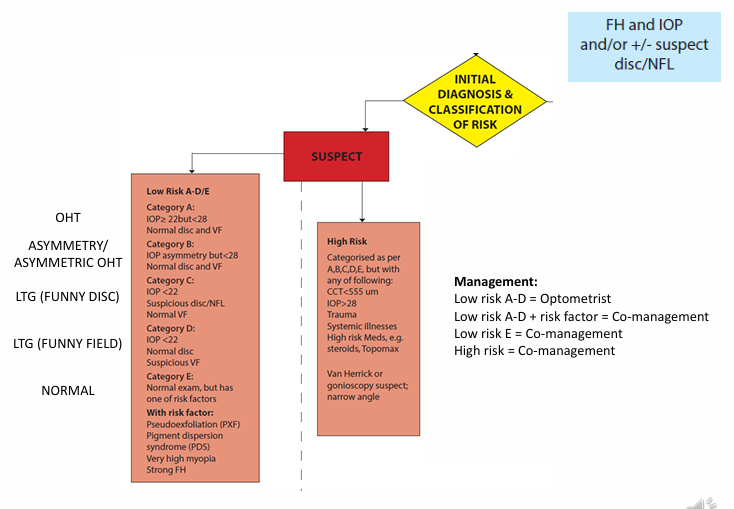
OHT asymmetry/asymmetric OHT and NICE management framework (OHT/Asymmetric OHT vs LTG vs normal)
Asymmetric OHT (funny disc) and LTG vs Normal:
Management strategies depend on risk assessment
Low risk: A–D management by Optometrist
Low risk with risk factor: Co-management
Low risk with E category (e.g., additional risk factors): Co-management
High risk: Co-management (referral and closer follow-up)
The pathway emphasizes collaboration between ophthalmologists and optometrists for timely diagnosis and management of glaucoma and suspects