psyc011 week 1
chapter 1
part 1
famous statisticians
karl pearson - chi square to decide among theories
ronald fisher - experiments w random assignment
jerzy neyman & egon pearson - NHST
jacob cohen - effect sizes & power
geoff cumming - the “new” stats
john kruschke - bayesian stats
field of stats is a human endeavor designed to help people develop reasoned beliefs about variable processes
descriptive statistics - number that conveys a particular characteristic of a set of data
ex) mean - arithmetic average; sum of scores divided by number of scores
inferential statistics - method that uses sample evidence and probability to reach conclusions about unmeasurable populations
AKA smaller size of population too big
null hypothesis statistical testing (NHST) - technique producing probabilities accurate when the null hypothesis is true and certain assumptions are met
part 2
population - all measurements of a specified group
sample - measurements of a subset of a population
parameter - numerical or nominal characteristic of a population
statistic - numerical or nominal characteristic of a sample
variable - something that exists in more than one amount or in more than one form
quantitative variable - variable whose scores indicate different amounts
continuous variable - a quantitative variable whose scores indicate different amounts
note** these can identified by being able to have half numbers (ex. you can have a 9.5 shoe size or get somewhere in 1.5 hours)
discrete variable - variable for which intermediate values between scores are not meaningful
note** these can be identified by not being able to have a half number (ex. you cant have half a student in a class)
categorical variables - variable whose scores differ in kind, not amount
ex) race, religion, college major
part 3
scales of measurement
nominal scale - measurement scale in which numbers serve only as labels and do not indicate quantitative relationship
ex) yes/no responses, colors (blue, green, red)
ordinal scale - measurement scale in which numbers are ranks; equal differences between numbers do not represent equal differences between the things measured
ex) bachelor’s, master’s, PhD
interval scale - measurement scale with meaningful intervals but no true zero point
ex) zero in celsius vs fahrehnheit
ratio scale - measurement scale with meaningful intervals and a true zero point
height, weight, age
experimental design
independent variable - variable controlled by the researcher
dependent variable - observed variable that is expected to change
level - one value of the of the independent variable
treatment - one value/level of the independent variable
its basically like the most extreme level
extraneous variable - variable other than the independent variable that may affect the dependent variable
Epistemology - study or theory of nature of knowledge
epistemology aims to answer
what do we know
what does it mean to say that we know something
what makes justified beliefs justified
how do we know that we know
steps to statistical analysis
1) explore data
2) answer the question - what are the effects that chance could have on the descriptive stats I calculated?
3) write the story explaining the relationships in the data
chapter 2
part 1
simple frequency distribution
1) find lowest and highest scores
2) in columns, write all numbers from greatest to least
3) name the column
4) start w number in upper left, draw line under it, tally mark beside number in column
5) continue underlining and tall
computational tools
R, MATLAB, Excel or sheets, python, SAS, SPAA, etc
in this class, jamovi (free, based on R, similar to SPSS)
part 2
symmetric distributions
normal distribution (normal curve) - graph of observed scores with particular shape
rectangular distribution - occurs when frequency of each value on x-axis is the same
asymmetric distributions
skewed distribution - could be + or -
positive skew - graph with high amount of low scores
graph stretched most on left side
negative skew - graph with high amount of high scores
graph stretched most on right side
bimodal distribution - distribution with two modes (2 high points)
line graph - graph that uses lines to show relationship between 2 variables
chapter 3
part 1
central tendency - descriptive statistics that indicate a typical or representative score
mean - arithmetic average; sum of scores divided by number of scores
median - point that divides a distribution of scores into equal halves
mode - score that occurs most frequently in a distribution
weighted mean - overall mean calculated from two or more samples with different Ns
part 2
median - point that divides distribution of scores into two equal parts
finding median:
order scores greatest to least
median itself should have equal number of scores above and below it
if odd # of scores, median in the middle
if even, median halfway between middle 2 (add both scores and divide by 2)
mode - most frequently occurring score; score observed most often
scale of measurement
interval or ratio - mean, median, mode
ordinal - median or mode
nominal - mode only
skewed data
if data very skewed, median may be better than mean
EX) income - mean $83K, median $59K
open-ended class intervals
ex) “75 and over” or “$200K or more”
estimating answers
estimating helps you think the problem through
estimates help you catch errors when compared to computer output
catching errors increases your credibility
chapter 4
part 1
variability - having a range of values
think of it as differences
to summarize group of numbers
1) how big or small or the numbers?
2) are the numbers mostly close to each other or far apart?
range - highest minus lowest score
not very informative because only two scores matter in its computation
drastically different distributions can give rise to same mean and range
interquartile range - the middle 50% of the observations
used to avoid instability of the range statistic
just trimmed off top and bottom 25% of data
to find interquartile range, must find 25th and 75th percentile
percentile - point below which a specified percentage of distribution falls
part 2
standard deviation - descriptive measure of the dispersion of scores around the mean
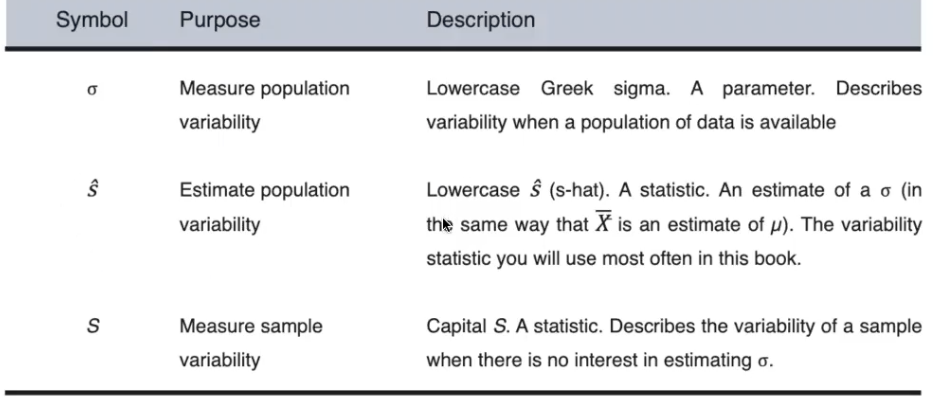
deviation score - raw score minus the mean of its distribution
just says how far a score is from mean
part 3
use definitional formula being given in class, not raw formula from computer
graph standard deviation using error bars but clarify range
chapter 5
part 1
z score - score expressed in standard deviation units
they are comparative, dependent on all other scores
as descriptive stat, vary from -3 to +3
standard score - score expressed in standard deviation units; z is one example
ex) IQ scores, z scores,
part 2
outlier - extreme score separated from others and at least 1.5 * IQR beyond the 25th or 75th percentile
elements of boxplot
boxplot - graph that shows a distribution’s range, IQR, skew, median, and sometimes others
median - line in middle of box
mean - dot in box
25th percentile - bottom or left side of box
75th percentile - top or right side of box
whiskers - extend to lowest and highest scores in distribution
central tendency - mean or median
variability
IQR - size of box
distance between end of whiskers
skew
position of mean relative to median
relative length of the whiskers
effect size index - amount of degree or separation between two distributions
use whatever units make most sense
when scale is unfamiliar, use standard statistic “d”
descriptive statistics report
table showing mean, median, percentiles, effect size, etc