Sampling and Sampling Distribution
Sampling and External Validity
External validity
is the extent to which results can be generalized
can be across individuals, or across methods and settings
Population
the accessible population is a smaller part of the sample
Sampling
can have an impact on how valid the data is, is it representative, can it be generalized, how and why?
You want to get a result that can be inferred to the population from the smaller number of respondents
the larger the sampling size, the more accurate the population estimate
the sample does not need to be a certain percentage of the population
there are mathematical formulas to determine adequate sample size (e.g. power analysis)
Sampling Error, Sampling Bias, and Sampling Representativeness
sampling error
is the difference between the statistic used to estimate the population parameter, and the parameter’s actual value
larger samples are more likely to yield data that accurately reflects the true population value
Sampling Bias
occurs when some members of a population have a greater chance of being selected than other members of the population
can dramatically increase sample error in a systematic way
causes misleading results by over-representing one groups; opinion and under-representing another group’s opinion
Haphazard Sampling
There are more of one characteristic, e.g. more higher income, more people from a demographic, etc. within the population, so the samples end sup being much more of one demographic.
Types of Probability Sampling
is actually pretty rare in HDFS research
population info is available BEFORE participants are picked
Simple Random sampling
Done with a random table or a computer randomization (e.g. using excel)
systematic random
picking up every nth subject (every 4th and 9th)
sensitive to the way the list is order
stratified random
Guarantees that the proportion of the population is the same as the sample
divide the population into stratum (can make it tow here it matches the
strata should be homogenous within and heterogenous between one another
e.g. dividing into
cluster
sample a ready-made group within the population, assuming it has a similar composition to the populations
clusters must be heterogeneous within (has a diff exact variation within it) and homogenous between one another (all have 3 blue marbles, and 2 green marbles)
Types of Non-Probability Sampling
population info is not available
chance of people included is unknown and unequal
convenience
get any available people in the population (
can have low representativeness/generalizability (i.e., external validity)
purposive (judgemental)
Obtain subjects who are believed to meet a predetermined criterion
e.g. only young adults entering a theatre to watch popular movies
Also has low representativeness and generalizability
Quality of sampling depends on researchers ability to make judgements on the qualifications of participants
quota
Predetermine the proportion or number of groups in the sample (50% male, 50% female or 30 males and 30 females)
used when you want to ensure the sample reflects the proportion of the group in the populations (e.g. TXST is 11% AA, 70% White/European American, etc.)
Also used to secure enough number of group members for analysis (e.g. if the amt of children w/ gay parents is very small, or amount of fraternal twins) (can sometimes be called over-sampling to make sure you get enough)
in this case, wouldn’t be representative of the whole population, since you purposely picking out and targeting one demographic
snowball
used to locate hidden, hard to reach populations
drug addicted individuals, married straight individuals that actually consider themselves gay, gang-affiliated members, sex-workers, etc.
You obtain your subjects through a chain of personal networks
Inferential Statistics
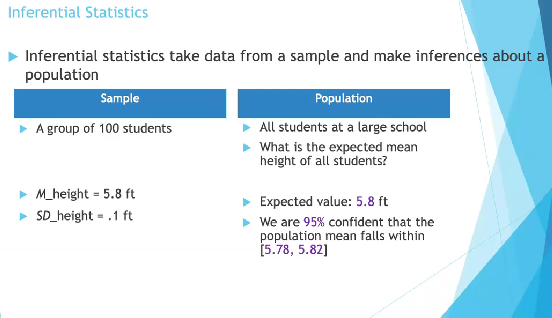
take data from a sample and make inferences about the population parameters
are the statistics of the population parameters (e.g. mean, median, ANOVA score, etc.
We can repeat the study several times in order to determine this, and represent it like this:
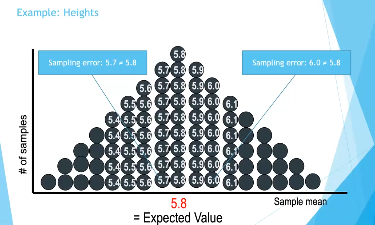
This is a sampling distribution (a combo of several samples, not just one sample, which is just a sample distribution)
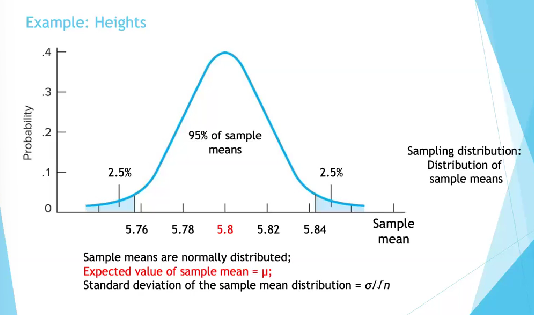
margin of error is significantly smaller as the sample grows larger
as we take
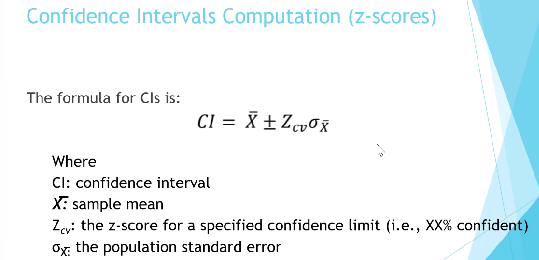
we give them a significance levels, which give them a margin of error. we then put that value (rep. by alpha) into this equation to make it a confidence level:
(1-a)*100)

Central Limit Theorem
if the population distribution is normal, the sampling distribution of mean will also be normal
If its not normal, the sample will still become more and more normal as the sample size increases

When a sample has more than 30 participants, the more normal it will be. This is better, and is represented well in the sampling distribution
SD of the sampling distrib, is called the standard error or standard sampling error
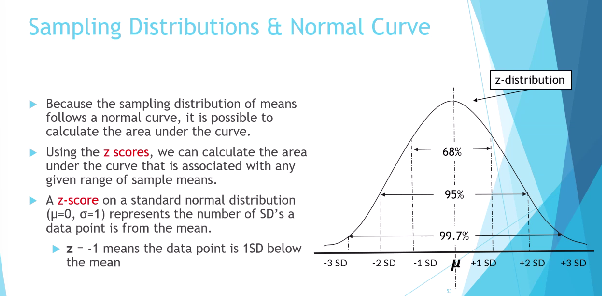
We can calculate where a value is on the normal curve based on the z-scores
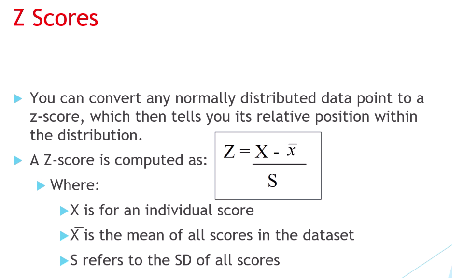
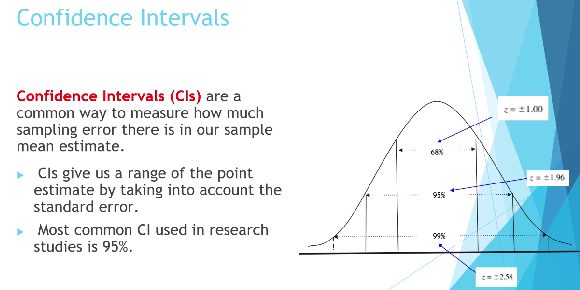
for 95%, your z-score must be plus or minus 1.96

Class Notes
Variance is the exact sum of the squared values of the deviations of all other values
it is the arithmetic average of the deviation
Standard deviation is a standardized value of how much is left over when the avg deviation is taken away
Coefficient of variation (CV) = SD/M is sometimes useful to make more use of variance
when the value is less than 10% low relative variability; when it is greater than 30% is high relative variability
however, this does not always work
Visualization Lab
each band in a histogram is usually 1.
however, you can customize it through the chart editor
Box Plot Commands
analyze
explore
Add desired variables into the Dependent List
Click plots (make sure nothing but factor levels together in box plots is clicked, everything else should not be clicked)
IQR tells us the range of where people are clustered the most
It is a better measure of range than the actual range, actually, a lot of times
The values you see outside of the minimum shows the real minimum
the line for minimum shows us the minimum excluding those extreme outliers
“5% Trimmed mean”
this shows us the mean with the (top and bottom 5% excluded to try to show what it is without the outliers)