Forest Plots
Taes all the relevant studies asking the same question, identifies a common statistic in said papers and displays them on a single set of axis.
- You can directly compare the studies and the quality of that result in one place.
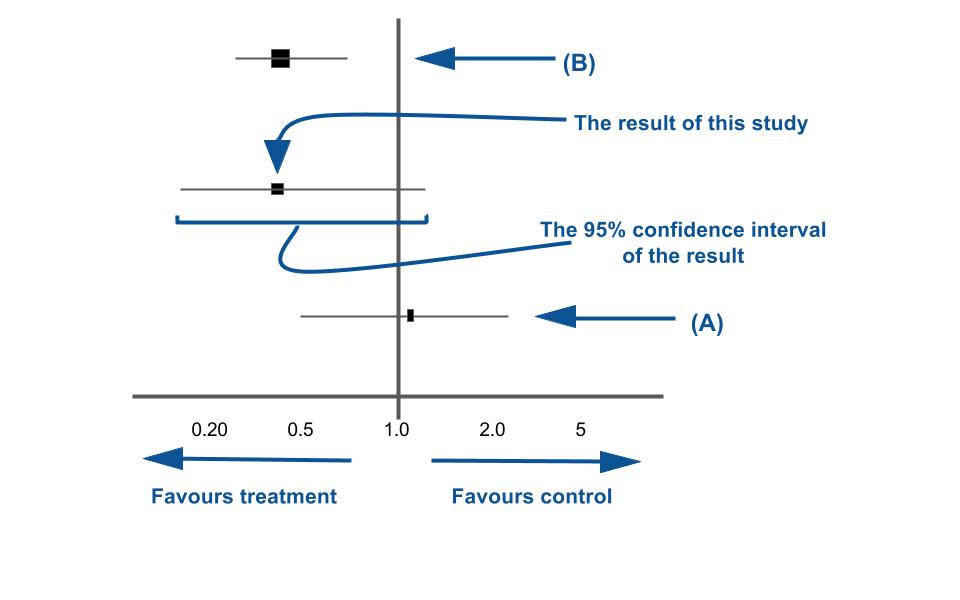
The centre line is the line of null effect (neither is favoured)
OR and RR have a null effect value of 1.
AR has a null effect value of 0.
If the confidence interval crosses the null effect line, it means the null value lies within it and hence could be the true value - so it is not a statistically significant result
The bigger the study, the smaller the confidence interval and the bigger the black box representing the point estimate - meaning they are less likely to cross the null effect line.
The diamond box at the bottom shows the result when all the studies are combined together and averaged.
If the value is >50% it might mean the studies are inconsistent due to other reasons other than chance.
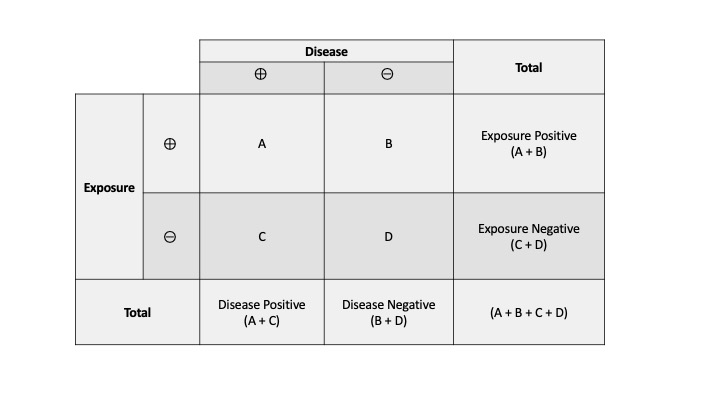
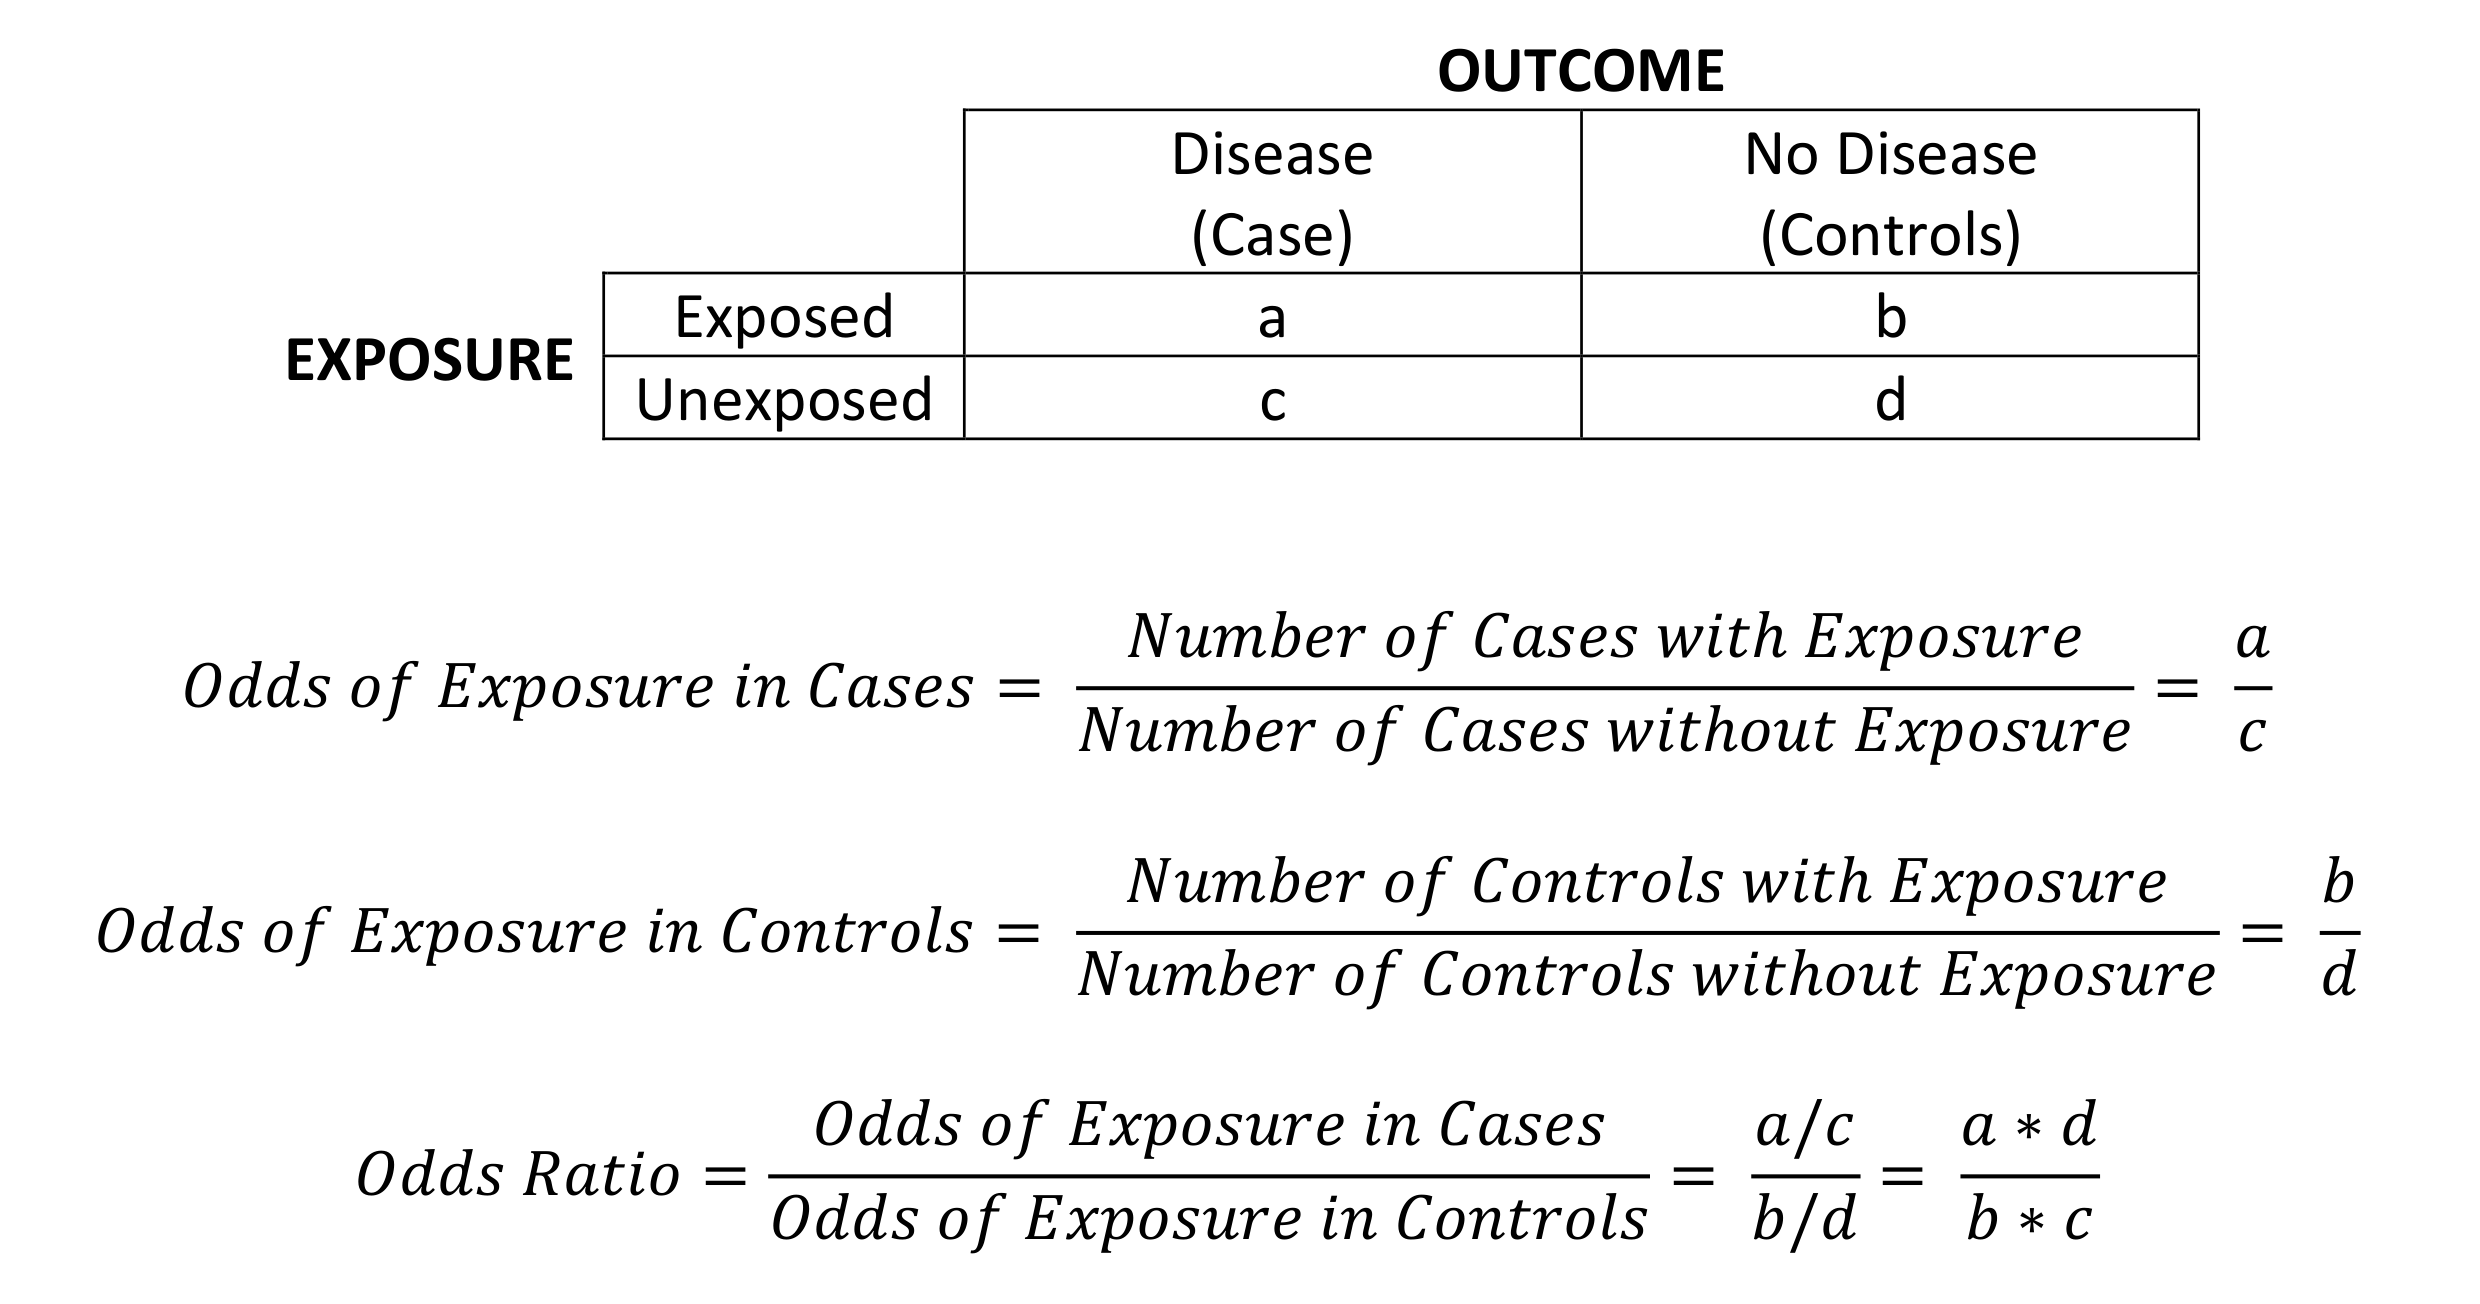
Odds Ratio: the ratio of the odds of the event happening in an exposed group vs a non-exposed group
The larger the odds ratio, the more likely the event is to be found with exposure
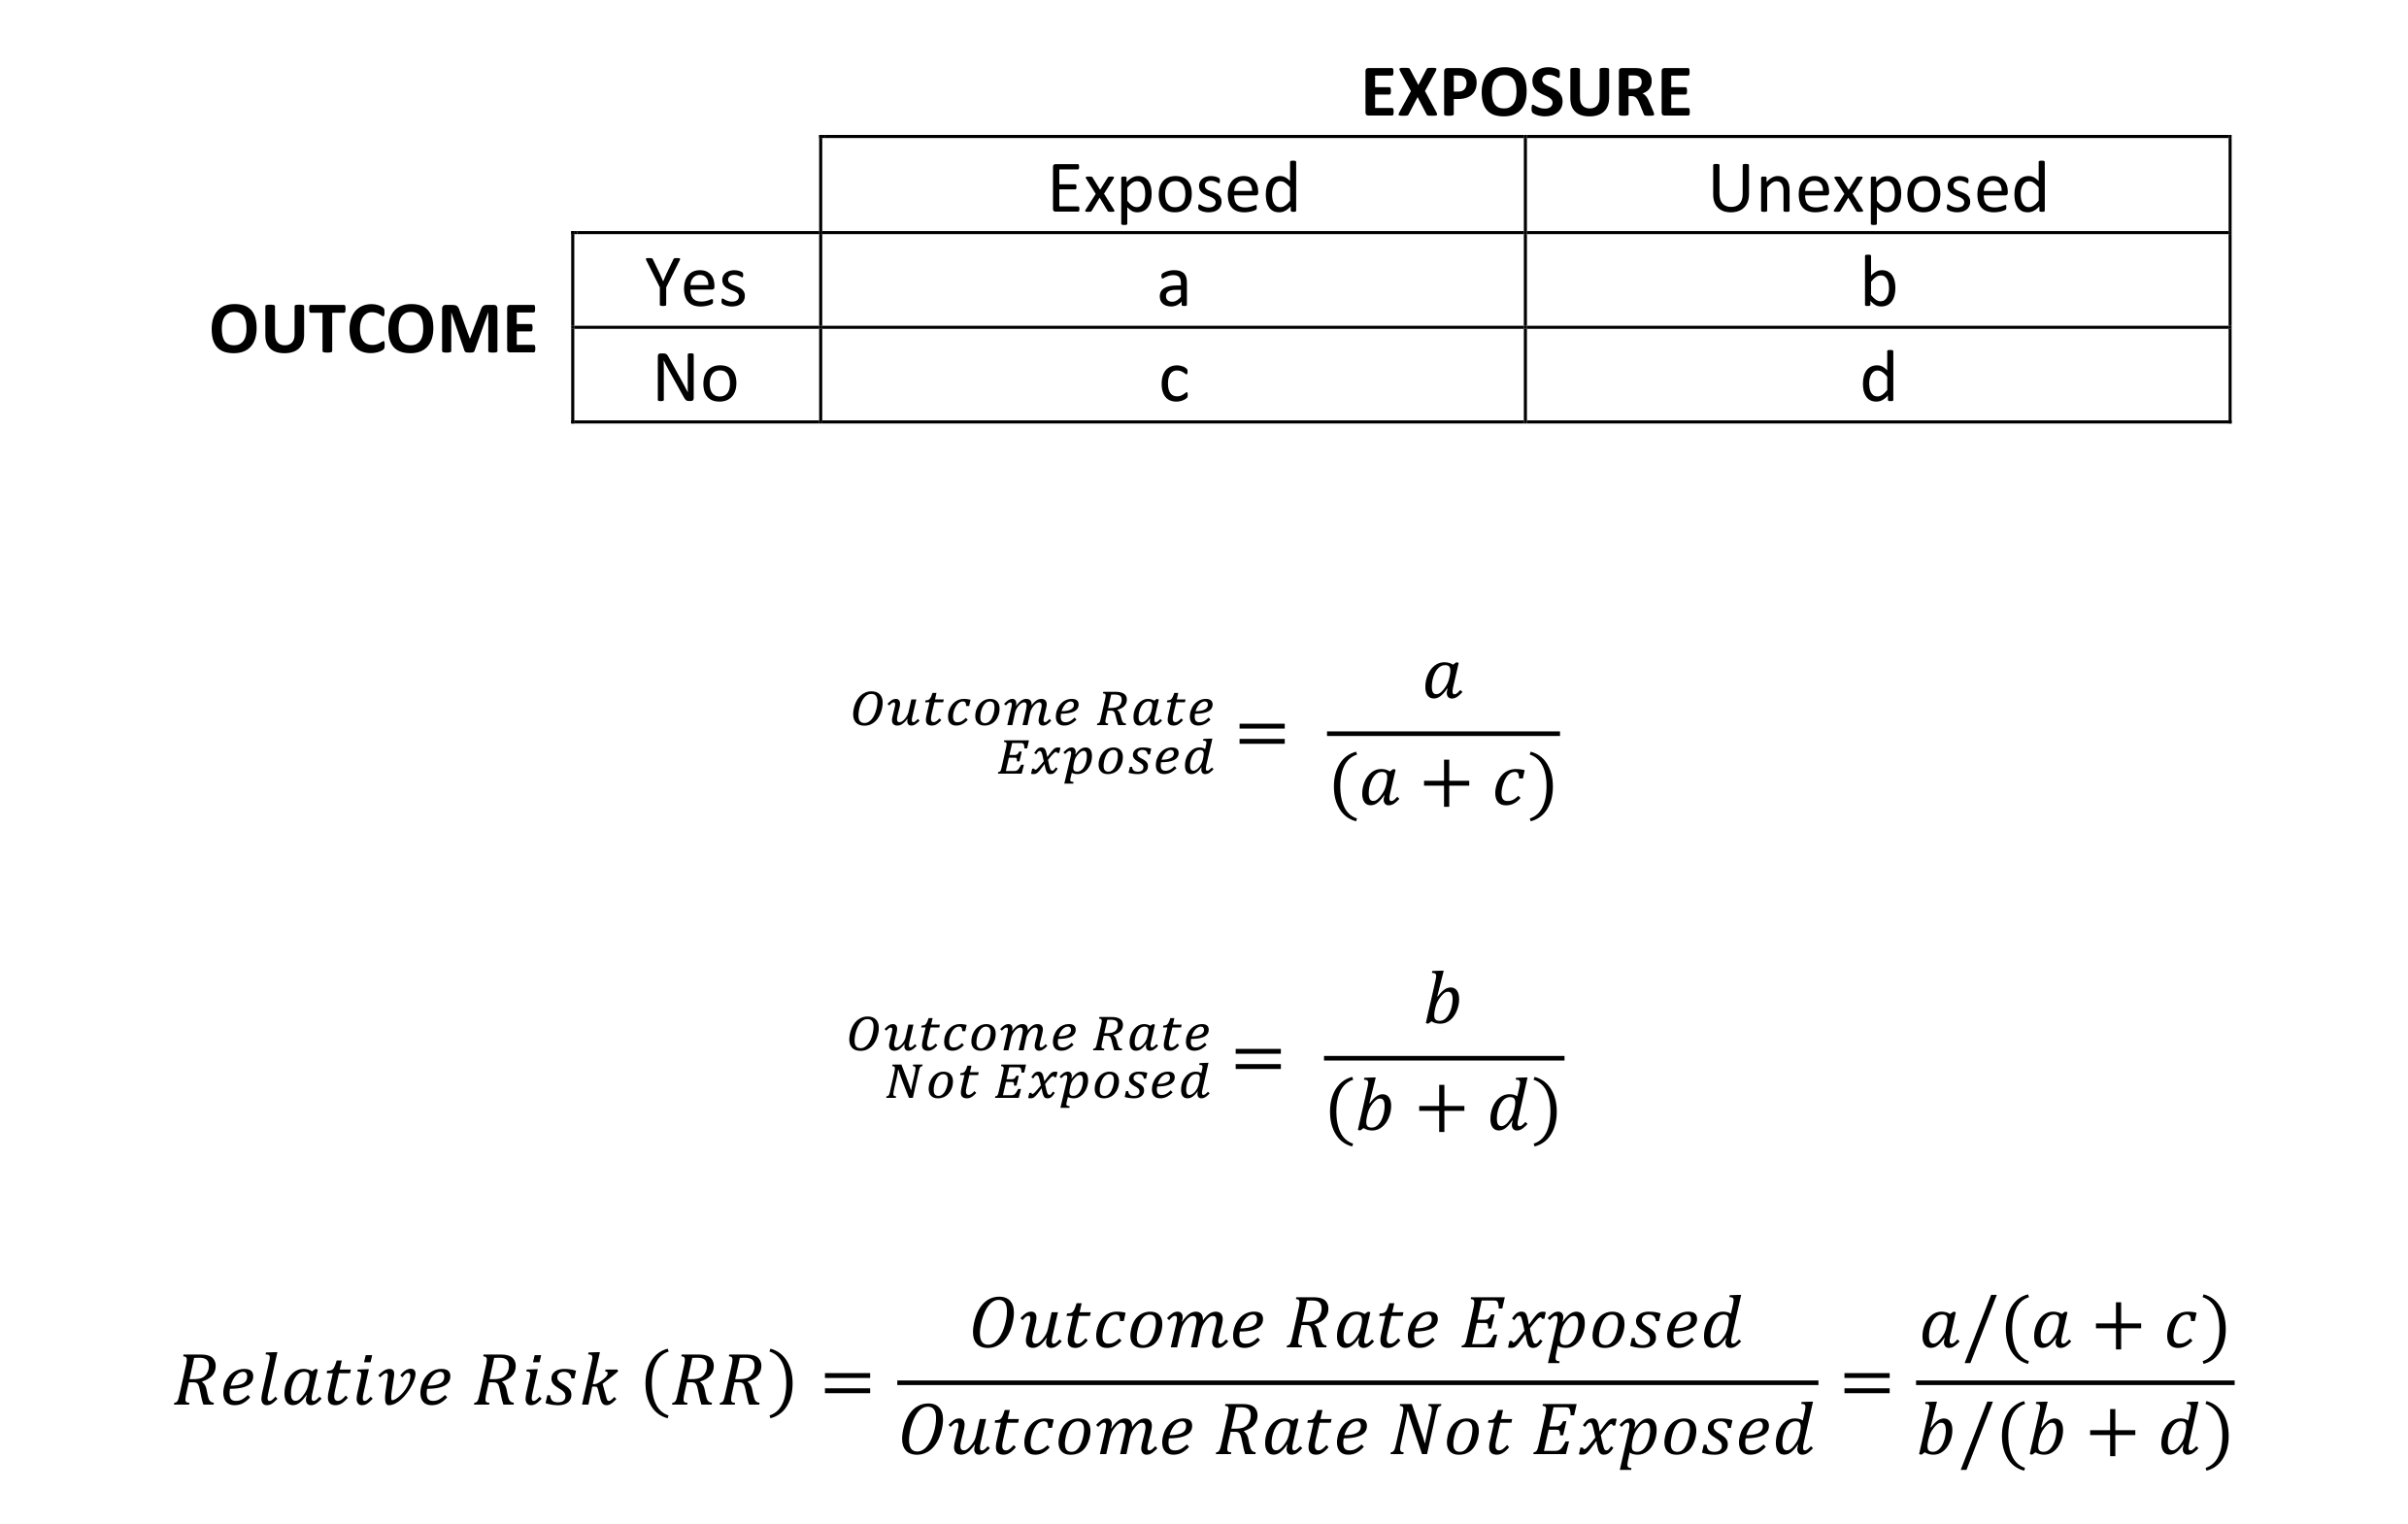
Relative Risk: the ratio of the probability of an event occurring with an exposure vs the probability of the event occurring without the exposure.
A relative risk of 1.5 means that the risk of the outcome of interest is 50% higher in the exposed group than the unexposed group.
Absolute Risk: the number of events in an exposed or control group, divided by the number of people in that group.