Chapter 13: Taking the Measure of Stars Notes
Goals and Objectives
Chapter 13 focuses on understanding stars and their properties, including their formation, evolution, and eventual fate.
Learning goals include understanding parallax, determining distances to stars using various methods (spectroscopic parallax), and combining distances with brightness to determine luminosity accurately.
Also covered are advanced methods to obtain temperatures (using blackbody radiation curves and Wien's Law), sizes (using Stefan-Boltzmann Law), and compositions of stars (analyzing spectral lines), as well as estimating their masses using binary star systems and gravitational effects.
Categorizing stars using the Hertzsprung-Russell (H-R) diagram, understanding its different (main sequence, giants, supergiants, white dwarfs), and interpreting stellar evolution on the diagram is a key objective.
Determining luminosity, temperature, size, and age from a star's mass and composition, and understanding how these properties change over a star's lifetime is also a learning goal.
Practical Information
Homework Set 13 is due on Friday, April 25th. Ensure timely submission to avoid late penalties.
The final exam is scheduled for May 15, 2025, at 5:30 PM in LR2. The exam will cover all topics discussed throughout the semester.
Help is available at the Phys/Astro Help VAN 650. Utilize this resource for any difficulties encountered.
Office drop-in hours are MWF 3:30 - 4:30 PM. Take advantage of these hours for direct assistance.
Virtual office hours are T-TH 10-Noon via Zoom. Join the sessions using the provided Zoom link for remote assistance.
Stereoscopic Vision and Depth Perception
Stereoscopic vision enables 3D perception by providing depth and distance information, crucial for understanding the relative positions of celestial objects.
Distance over which your stereoscopic vision works is limited
Each eye views your finger in a different vantage point, and your brain must combine the info from each eye to perceive distance with stereoscopic vision
Parallax
Parallax: Used to measure nearby stars— shift in a star’s apparent position by the Earth’s orbit
Aristarchus (310-230 BCE) proposed that the Earth moves around the Sun and that parallax should be observable in nearby stars compared to distant stars. His heliocentric model was revolutionary for its time.
Ancient astronomers couldn't detect parallax due to the immense distances to stars and the lack of precise instruments, but Aristarchus was correct in his theory.
Friedrich Bessel made the first successful parallax measurement in 1838 for the star 61 Cygni, a breakthrough that confirmed the vast distances to stars.
Parallax and Distance Relationship
The parallax angle () is inversely proportional to the distance () to the star: or
If Star A has a parallax of 1 arcsec, and Star B has a parallax of 1/2 arcsec, Star B is twice as far away as Star A. This inverse relationship is fundamental in determining stellar distances.
Arcminute refers 1/60 of a degree and a arcsecond is 1/60 of an arcminute or 1/360 of a degree
Units and Conversions
Angular Measurement
One circle has 360 degrees ().
One degree has 60 arcminutes (60').
One arcminute has 60 arcseconds (60 '').
Location can be shown in Degrees, arcmin, arcsec or in Decimal Degrees. Understanding these conversions is crucial for astronomical calculations.
Example Calculation
Proxima Centauri has a parallax of 0.77 arcseconds. To find the distance in parsecs: . Conversions to Light-years and AUs are then possible using the provided conversion factors. This calculation demonstrates the practical application of parallax in distance determination.
Luminosity
Luminosity: The rate at which a star emits electromagnetic energy into space; the total power output of an object. Luminosity is an intrinsic property of a star.
If the Sun has a luminosity of 1 L (sun), Sirius has a luminosity of 25 times the sun making it 25 L (sun) or 1 L (Sirius)
Apparent Magnitude
Apparent brightness: A measure of the amount of light received by Earth from a star or other object. Apparent brightness depends on both the star's luminosity and its distance.
Hipparchus (190-120 BCE) established the apparent magnitude system and first detected the precession of the Earth. His magnitude system is still used today, albeit with refinements.
The magnitude scale is such that brighter objects have smaller (or negative) magnitudes. This counterintuitive scale is a key feature of the magnitude system.
Absolute Magnitude
Absolute magnitude: Luminosity on a logarithmic scale— defined as equal to the apparent magnitude if the object was viewed 10 parsecs (32.6 lightyears away)
It's a measure of the luminosity of a celestial object, allowing for direct comparison of stellar luminosities regardless of distance.
Brightness Scale
Each step in magnitude is approximately 2.5 times brighter or dimmer than the step below or above it. This logarithmic scale reflects the human eye's response to brightness.
Negative numbers indicate brighter objects (e.g., the Sun has an apparent magnitude of -26, the Moon -12). The more negative the magnitude, the brighter the object.
Wien’s Law
Wien’s Law relates the peak wavelength of emitted radiation to the temperature of a blackbody: Ymax = 2.9 × 10⁶ nm x K. y is in nanometers and T is in K
It is an objects temp to the peak wavelength of its spectrum. Blue = increase in surface temp and Red = cool surface temp
Stefan-Boltzmann Law
The Stefan-Boltzmann Law relates luminosity to temperature and radius: , where is luminosity, is intensity (energy per unit area per second), is the surface area, is the radius and is the Stefan-Boltzmann constant. This law allows for the calculation of a star's radius if its luminosity and temperature are known.
If two objects are the same size, the hotter object is more luminous. The larger star is the more luminous star.
Blackbody Curves
Hotter objects are more luminous and have shorter peak wavelengths. The shape of a blackbody curve reveals information about an object's temperature and luminosity.
The color of a star is directly related to its temperature, with hotter stars appearing blue and cooler stars appearing red.
Color Index
Color index: The difference between magnitudes of a star measured in different spectral regions (e.g., B-V). The color index provides a quantitative measure of a star's color.
Hotter stars are bluer; red stars are cooler. This relationship is used to estimate stellar temperatures.
Spectral Classification
Stars are classified based on their temperatures using the spectral types O, B, A, F, G, K, and M, with L, T, and Y added for cooler objects. Each spectral type is further divided into subtypes (e.g., A0, A1, A2) for finer temperature distinctions.
Oh be a fine girl kiss me! Hottest to coolest
Spectral Lines
Spectral lines are related to energy transitions within atoms (ground state, excited states). The presence and strength of spectral lines reveal a star's composition, temperature, density, and velocity.
Absorption lines in stars vary in strength depending on temperature. Analyzing these lines provides valuable insights into stellar properties.
Dark lines where parts of missing, and use it to find it chemical composition
Brown Dwarfs
Brown dwarfs: Objects intermediate in size between planets and stars, with masses between 1/100 of the Sun's mass and the lower mass limit for self-sustaining nuclear reactions (about 0.075 the mass of the Sun). Brown dwarfs occupy a unique position between stars and planets.
They are capable of deuterium fusion but not hydrogen fusion. This limited fusion capability distinguishes them from true stars.
In between gas planets and stars
They don’t have enough mass to be a star
Composition of Stars
Stars are primarily composed of hydrogen and helium, with heavier elements making up a smaller fraction. The relative abundance of these elements affects a star's properties and evolution.
Finding the Size of Stars
Using the Stefan-Boltzmann law: , where is luminosity, is radius, and is temperature. By rearranging this formula allows one to calculate stellar radii.
Measure luminosity from distance and brightness and temperature from color, then calculate the size. This method allows astronomers to determine the physical sizes of stars.
Binary Stars
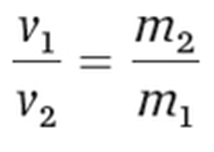
Binary stars orbit their center of mass—balance point of a system— due to mutual gravitational attraction.
Think of a seesaw, the center of mass is where the support of a balance must be at.
Types of binary stars include Visual Binaries (resolved with telescopes), Eclipsing Binaries (brightness varies as stars eclipse each other), and Spectroscopic Binaries (identified by periodic shifts in spectral lines).
Measuring orbits in binary systems helps determine the masses of the stars using Kepler's laws.
Hertzsprung-Russell Diagram (H-R Diagram)
The H-R diagram plots stars based on their luminosity and temperature, providing a powerful tool for understanding stellar evolution.
It was developed by Ejnar Hertzsprung and Henry Norris Russell, revolutionizing our understanding of stars.
Stars’ luminosities are on the y-axis where as the surface temp is along the x axis.
Main Sequence
The main sequence represents stars in the prime of their lives, fusing hydrogen into helium in their cores. Stars spend most of their lives on the main sequence.
Left end of the main sequence are the O stars; which are more luminous and hotter than the sun
Right end of the main sequence are the M stars; cooler, smaller and fainter than the Sun