management of Energy Supply
National Example
China’s Energy Strategy
Strategy plans to
Reduce energy use per GDP by 20%
Ensure a more secure supply of energy
Increase sustainability
Demand and changes in demand:
Average annual demand growth rate of 5.6%
Consumption rose by 45% between 2006-2013
570Mtce used in 1978 rose to 3250Mtce in 2010
Forecast growth to 4840-5070Mtce in 2020, and then up to 5580-5870Mtce in 2030
Target to reduce carbon emission by 40-45%
Issues: worlds top energy consumer, a total of 4.8bn KWh were generated in 2012
Issues in changes in supply
Between 2000 and 2010
Constant 70% coal
Oil reduced: 22.2% to 16.5%
Natural gas rose: 2.2% to 4.3%
Renewables rose: 6.4% to 8.3%
2017 data:
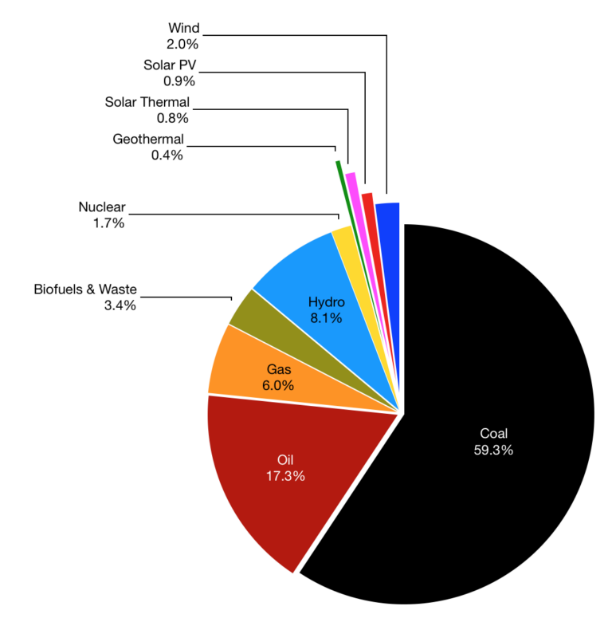
Issues: uranium demand (17 nuclear power stations under construction, with plans for 124), World’s top coal producer (4bn tons in 2012)
Actual production of electricity
World leader in:
HEP: 15% of total production
Wind: 30% global capacity
Open 1 ‘clean’ coal-fired power station per month
Between 2003-13; accounted for 87% of the world’s coal consumption
Greenpeace: 80% CO2 is from burning coal
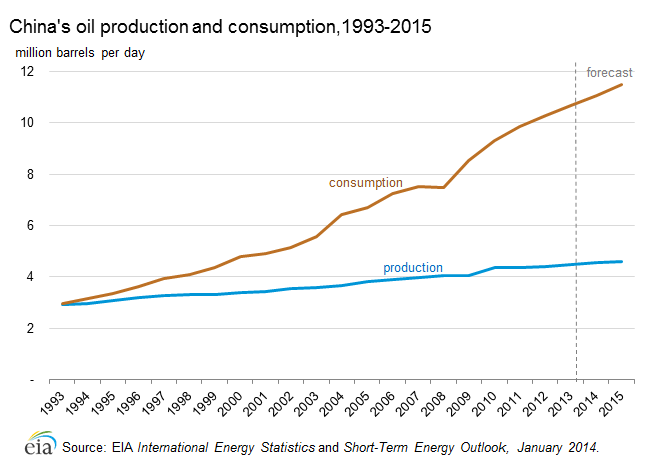
Oil production and consumption
Net imports of 6 million barrels per day
Consumption to increase while production remains constant
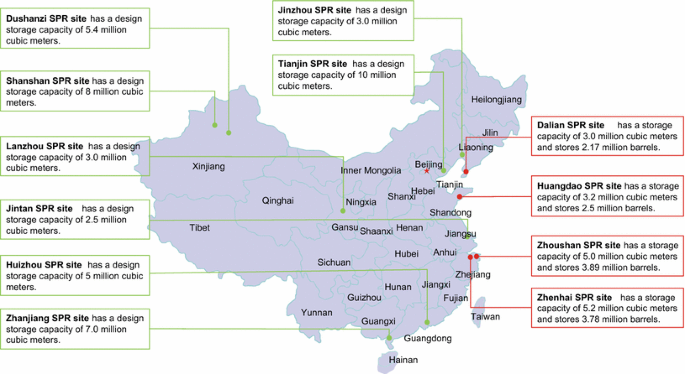
Strategic Petroleum Reserve
Supply of petroleum held by China as emergency fuel for use in emergency situations: major price increases, instability in supply, major disaster
Managed by the National Development and Reform Commission
Expanded in 2007
200 million barrels in 2014, 900 million in 2019
Expected to reach 1.15 billion barrels, that would last 83 days in 2020
Main facilities
Zhenhai, Zhenjiang Province: 52 million barrels
Tianjin: 150 million barrels
Location
Renewable energy policy
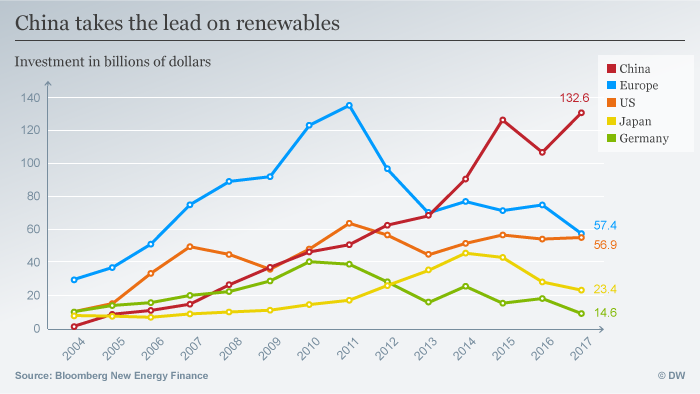
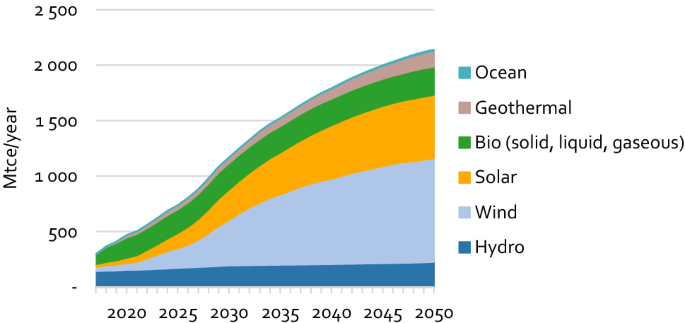
Produce 15% of overall energy from renewable sources by 2020 and 20% by 2030
Program goals (for 2005)
Reach 13 Mtce of electricity using new and renewable energy (not hydroelectric)
Reduce CO2 by 10 Mt and SO2 0.6 Mt
Increase solar water heating from 11million m2 to 64million m2
Increase production capacity of solar cells to 15MW with total capacity 53MW
Increase manufacturing capacity of wind power to 200MW and increase capacity to 1.2 GW
Increase geothermal energy production to 20 million m2
Increase gas supplies to almost 2 billion m3
Evaluation of strategy success
Renewables have increased
2012 capacity (2.1% of consumption)
Wind = 61GW
Solar = 3.4GW
2017 capacity (5.3% of consumption)
Wind = 169GW
Solar = 130GW
Forecast:
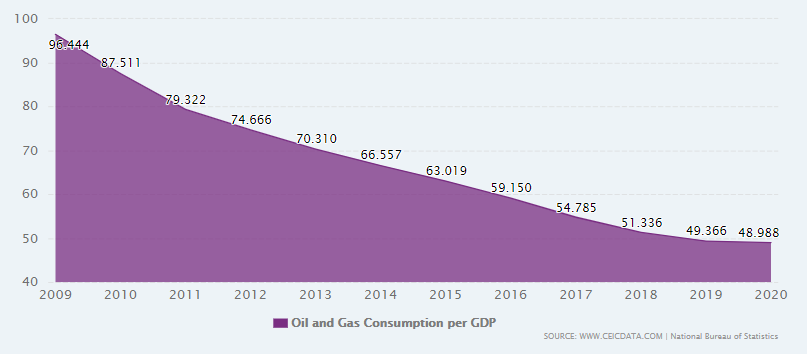
Consumption per GDP fell by 49% between 2009 and 2020 – echoing success of 2006-10 plan to reduce by 20%
Located Example
China’s 3 Gorges Dam
Description
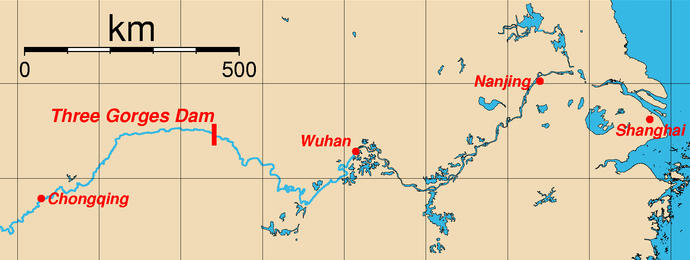
Built on the Yangtze River, China (near Chongqing)
Operational 2012, completed 2009 after 17 years
Created 20,000 jobs during construction
Ship lift installed in 2015
Largest HEP in the world (2.3km x 100m x 115m thick)
Dam is 660km long
Reasons for development (changes in demand)
Reduce downstream flooding: 3000 dead in 1999 floods, compared to only 300 in 2012
Generate HEP to diversify from coal: 70% coal
Fuel economic growth: reduce flooding and protect Chongqing (35m is largest metropolitan area in the world), ship locks and lift allow navigation
Tame the Yangtze: ambition of leaders such as Emperor Mao
Actual production of electricity (new supply)
34 generators with total capacity of 22,000MW
Generates an average 95 ± 20TWh
2020 monsoon rains = 112TWh
Generated 100bn KWh in 2011
Produces power for 60 million people
Location
SEEP considerations
Social
Locals relocated; reduced flooding (3000 in 1998 vs. 300 in 2012); secure water supplies for 10m; created 20,000 jobs
1.3m uprooted; 140 towns and 255 cultural sites flooded; houses, jobs, communities lost; less natural silt fertiliser for farms
Environmental
Reduces China’s dependency on fossil fuels
Destroys wildlife by changing ecology (river dolphins, Sturgeon fish); eyesore (visual pollution); contaminants not cleaned from valley floor
Economic
Protects 10m people from flooding in Chongqing, Wuhan and Shanghai; 10,000 tonne ships can use locks /lifts to navigate (encourages upstream industry)
Cost between 25bnand25bnand88bn (official, estimate); cost $100bn to relocate displaced
Political
Political pride in project
Risk of failure (landslides (150 in 5 months), silt build-up)
Evaluation of scheme success
Scheme has social, environmental and economic consequences (some positive and negative)
Contributes to stagnation of coal consumption (50%)
Produced energy equivalent of 50 tonnes of coal
Accounts for ¼ China’s electricity capacity
HEP produced 15% China’s electricity in 2015, with 3GD being largest example (significantly contributes)
HEP meets policy aim to ↑ renewables to 15% 2020
Little room for future expansion – more generators?