W13: Temporal Vision
Temporal Vision
Learning Objectives
Understand the change in visual sensitivity to variations in light information over time (temporal sensitivity).
Measurement of temporal sensitivity with flickering lights.
Temporal sensitivity and its relationship to the Impulse Response (IRF).
Characteristics of human temporal sensitivity (including chromatic, photopic, mesopic & scotopic).
Physiological basis of temporal contrast sensitivity.
Factors affecting temporal contrast sensitivity in humans.
Effect of disease on temporal vision.
Measurement of Temporal Sensitivity with Flickering Lights
Temporal Contrast Sensitivity (TCS)
Measure of sensitivity to variations in luminance and/or chromaticity over time (also known as flicker sensitivity).
Spatial contrast sensitivity measures sensitivity to variations in luminance and/or chromaticity over space.
TCS functions can be measured using any stimulus that changes over time (e.g., sinusoidal or rectangular waveforms).
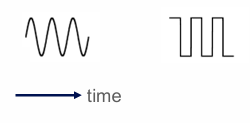
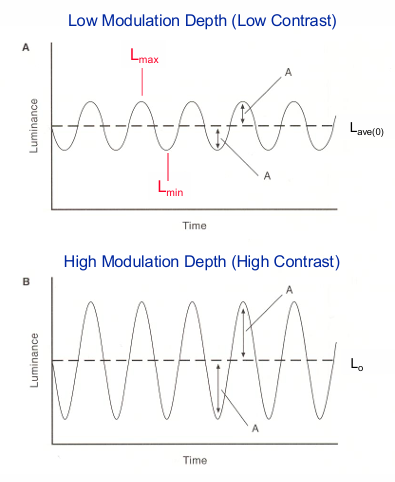
Sinusoidal Flicker
Quantified using parameters similar to those for a sinusoidal grating pattern:
Amplitude (A) or Contrast (C) of the modulation.
Mean Luminance (Lo or Lave).
Temporal period (): Length of one full cycle
Unit: Frequency (Hz) in cycles per second.
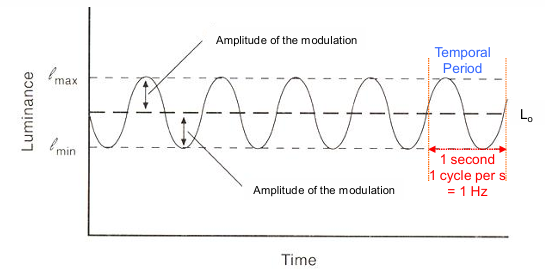
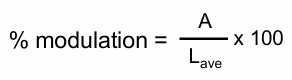
Temporal Modulation Depth: relationship between the peak and time average luminance.
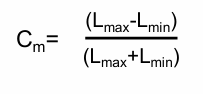
Michelson contrast:
Threshold Amplitude = %Contrast x
Temporal Frequency
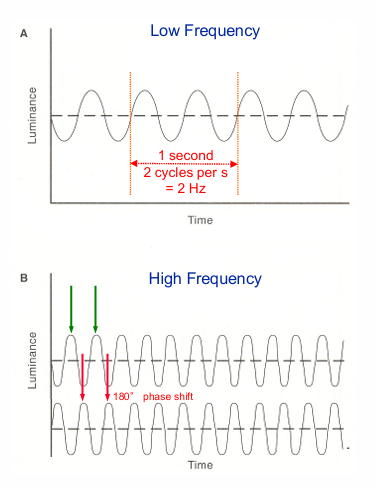
Inverse of temporal period.
Number of cycles per second (Hz).
Phase
Relates the position of a feature (e.g., peak or trough) to that same feature in another part of the waveform.
Temporal Sensitivity and its Relationship to the Impulse Response Function (IRF)
common for electroretinogram - gives an indication of impulse response, allowing the study of photoreceptor function.
Temporal Contrast Sensitivity Function
Defined as the ability of the visual system to detect variations in the rate of change in light over time.
Temporal contrast sensitivity (TCS): @ each frequency (Hz).
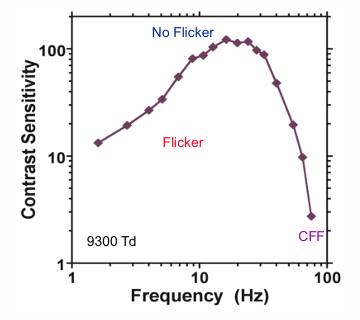
Temporal Contrast Sensitivity Function (TCSF)
low frequency = low contrast sensitivity
as frequency increases = contrast sensitivity increases
peak = human eye is sensitive to temporal changes that are less than 1% contrast.
Critical Fusion Frequency (CFF): The frequency at which flicker is no longer perceived. ~100% modulation (frequency of 100)
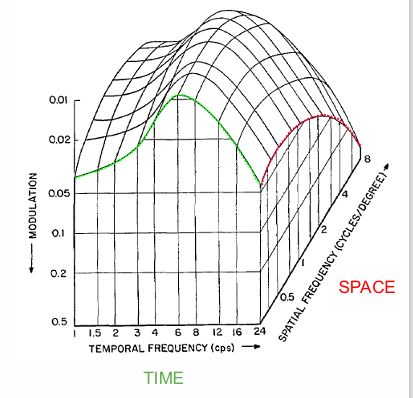
3D spatio-TCSF:
eye is most sensitive to temporal frequency ~4-8 Hz.
Measurement of Temporal Modulation Transfer Functions
Temporal modulation transfer function introduced to human visual psychophysics from engineering.
Measures transfer function (input/output amplitude & phase response) of an electronic system as a function of the temporal frequency of the sinusoidal input.
Linear systems can be completely described by the impulse response.
non-linear system will have changes in phase or the frequency composition of the stimulus.
In vision, assesses contrast modulation threshold as a function of temporal frequency of a sinusoidal waveform, assuming a constant criterion independent of temporal frequency.
This format opens itself to modelling using linear systems (including Fourier analysis).
Fourier Theory
Assumes a linear system:
The visual system behaves linearly at low stimulus contrasts (near threshold).
Sensitivity determined by the fundamental frequency in the stimulus (Eisner, 1995).
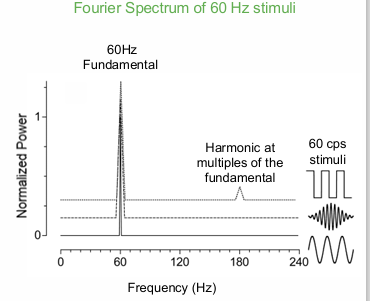
Visual response to complicated temporal signals is the sum of responses to the individual temporal sinusoidal components (amplitude & phase) of the flicker pattern.
Any stimulus can be used to measure temporal sensitivity.
when stimulus is rectangular, there is higher frequency energy contained at the edges. This produces energy at multiples of the harmonics.
The shape of the waveform can impact the composition of the stimulus.
Impulse Response Functions (IRF)
A delta function is a (theoretical) stimulus light with an infinitesimal short time & infinite energy; the Fourier spectrum of a delta function contains equal energy at all temporal frequencies (equally flat at all frequency)
can’t do it directly in humans due to physiological limits.
An IRF completely defines the temporal response of a system (i.e., the output) to an (input) delta function.
IRFs are specified in terms of amplitude & time-to-peak and are typically monophasic (up & down) or biphasic.
lag caused by feedback from horizontal cells.
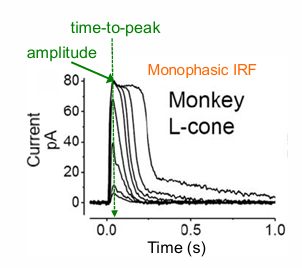
For vision, we can only approximate the delta function with light stimuli, but can reliably measure visual TCSFs with different temporal frequency sinewaves.
Importantly, the IRF of the human visual system can then be mathematically derived from the TCSF.
When the IRF is known, visual sensitivity can be predicted for any stimulus.
Characteristics of Human Temporal Sensitivity
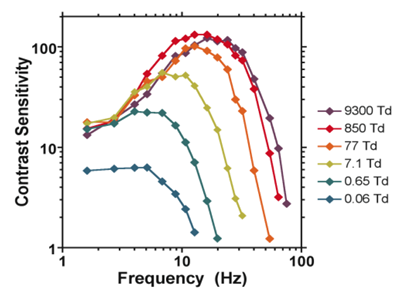
Photopic TCSF
Light level has a significant impact on the form of the photopic TCSF.
Band-pass at high light levels.
Low-pass at low light levels.
1 troland is one cone threshold on average (anything below is stimulating rods)
TCS worst at low and high Hz.
Peak sensitivity at 8–20 Hz.
TCT at peak can be <1%.
Temporal contrast sensitivity has high sensitivity because it activates both on and off pathways over time.
Critical Fusion Frequency (CFF) is the max temporal frequency resolved by the visual system (assumes max modulation of the target):
High frequency cut-off up to 60 Hz.
as light level increases → CFF increases
Scotopic TCSF
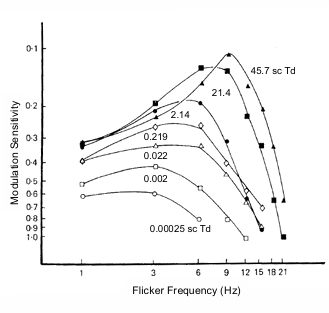
Light level alters the scotopic TCSF shape.
Band-pass at high light levels.
Low-pass at low light levels.
TCS worst at low and high Hz.
Peak sensitivity at ~ 4–9 Hz.
CFF for rod responses as high as 28 Hz.
Temporal Contrast Sensitivity and the Impulse Response Function (IRF)
With decreasing light level:
IRF changes from biphasic to monophasic.
Time-to-peak is delayed.
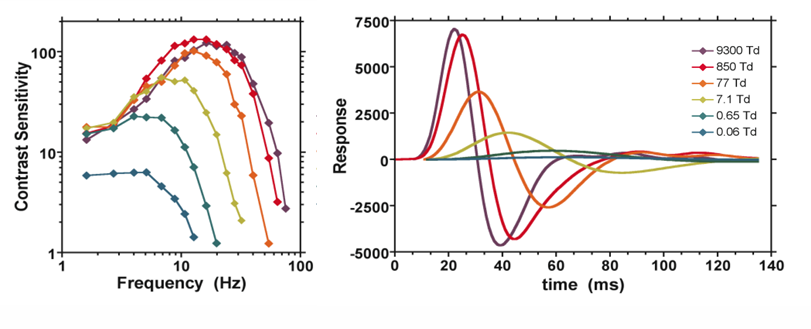
biphasic = band pass function
the faster the impulse response → the more band pass → higher the peak of temporal contrast sensitivity → the higher the CSF
monophasic = low band pass.
as light level goes down, CS shifts towards lower frequencies and it takes longer to reach the peak.
amplitude of impulse response is slower / smaller.
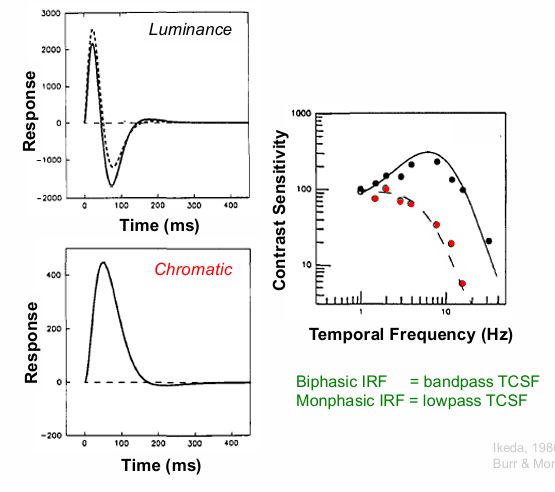
Luminance and Chromatic TCS
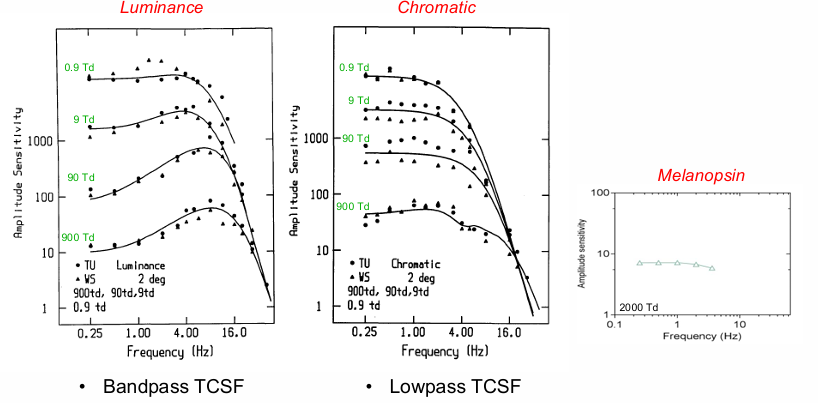
Bandpass TCSF for luminance.
Lowpass TCSF for chromatic.
Biphasic IRF = bandpass TCSF.
Monophasic IRF = lowpass TCSF.
Photoreceptor-isolating spatiotemporal vision
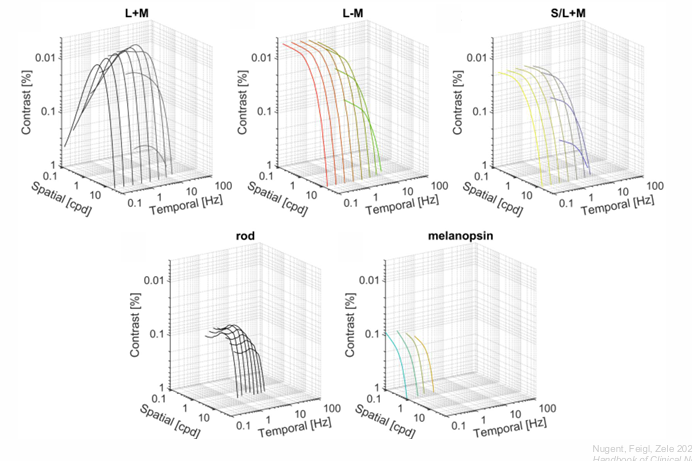
L+M: magnocellular pathway
achromatic system has high temporal contrast sensitivity and good spatial sensitivity, but it is a band pass function
L-M: parvocellular pathway
chromatic red/green very good at low temporal frequency.
S/L+M: bistratified ganglion cells for koniocellular pathway
sensitivity is reduced.
rods: spatiotemporal contrast modulations at photopic light levels, however, are much less sensitive than all of the different post receptor pathways.
melanopsin: excellent contrast sensitivity in regions where the cones are less sensitive.
As stimuli change, the visual system shifts between achromatic processes, red, green, blue and yellow chromatic process, rods and melanopsin - vision remains clear throughout the environment.
no sudden shock = smooth transition.
Representing TCSF Data
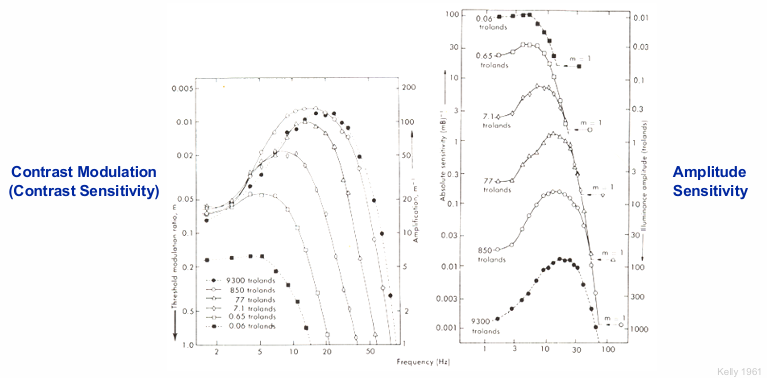
contrast or amplitude?
TCS (or threshold) is plotted on the y-axis & temporal frequency on the x-axis using log–log axes.
Threshold Amplitude vs. Temporal frequency (log–log plot), where threshold amplitude is the product of temporal contrast and mean luminance of the target.
Characteristics of TCS: Linearity & Weberian Behaviour
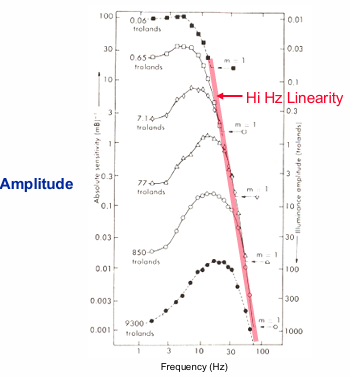
High temporal frequency performance
Linear relationship between frequency & threshold amplitude
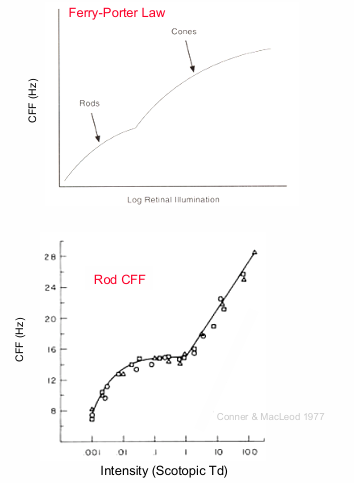
Ferry–Porter law applies (CFF ∝ Log Td)
retinal illuminance in trolands = Td
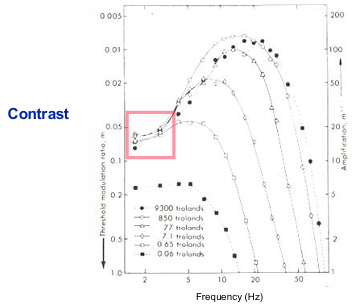
Low temporal frequency performance
TCSF curves converge at different retinal illuminances when plotted on contrast
Weberian Behaviour (ΔL/L=k)
k = constant
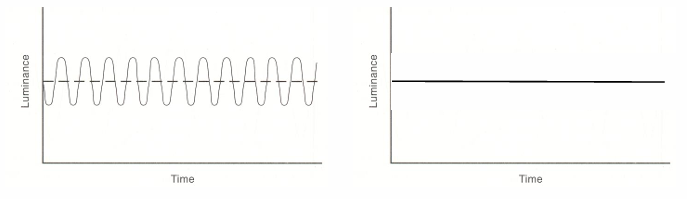
Talbot-Plateau Law
For flicker beyond the CFF: When Hz > CFF, appearance (brightness) equal to steady light of same .
example: TV and displays.
Ferry-Porter Law
Relates how CFF varies with retinal illuminance
CFF proportional to log retinal illuminance, expressed as:
f = CFF (Hz)
E = retinal illuminance (Trolands)
a and b are constants
Rod and Cone portions
Rods: maximum CFF ~ 28 Hz
initial low frequency component ~16Hz, followed by linear increase of 28Hz.
explained by lower limb being related to the high sensitive rod bipolar pathway. The higher frequency limb is related to the transmission of the rod signals through the cone pathway.
Cones: maximum CFF ~ 80 Hz
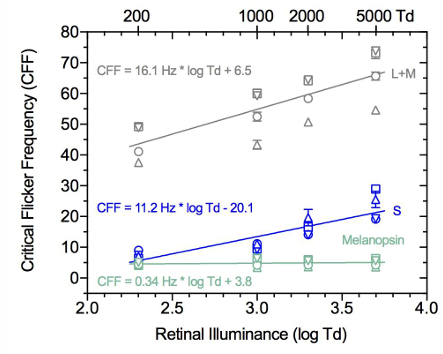
L+M cone (luminance) & S-cone CFF’s follow the Ferry-Porter law
Melanopsin-mediated CFF is invariant with light level - doesn’t change its temporal frequency.
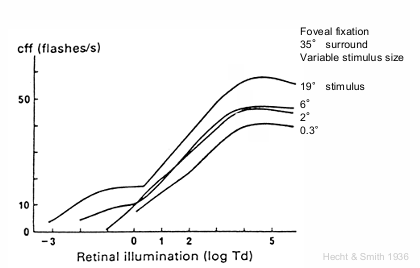
Granit-Harper Law
Relates how CFF varies with target area
CFF proportional to logarithm of target size, expressed as:
F = CFF (Hz)
A = target area ()
c and d are constants
larger the stimulus area = higher the CFF
Physiological Basis of Human and Primate Temporal Contrast Sensitivity
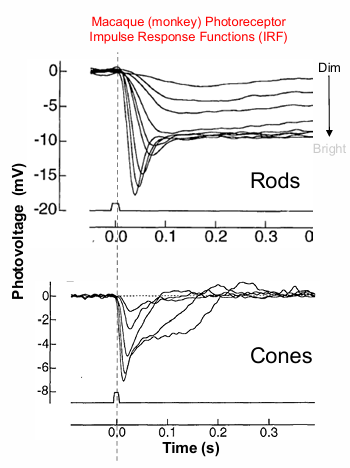
Electrophysiological evidence: Macaque (monkey) Photoreceptor Impulse Response Functions (IRF)
Photoreceptor (& post-receptoral pathway) responses are intensity dependent
As stimulus intensity increases, the latency (i.e., the time taken to react) of the response decreases as does its duration
Thus, a quicker responding photoreceptor will allow a higher CFF
Similar changes in photoreceptor IRF and behavioural IRF with changes in intensity (i.e., becomes faster and larger with increasing intensity)
TCSF can be explained by the IRF
tCSF Model: Smith, Pokorny, Lee & Dacey (2008)
A quasi-linear* systems approach can be used to describe the interaction of temporal dynamics and sensitivity regulation (adaptation) as a function of illumination
*quasi-linear: relationship between input-output signal is substantially linear despite existence of nonlinear elements
Primate tCS data measured in H1 Horizontal cells (reflect photoreceptor output), MC and PC cells.
Human tCS data measured for chromatic and luminance modulations
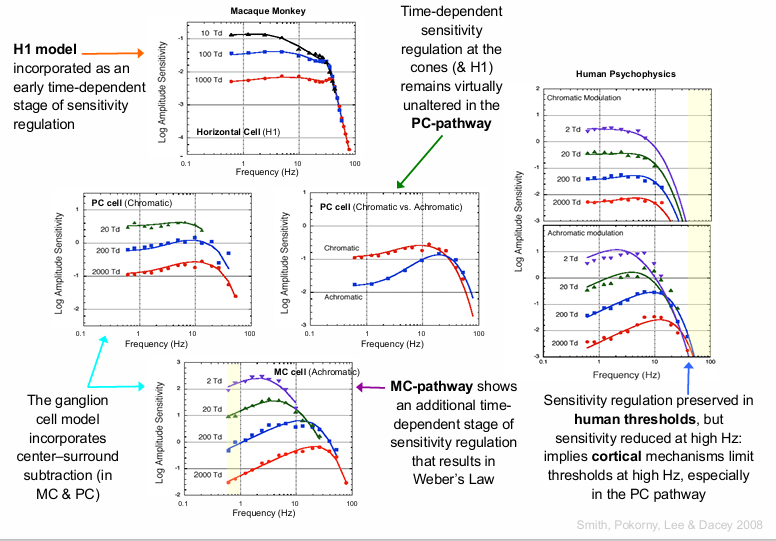
Macaque monkey
H1 model incorporated as an early time-dependent stage of sensitivity regulation
The ganglion cell model incorporates center–surround subtraction (in MC & PC)
MC-pathway shows an additional time-dependent stage of sensitivity regulation that results in Weber’s Law
Chromatic PC cells form a band pass function.
MC cells has a high temporal frequency sensitivity. Also is band-pass. Yellow bar → Weberian Behaviour is present in MC cells (this is not seen in PC cells).
Human data:
Sensitivity regulation preserved in human thresholds, but sensitivity reduced at high Hz: implies cortical mechanisms limit thresholds at high Hz, especially in the PC pathway
Sub-Weberian behaviour in chromatic modulations
Weberian behaviour in achromatic at low frequency + high sensitivities to high frequencies.
Brain is masking out the low frequency filter →Temporal frequency signals at high frequencies that are present for chromatic stimuli.
Factors Affecting Temporal Contrast Sensitivity
Retinal Location
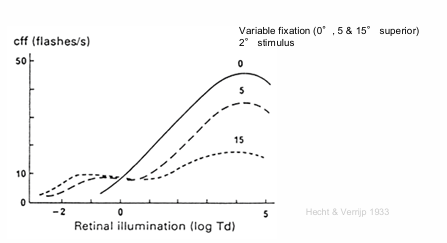
CFF poorer in periphery for small targets (1–2°diameter)
High retinal illuminance: CFF best at fovea
Low retinal illuminance: CFF best in periphery
for photopic levels.
rods are more sensitive in periphery.
Illumination, Wavelength and CFF
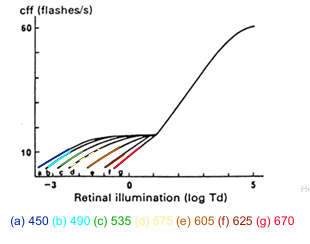
Photopic
CFF independent of wavelength with retinal illuminance (normalized to )
Scotopic
CFF varies with wavelength if photopic is used instead of scotopic
Mesopic
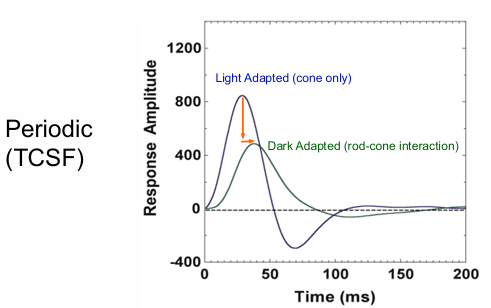
Rod-cone interactions alter temporal visual sensitivity
destructive interferences = reduces temporal sensitivity.
Photoreceptor interaction: Mesopic Lateral Rod Suppression of Cone CFF
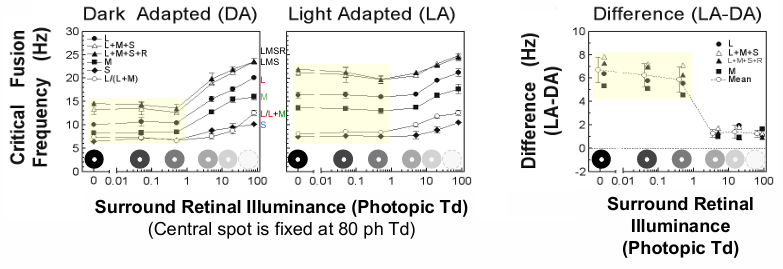
Difference between Light Adapted (LA) and Dark Adapted critical fusion frequency (CFF) indicate rod-cone interactions are strongest for L-cone, M-cone and luminance-containing modulations (LMS, LMSR), consistent with strong interactions in the MC-pathway.
Lateral Rod Suppression of Cone Temporal IRFs
Rod activity reduces cone pathway IRF amplitude & delays the time to peak
IRF changes associated with reduced MC-pathway contrast sensitivity & longer visual processing times; has direct implications for night-time driving (reaction times)
Affect of Disease on Temporal Contrast Sensitivity
Mesopic CFF in persons with high risk genotypes for ARM
Retinal metabolic demand is higher in dim lighting; flickering lights increase processing requirements, therein the CFF is sensitive to early disease changes
People with normal visual acuity, no ophthalmoscopically signs of ARM, and who are carriers of the CFH, LOC387715, & HRTA1 high-risk genotypes (gene-positive) have impaired rod- and cone-mediated mesopic visual function compared with persons who do not carry the risk genotypes (gene-negative)
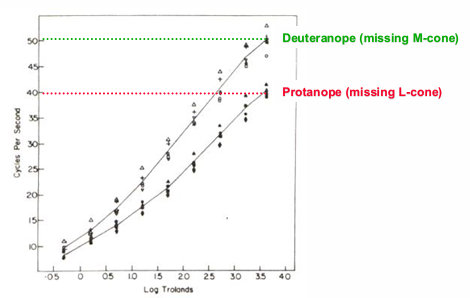
Dichromacy
Dichromatic retina: Deuteranope CFF > Protanopic CFF
Difference in CFF increases with increasing light level
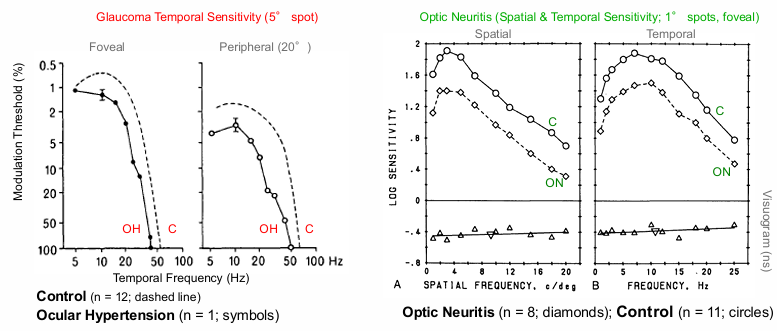
Temporal Sensitivity in Glaucoma & Optic Neuritis
Glaucoma: Generalized (non-selective) loss at all frequencies (central & peripheral)
Optic neuritis: Non-selective spatial/temporal frequency loss, although individual patients can show selective deficits
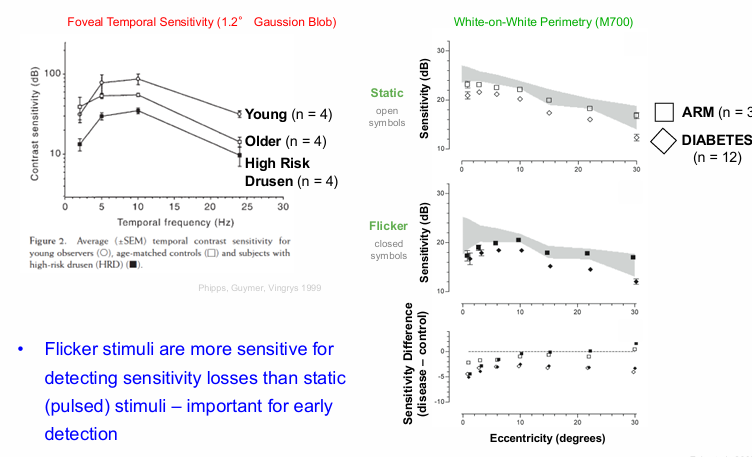
Temporal Sensitivity in ARM and Diabetes
Flicker stimuli are more sensitive for detecting sensitivity losses than static (pulsed) stimuli – important for early detection
ARM: perimetry normal in peripheral but decreases in central retina (for static). Loss of in central (7-8 deg) in flicker
Diabetes: Generalised loss across all retinal areas.
Difference: flicker produces a larger loss compared to the static. This means there can be an advantage for using a temporally modulating target to detect early changes.
Temporal Sensitivity in Migraineurs
Deficit is observed with flickering stimuli (but not static stimuli)
Visual field in all quadrants with flicker.
Migraineurs can have a reduced temporal sensitivity for over a month following migraines.
Questions to ask yourself: Key concepts
How does the shape of the TCSF change with illumination level?
Through what assumptions can the TCSF and IRF be linked?
What are the major physiological differences between the rod & cone photoreceptor IRFs?
How does the change in CFF with retinal location and illuminance depend on the rod and cone photoreceptors?
The human CFF can be described by what three laws?
Consider the clinical applications of flicker stimuli in the early detection of disease