Lodging Industry Comprehensive Notes
Industry Scope and Segments
The lodging sector is part of the Tourism Industry; other segments include Hospitality, Retail (Shopping), Stores, Transportation Services, Destination (Activity) Sites.
Lodging is part of the Tourism Industry; lodging operations and F&B (Food & Beverage) operations are components; Figure 1.1 illustrates Segments in the Tourism Industry.
The lodging sector is described as the nation’s largest service industry with notable economic impact:
Annual revenue:
Annual growth (2017–2022):
Employment impact: one of the nation’s largest employers, wages paid: (2022)
Number of businesses:
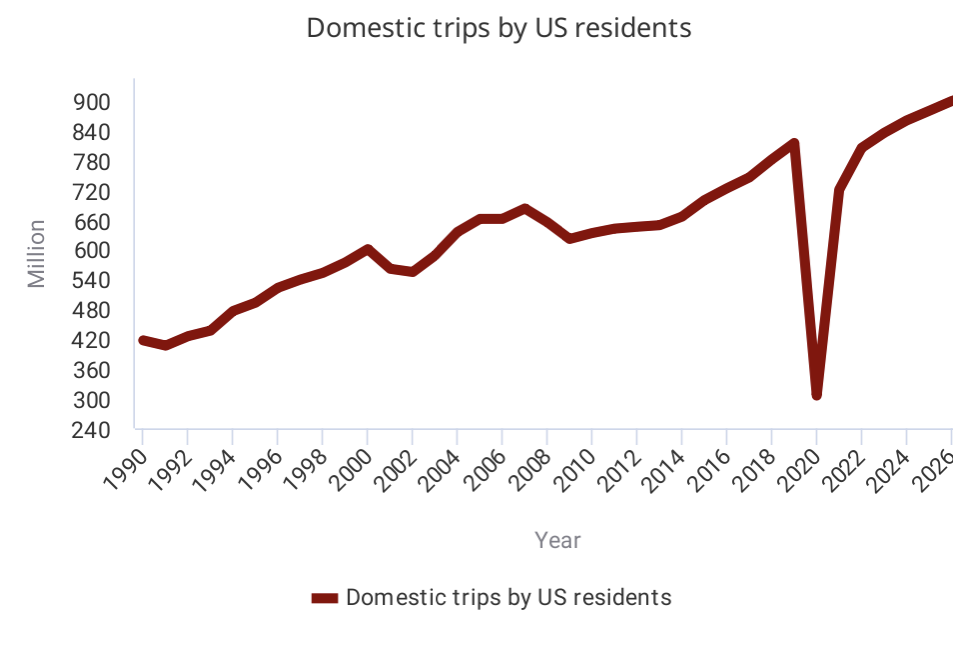
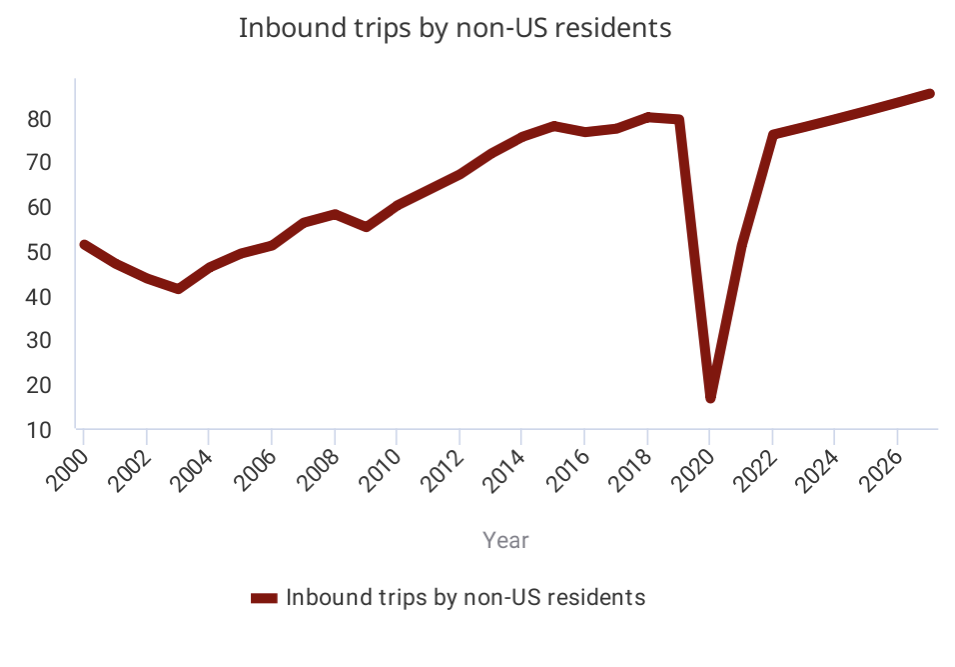
Demand Drivers
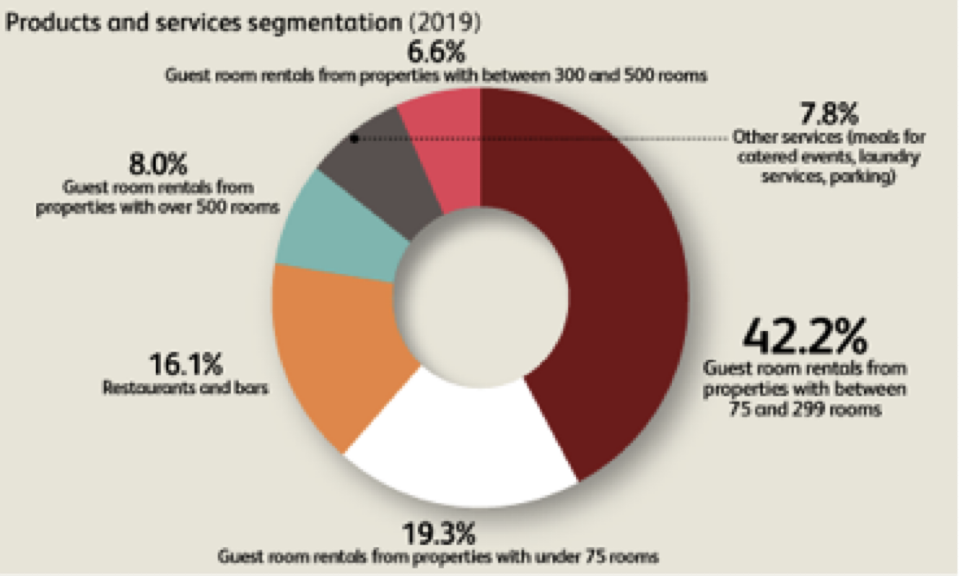
Hotel & Motels Segmentation
1900: A Brief Modern History of US Hotels (timeline highlights)
1910
Fewer than 10,000 hotels
Rooms:
Hotels: approximately in the U.S.
Total rooms: about
Employees: around
Average hotel size:
1920
Occupancy:
Hotel construction peaks with thousands of rooms added along new state/federal highways
1930
Occupancy:
AHA’s Hotel Red Book lists hotels
1940
Occupancy:
Average room rate:
1950
Occupancy:
Typical hotel:
Average room rate:
1960
Occupancy:
Sales:
Total hotel rooms:
Typical hotel: ; independent and locally owned
Average room rate:
1970
Occupancy:
Sales:
Total hotel rooms:
Average room rate:
1980
Occupancy:
Sales:
Total hotel rooms:
Average room rate:
1990; 2000–2010
1990: Occupancy: , Sales: , Average room rate:
2000–2010: Occupancy: , Sales: , Total hotel rooms: , Properties: about , Average room rate:
Notable Figures in Hotel History
Ellsworth Statler (1863–1928) & Statler Hotel
Motto: “the guest is always right”
César Ritz (1850–1918) & the Ritz Hotel
Described as “king of hoteliers and hotelier to kings”
The Marriott Empire
Emphasis on the men behind the Marriott enterprise; slide title indicates leadership behind Marriott, but no specific names/details provided in transcript.
Lodging: Tangible vs. Intangible Attributes
Guests consider both physical attributes and service quality when making a purchase decision.
Lodging Industry Characteristics
Location: Importance of location to hotels
Perishability: If a room is not rented on a date, the revenue is lost forever
Repetitiveness: Some operating procedures are routine
Labor Intensive: Much daily work involves employee-provided services
Seasonality: Cyclical nature of hotel business
Fixed supply but varying demand: Fixed number of rooms cannot change with demand
Size and ADR (by size, by class, and by plan)
By size (number of available rooms):
Mega: > 1{,}000
Large: > 300
Mid-size: 100–300
Small: < 100
By class – ADR (Average Daily Rate):
Deluxe/Luxury (Above per night) – Examples: Fairmont, Four Seasons, Park Hayat, Ritz-Carlton, Mandarin Oriental
Upper upscale (Around ) – Le Meridien; Sofitel, W hotels
Upscale (Around ) – Hayatt, Marriott, Omni
Mid price with food (Around ) – Four Points, Hilton Garden Inn, Best Western
Mid price without food (Around ) – Amerisuites, Hampton Inn, La Quinta
Economy (Around ) – Red Roof Inn, Super 8
Budget (Around ) – Econolodge, Microtel
By type of hotel – Commercial / transient; Residential; Extended-stay / all-suite; Resorts & mega resorts
By Plan – European; Continental (continental breakfast); American; Modified American
Complimentary Breakfast
Currently 62% of hotels in the U.S. offer complimentary breakfast
81% among economy hotels
96% among midscale hotels
80% among upper upscale hotels
The average cost of breakfast in a hotel is around
84% of U.S. travelers say a free breakfast is important to them
Leading hotel companies worldwide (as of August 2021) by number of guestrooms
Presentation shows leading companies by guestroom count; specific numbers are in the transcript’s figure/table but not reproduced here
Lodging Ownership and Management Alternatives
Hotel property ownership/management options include:
Franchise company (Franchisor) ownership
Independent ownership
Independent operation
Franchise company (Franchisor) affiliation/management
Management company affiliation
Non-Franchise ownership/operation
Hotel Organizational Structures
Small (75 rooms), limited-service hotel – Typical organizational chart:
Manager
Housekeeping Manager & Staff
Front Office Manager & Staff
Bookkeeper / Accountant
Maintenance Manager & Staff
Large (350 rooms), full-service hotel – Organizational chart:
General Manager (G.M.) / Administrative assistant
Assistant G.M.
Controller
F&B Director
HR Manager
Director of Sales & Marketing
Front Office Manager
Executive Housekeeper
Chief Engineer
Hotel Departments: Line vs Staff; Revenue Centers vs Cost Centers
Line departments (directly responsible for revenues): Front Office, Food & Beverage
Line departments also responsible for property operations: Housekeeping, Maintenance & Engineering, Security
Staff departments provide technical, supportive assistance to line decision-makers: Human Resources, Accounting
Responsibilities include making recommendations to line decision-makers (but not decision-making authority for line): HR, Accounting
Revenue centers: departments that generate revenue (e.g., Front Office, F&B, also revenue from telephone services, space rental, parking, vending, golf)
Cost centers: departments that incur costs to support revenue centers (e.g., Housekeeping, Maintenance, Accounting, HR, Security)
Traveler Profiles
Business Travelers:
63% male
50% between ages 35–54
56% employed in professional or managerial positions
78% travel solo
95% make reservations ahead of time
Typical business traveler: household income ; spends per night
Leisure Travelers:
57% travel with a companion (two adults)
39% are aged 35–54 and another 39% are 55 or older
80% travel by automobile
93% make reservations ahead of time
Average household income ; typical nightly spend
Current Issues Confronting Hoteliers
Overbuilt problem: Hoteliers should reduce costs without sacrificing quality; avoid reducing service/product quality
Strategies to address labor and efficiency:
Reduce turnover levels
Increase productivity
Recruit from non-traditional labor markets (labor shortages)
Operating issues: Cost containment; increased competition
Brand overlap: More brands make it harder for consumers to differentiate; marketing challenge
Amenity creep: More amenities raise costs and may appeal to a small market subsector; online room booking increases competitiveness
Market segmentation: Focus on highly defined, smaller traveler segments
Guestroom Innovations and Technology
Innovations include:
Smart technology, robots, automatic sensors
Interactive reservation systems to secure preferred room rates
Data mining to analyze guest data and predict behavior for better marketing decisions
Yield management to match demand with room rates
Broader category: Technological issues shaping guestroom experience and revenue
Economic Globalization and the Lodging Industry
Core idea: “As goes the economy, so goes the lodging industry”
Global economic conditions influence the financial success of lodging organizations at the local, state, national, and global levels
Fun Facts
Global ADR and RevPAR by region:
Middle East and Africa have the highest ADR and RevPAR:
Asia has the lowest ADR and RevPAR:
Domestic activity: about guests stay in hotels across the country each night
More Fun Facts (Additional market context)
There are lodging properties in the USA representing over guestrooms
There are casino hotels in the US; gaming tables and slot machines account for of revenue; accommodations typically account for of revenue
There are Bed and Breakfasts (B&Bs) in the US; they typically have between 4 and 11 rooms, average of 6; 79% of owners reside on site; average room rate
There are airport hotels in the US with rooms available each night and an available inventory of room nights
Assignment – Millennial & Gen Z Hotels
Example concepts/brands targeting Millennials & Gen Z:
Moxy by Marriott
Radisson Red
Arlo Hotels
Canopy by Hilton
Tempo by Hilton
Curio Collection by Hilton
Aloft by Marriott
Even Hotels by IHG
As of Nov 2023: Top Management Companies in the World – (optional)
Management Company data (as of Nov 2023) includes many global operators with varying numbers of properties and rooms; see transcript for the full table
Management Companies and Owners – (optional)
A broader overview of ownership and management structures across the industry; reinforces the distinction between franchised, independent, management-company-affiliated, and ownership models