Price Elasticity Demand
LO:
Explain the meaning and significance of price elasticity demand (PED)
Illustrate the difference between relatively price elastic demand and relatively price inelastic demand using diagrams
calculate PED using the mid-point formula
Describe & apply a range of factor that may influence PED
law of demand states that there is an inverse relationship between P & Qd
If P increases, Qd falls (vice versa)
How much will fall/increase in P of product affect quantity demand for a product?
concept of price elasticity of dd (PED) used
PED: ratio of % change in Qd of product to % of its price
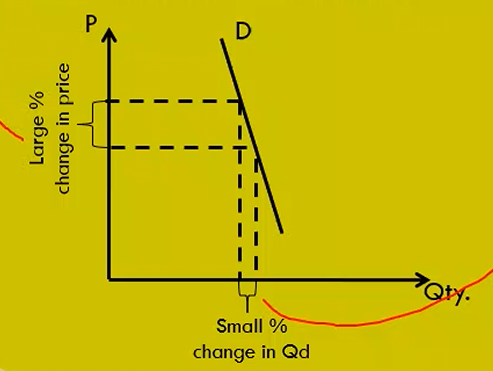
Inelastic dd
consumers not sensitive to P changes
changes in P doesn’t significantly affect Qd
e.g. 10% fall in P leads to only 5% increase in Qd
PED < 1
Firms should increase P to increase revenue
dd curve relatively steep
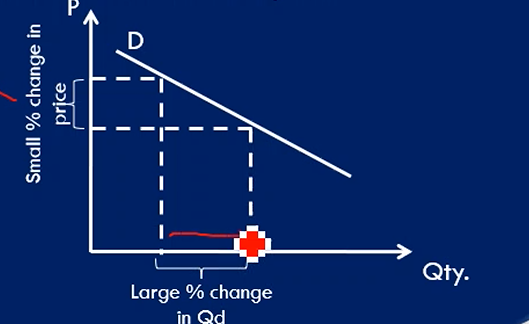
elastic dd
consumer sensitive to P changes
changes in P significantly affect Qd
10% fall in P leads to a 30% increase in Qd
PED > 1
Firms should reduce P to increase revenue
dd curve relatively flat
Measurement to determine category of elasticity
mid-point method
‘average elasticity’ between 2 price points

Total Revenue = P * Qty
Profit = Total Revenue - Total Cost
PLEASE NOTE: WE IGNORE ANY NEGATIVE SIGNS IN THIS CALCULATION AS THE NEGATIVE SIGN IS IRRELEVANT - THE FORMULA WILL ALWAYS PROVIDE US WITH A NEGATIVE ANSWER DUE TO THE NEGATIVE SLOPE OF THE DEMAND CURVE. IN ECONOMICS, WE USUALLY EXPRESS A 'PED' VALUE WITHOUT ITS NEGATIVE SIGN.
Purpose
demand is price elastic
reduce P → increase revenue
consumers sensitive to P, fall in P significantly increase Qd
increase in qty sold more than makes up for a smaller decrease in price
demand is price inelastic
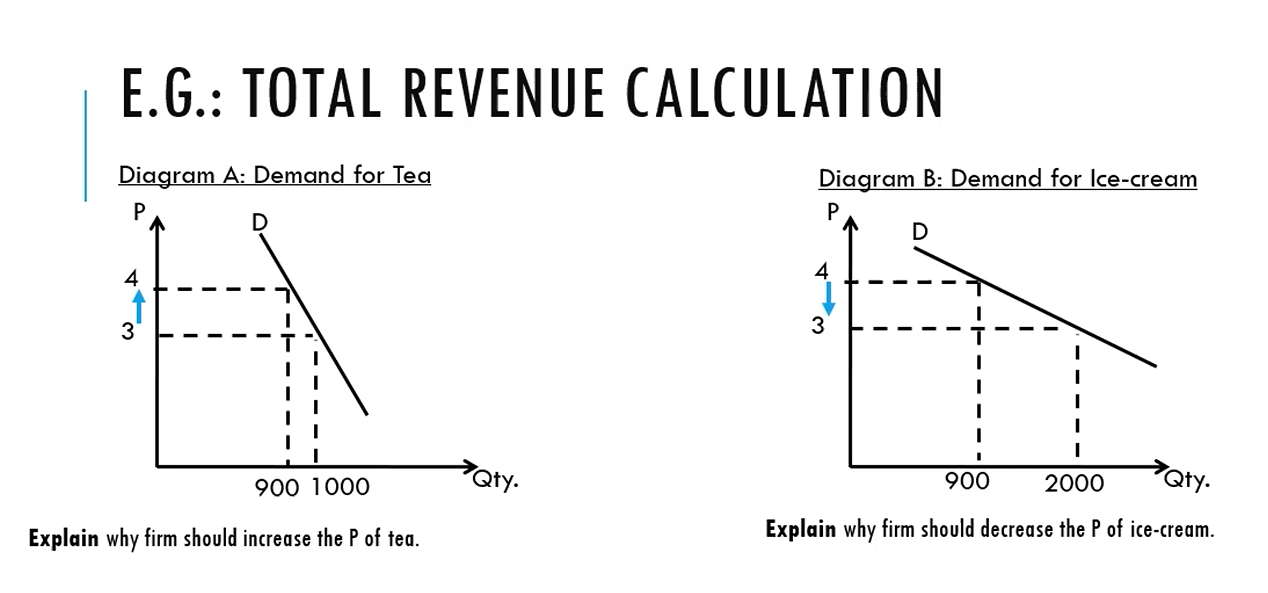
Rules to Remember (TR & PED)
Inelastic (PED < 1) → ↑P = ↑TR
Inelastic (PED < 1) → ↓P = ↓TR
Elastic (PED > 1) → ↑P = ↓TR
Elastic (PED > 1) → ↓P = ↑TR
Factors affecting PED
1. S = Substitutes
More substitutes → more elastic demand (consumers can switch).
Fewer substitutes → more inelastic.
Example: Ford cars (elastic) vs cars in general (inelastic).
2. P = Proportion of Income
Expensive items (big % of income) → elastic (price change matters).
Cheap items (small % of income) → inelastic.
Example: Cars (elastic) vs Bread (inelastic).
3. L = Luxury or Necessity
Necessities → inelastic (must buy even if price rises).
Luxuries → elastic (easy to cut back).
Example: Rice (inelastic) vs Party hats (elastic).
4. A = Addictiveness
Addictive → inelastic (people buy no matter what).
Non-addictive → elastic.
Example: Cigarettes (inelastic) vs Orange juice (elastic).
5. T = Time
Short run → inelastic (no time to adjust).
Long run → elastic (can find substitutes, change habits).
Example: Petrol today (inelastic) vs Petrol in long run with electric cars (elastic).
Good/Service | S | P | L | A | T | Overall |
|---|---|---|---|---|---|---|
Soft drink | Many substitutes → elastic | Low proportion → inelastic | Luxury → elastic | Mild addiction → inelastic | Delayable → elastic | Elastic |
Insulin | No substitutes → inelastic | High proportion → elastic | Necessity → inelastic | Not addictive → elastic | Must buy now → inelastic | Inelastic |