Chapter 4: Supply and demand
Markets and Competition
Competitive market: a group of buyers and sellers
- The market is so large that no one buyer or seller has a significant impact on it. So buyers and sellers are price takers
Price takers: can not choose the price they buy or sell at.
- The goods or services are similar or virtually the same.
Demand
- The concept is used to understand the behaviour of buyers and how they respond to changes in price and other variables
Quantity demanded: the amount of a good or service consumers are willing to buy at a certain price
Law of demand: as prices rise for a good or service consumers demand a lower quantity
Individul Demand curve
- We use tables to show how much consumers are willing to buy at a certain price
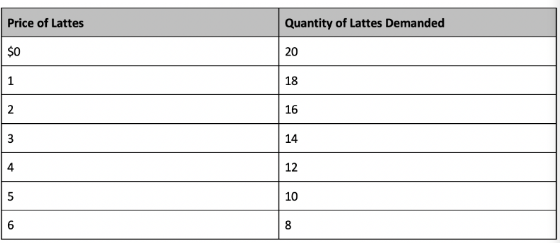
- It is more common to plot these points on a graph where the y-axis is generally the price and the x-axis is the quantity. This graph is the demand curve
Market demand curve
market demand: the sum of individuals’ quantity demanded
- If one buyer wants 2 lattes for $4, and at the same price another buyer wants 1 the market demand would be 3
Shifts in the demand curve
- Other things than price impact the quantity demanded. these are called “non-price” factors.
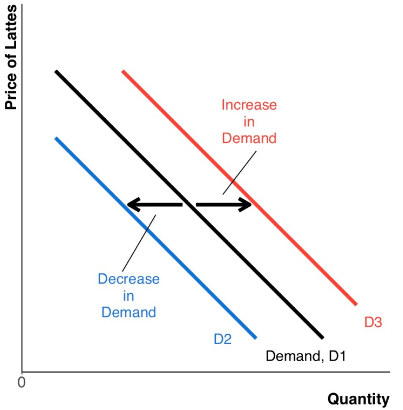
- A decrease in demand shifts the curve left and an increase shifts it right.
What shifts the demand curve?
- The number of buyers. As there are more buyers in the market there is an increase in demand which will shift the curve right
- buyers’ income. We classify goods into two groups; Normal goods, where the demand goes up when buyers increase goes up, and Inferior goods; where the demand goes down when buyers’ income increases so things like boxed meals or taxis.
- Prices of related goods.
- Some goods are substitutes. That means you can use one in place of another. Hamburgers and hotdogs are good examples, so if the price of hamburgers goes up we would expect to see an increase in hotdog sales.
- Sometimes goods are complements if a rise in the price of one good causes a decrease in demand for both. In hamburgers and ketchup are compliments and the price of hamburgers increases we would expect the sales of both hamburgers and ketchup to fall.
- Buyers’ tastes or preferences. Changes in consumer preferences can increase or decrease the demand for a good. If we see doctors say coffee causes cancer we would see the demand for coffee shift left.
- Buyers Expectations. When people think something in the market might happen in the future that may change their demand for goods today. Two examples are predictions on prices and on buyers’ income. If buyers expect the price of a good to rise in the future this will cause the demand curve to shift right before prices go up. If buyers expect their incomes to increase in the future this causes the demand for current goods to shift right. I.e. if you have more money you are going to spend more money.
Supply
- We use the concept to understand sellers
Quantity supplied: the amount of a good or service a seller is willing to sell for a certain price.
law of supply: as a price rises for a good or service, the quantity supplied by sellers will increase.
Individual Supply curve
- How much quantity is willing to be sold for a certain price is put into a table and then graphed.
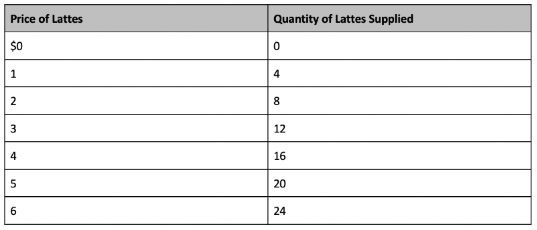
- This table shows how many lattes it would sell for a certain price.
- The supply curve is upward sloping as the more something is worth the more sellers will want to sell it for.
Market supply curve
market supply: the sum of the individual seller’s quantity at each price.
- If one seller will sell 4 lattes for $6 and another will sell 3 for the same price the total market supply will be 7 lattes at the price of $6.
What shifts the supply curve?
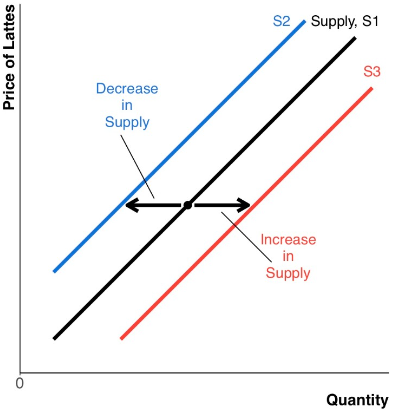
- When supply increases the curve shifts right, but when quantity supplied increases it only means that sellers are willing to sell more of a good or service.
- Input Prices and Technology. Any factor that lowers the costs for a seller will cause the supply curve to shift right. Since a drop in cost to supply the item raises profit for the seller they will have a stronger incentive to sell their good or services.
input: anything a seller uses to produce their good or service.
- Price of related goods.
There are substitutes in production which are if a seller can produce either good with the same resources. If one substitution rises, it will cause a decrease in supply for the other substitute. i.e. heating oil and gasoline as both are produced from crude oil.
Complements in production are if products are jointly being produced with the same resource. Or if the production of one good automatically causes the production of another good usually as a byproduct. i.e. beef and leather.
- Sellers expectations. If a seller expects prices to rise in the future they may withhold the quantity supplied today so they have to sell at a higher price.
- The number of sellers. As the number of sellers in the market increases, the market quantity supplied at each price will increase. Therefore, an increase in the number of sellers will shift the supply curve right.