Topic 10
When Components/Factors are Correlated
Example: mind-wandering – occurs when thoughts stray from the topic at hand to unrelated inner thoughts. Occurs in 2 ways:
Spontaneous: not under conscious control
Deliberate: under conscious control
We have 4 items on each scale. We will specify 2 factors in SPSS because this is the predicted structure.
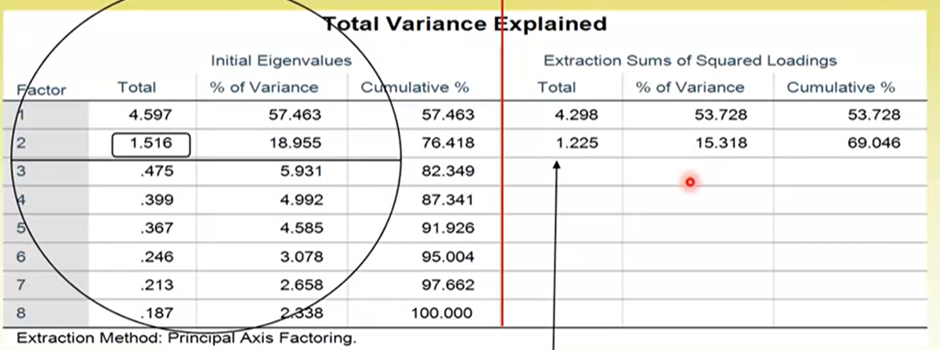
Can see this is an FA because eigenvalues are lower when the model is extracted
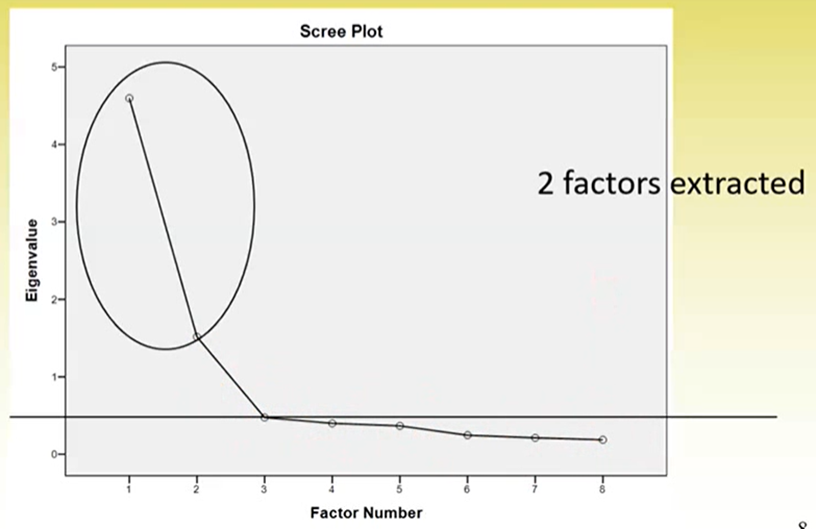
Good sign the 2 extracted factors have eigenvalues over 1 and are far higher than any other eigenvalues – confirmed in the scree plot
Factor Matrix and Factor Plot:
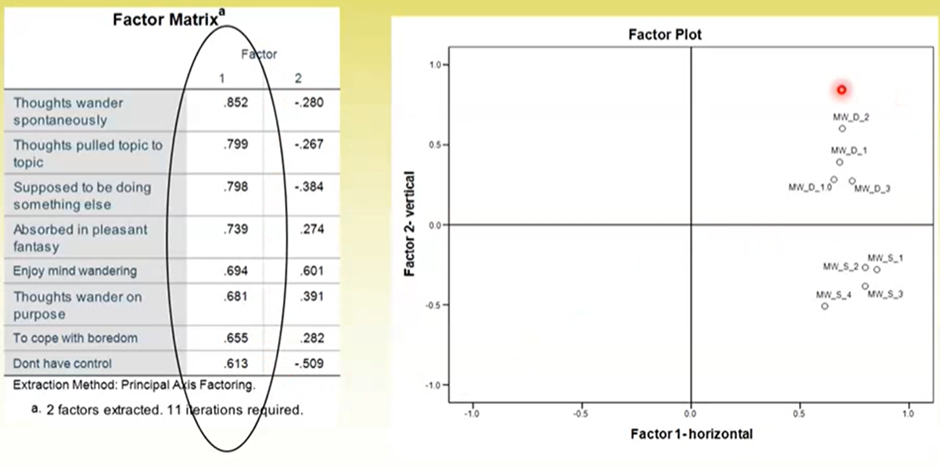
All items load highly onto factor 1 – not unexpected because the initial solution will try to maximise the variance explained by factor 1.
The factor plot does indicate two distinct groups of items. Therefore, a rotation could be used to improve factor loadings.
Varimax Rotation:
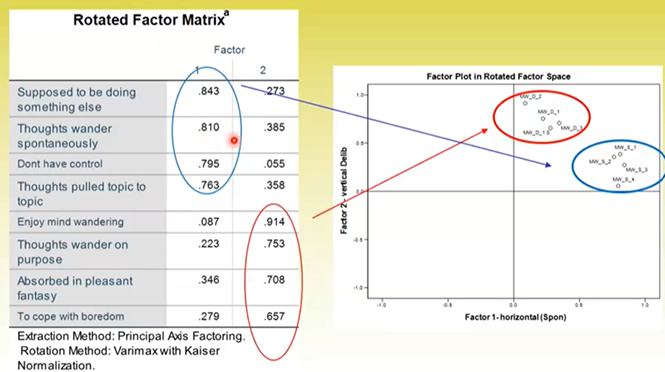
This is better, however, some items have high cross-loadings – called a complex item. This suggests there is some correlation or overlap between the factors.
Complex Items
Complex items: have a factor loading > .35 on more than 1 item in the rotated solution.
Could be tapping into a general factor
Not explanatory for a data reduction technique.
What do we do about them?
Exclude them
May suggest constructs are not independent and therefore an oblique rotation would be more appropriate
These allow for correlations between constructs
Common in psychology (e.g., depression and anxiety as components of psychopathology)
Oblique Rotation
Oblique rotation: used when components aren’t independent, and are correlated
Allows the angle between components to be less than 90 degrees – the smaller the angle, the stronger the correlation.
Move each factor independently
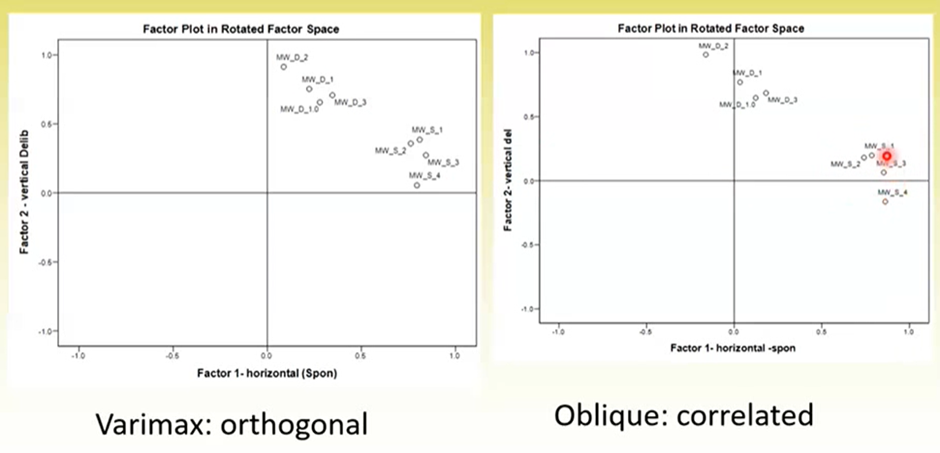
Can see the distance between the groups of items gets larger with the oblique rotation – which is ultimately what we want
Oblique Rotation Matrices include:
A pattern matrix: provides the factor loadings (excluding any unique variance)
Get a structure matrix: we do not interpret this – )
this includes shared variance (which we cannot count twice so we ignore it
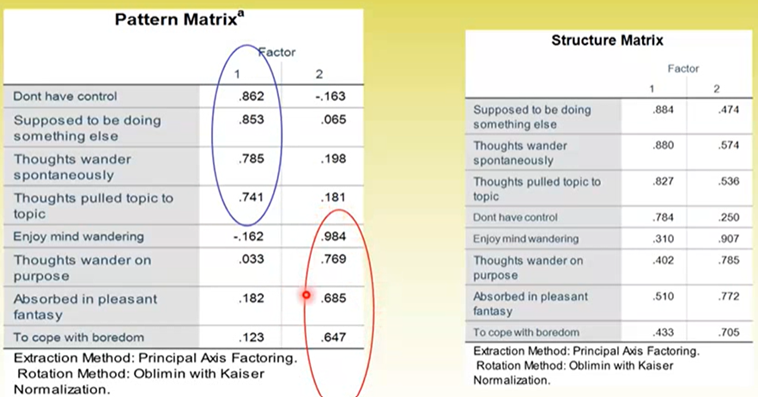
Can see there are no more complex items now
Also note loadings are higher in the structure matrix, and there are many complex items – this is because shared variance is being counted twice
Conducting an oblique rotation will also produce a factor correlation matrix, which shows the correlation between factors – this will confirm or disconfirm whether the factors are correlated.
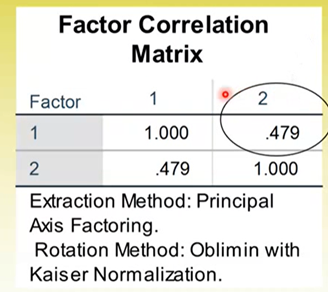
This must be reported in results.
Example Oblique Rotation (PCA):
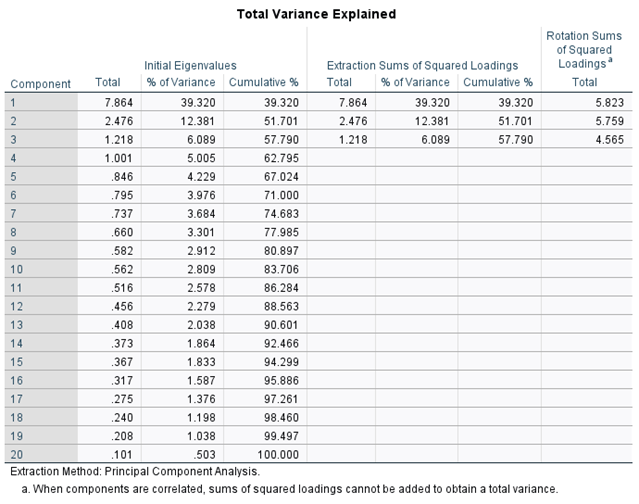
Can see unlike in varimax rotation, there is no unique variance accounted for column.
Because an oblique rotation allows for components to be correlated and therefore we cannot cleanly extract their unique variance accounted for
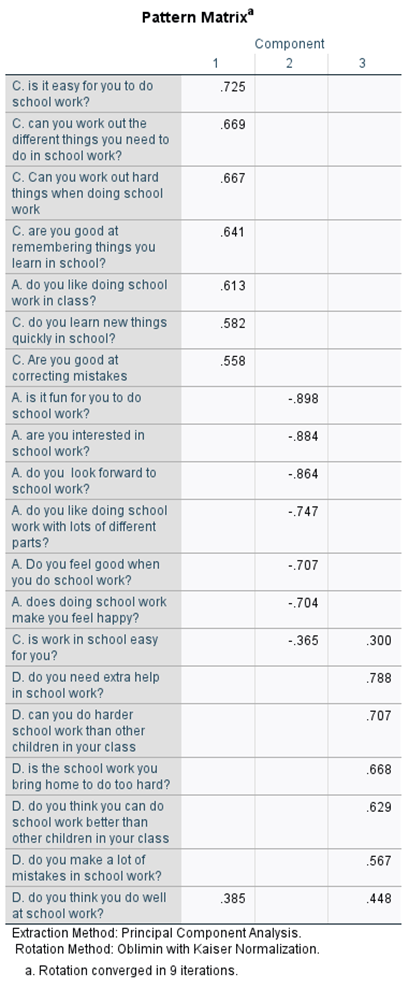
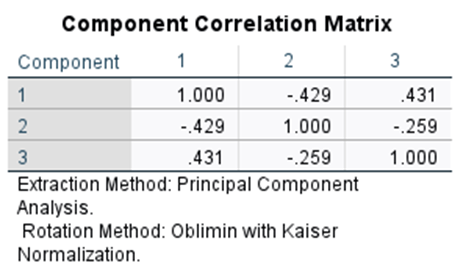
While there are some cross-loadings in this example it looks pretty good overall (these may be items worth getting rid of)
Also good to check the correlations between components, and it does appear these are correlated
Example Oblique Rotation (FA):
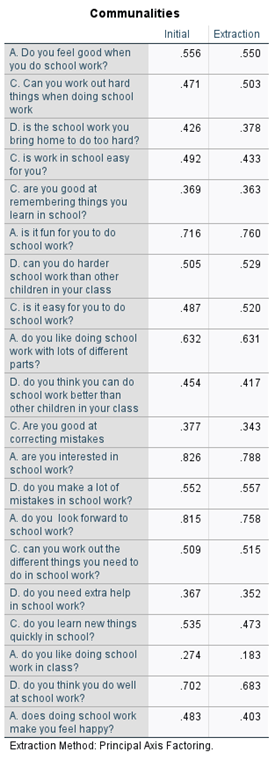
Can tell this is from an FA because the initial column doesn’t include 1s.
Because all unique variance is excluded
Can see one item has low communality, may indicate this is a unique item
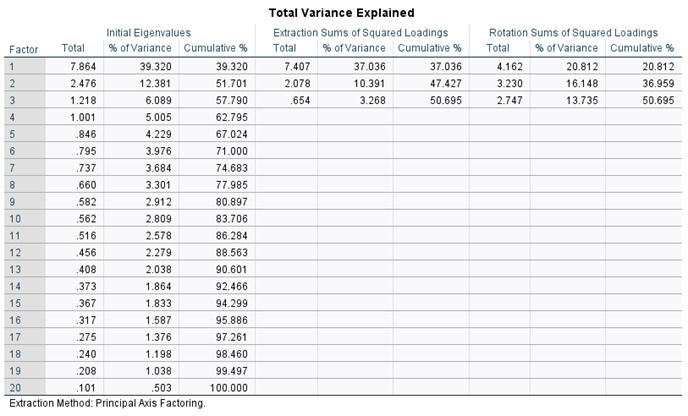
FA explains slightly less variance than PCA Can see factor total and extraction total are not the same – because extraction total excludes unique variance
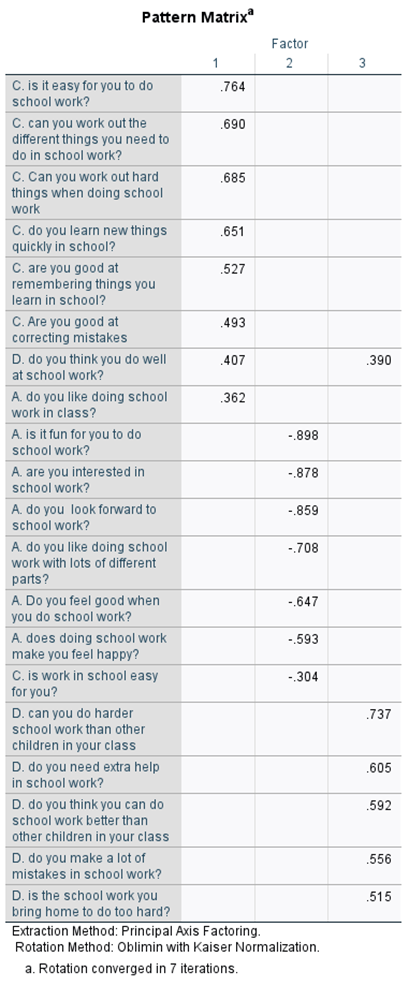
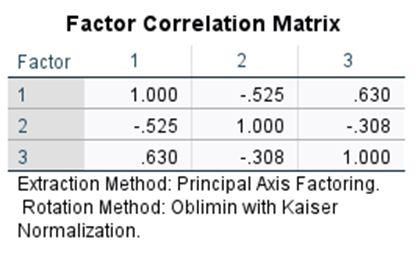
Still have a few items that have cross-loadings but definitely looks a lot better
Can also see factor are more highly correlated than on PCA which is good.
We can safely remove the items with cross-loadings at this point
After problematic items are removed:
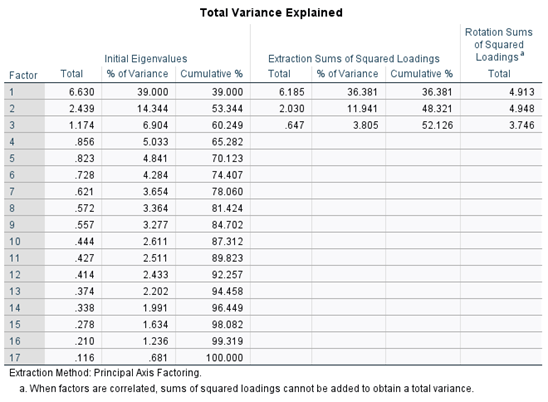
Can see there is more variance explained
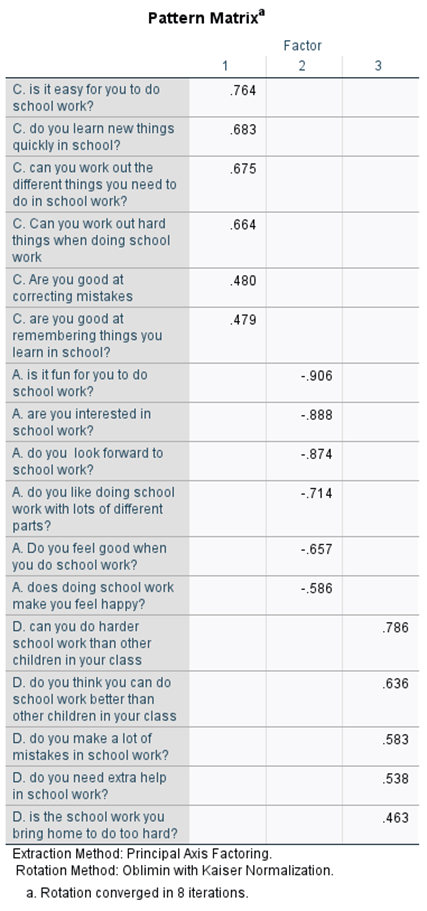
This looks heaps better
No cross-loadings
All loadings above .40
Items load onto the factor they should
Have 5 items for each factor
PCA and FA are both about testing different things and just seeing what works.
Can force different numbers of factors
Consider that items may load onto different factors than expected
If the analysis is mostly exploratory – a PCA may be more appropriate
If the analysis is more about uncovering a predicted underlying factor, FA may be more appropriate
Rarely do PCA and FA produce entirely different solutions
Orthogonal versus oblique rotation is a more considered question
Assumptions of PCA and FA:
The assumptions of PCA and FA are Bartlett’s test of sphericity and KMOs measure of sampling adequacy
Bartletts Test of Sphericity
Bartletts: determines whether there are factors or components to be extracted in the correlation’s matrix
Must be significant
Nearly always sig when n is large (which it has to be for PCA/FA)
If nonsignificant, it means there are no factors present in the correlations matrix.
Therefore there is really only one component that describes the items
Could also mean the construct is itself unidimensional
KMOs Measure of Sampling Adequacy
KMOs: describes the proportion of variance that may be described by the underlying factors for the overall solution and for each individual item
The larger the better (range from 0-1)
KMO Cutoffs - want to be above .70 at a minimum
< .5 = unacceptable
.5 - .59: very poor
.6-.69 = poor
.70-.70 = average
.8-.89 = good
.9-.99 = extremely good
A poor or unacceptable KMOs value would prompt investigation of whether the items are appropriate for the factors were trying to extract
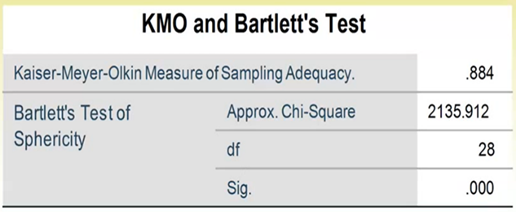
The value provided in this table is for the overall scale Sometimes, if this is poor its because of a few dodgy items
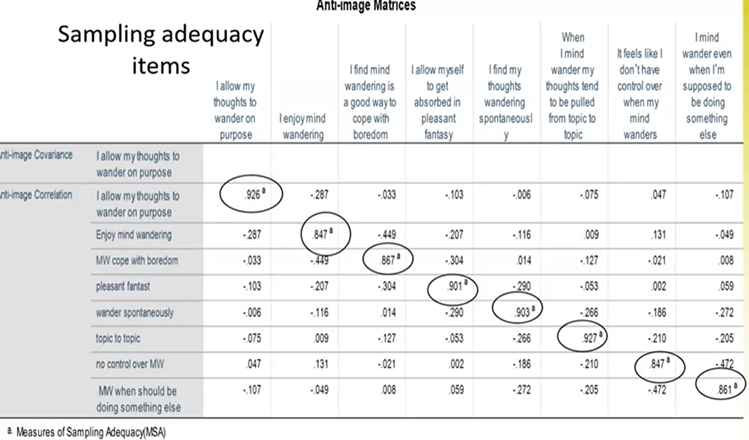
These are the KMOs values for each item.
Scales Suitable for PCA/FA
Response items for scales should have at least 3 response options (but ideally 4-5)
Because we need a good range of responses for discrimination
Cannot do a PCA/FA with dichotomous items
Non-Discriminating Items
Individual item distributions should have a range of scores so that they are discriminatory.
Most scores are the same = non discriminatory
Means there will be low correlations with other items
If an item has inter-item correlations all < .30 it should be excluded
This is because we are looking for shared variance, and low correlations means little shared variance
Means there will be poor sampling adequacy
Extreme Scores
Extreme scores also cause problems for the same reasons as non-discriminatory items.
Example of good and poor items:
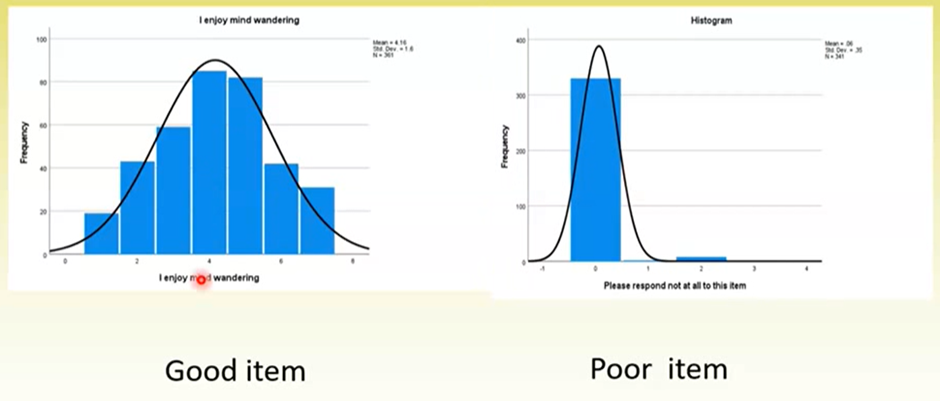
Strategy Analysis for a PCA/FA:
Inspect item distributions
Exclude items with inter-item correlations < .30
Assess sampling adequacy
Determine how many components to extract (try a few)
Should have some theoretical idea of how many
Remove items that should be discarded, and re-run the analysis
Try a new solution if needed
Check factor correlations and ensure the solution is conceptually meaningful
Interpret correct rotation
Check factor correlations
Examine internal consistency
Reliability Analysis
Factor loadings tell us the correlations between each item and its corresponding factor
Doesn’t tell us the internal consistency or reliability of these factors
PCA/FA is not viable unless we get a measure of internal consistency
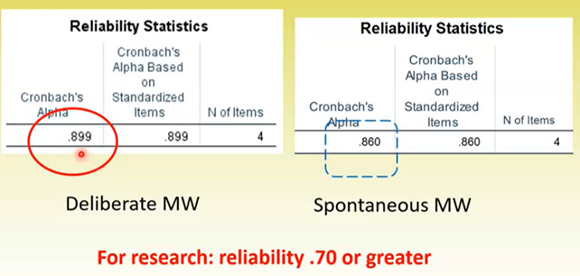
Internal consistency (Cronbach’s alpha): measures the extend to which different items on a scale are measuring a similar construct
For research: > .7
For clinical practice: > .9
Any measure should be:
Accurate
Repeatable
Able to minimise error
Measures of internal consistency measure all of these things
Cronbach’s alpha measures the internal consistency and reliability of each item on each subscale
Doesn’t measure test-retest reliability
Good reliability doesn’t equal good validity
Poor consistency can occur because of:
Small sample size
Few items on a scale
Items with too low correlations with other items
Items being coded in different directions
Cronbach’s alpha can be calculated directly for each factor (by including all items that load onto that factor)
Can also examine the item total statistics table:
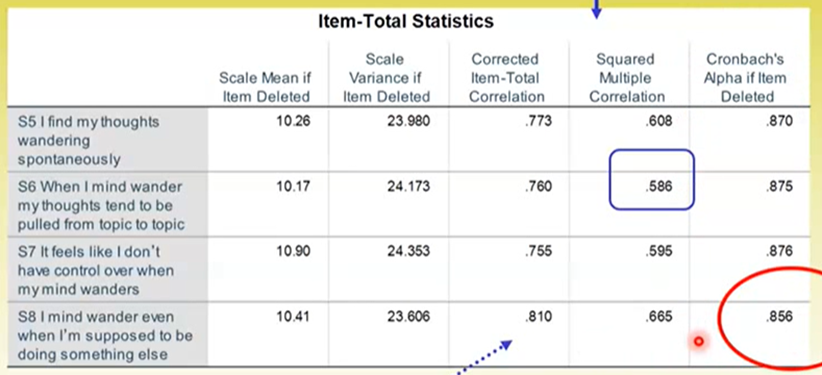
Squared multiple correlation: like tolerance – the percentage of variance in the items that is accounted for by other items in the scale
The higher this is, the less independent the items are
Corrected item-total correlation: the correlation of each item to the total score, when added up
Like factor loading
Should be > .3
Using our Components/Factors in Other Analyses
It is possible to save components generated through PCA/FA into a datafile, and use this for further analyses – though this is not recommended
This is because the linear combination are based on factor loadings, which are sample-specific.
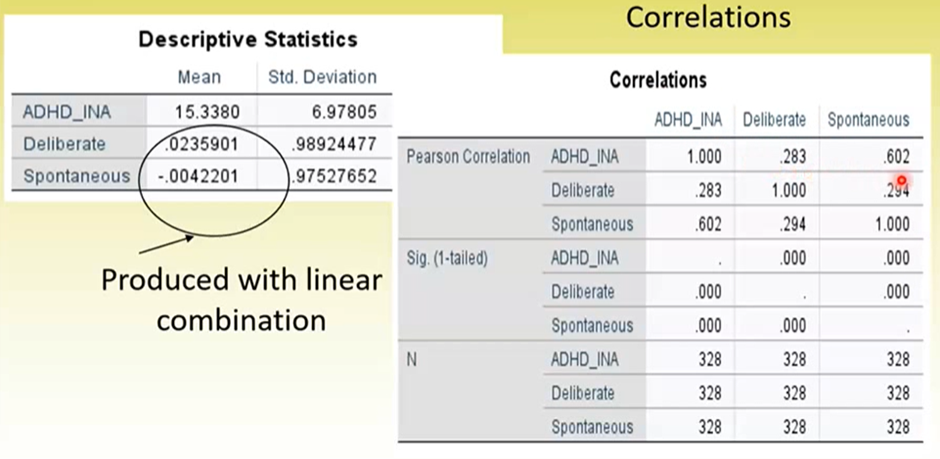
The descriptives produced for factor scores are not that meaningful either.
We can also produce item-total scores by adding up scores on the components to get a measure of the different dimensions
This is recommended
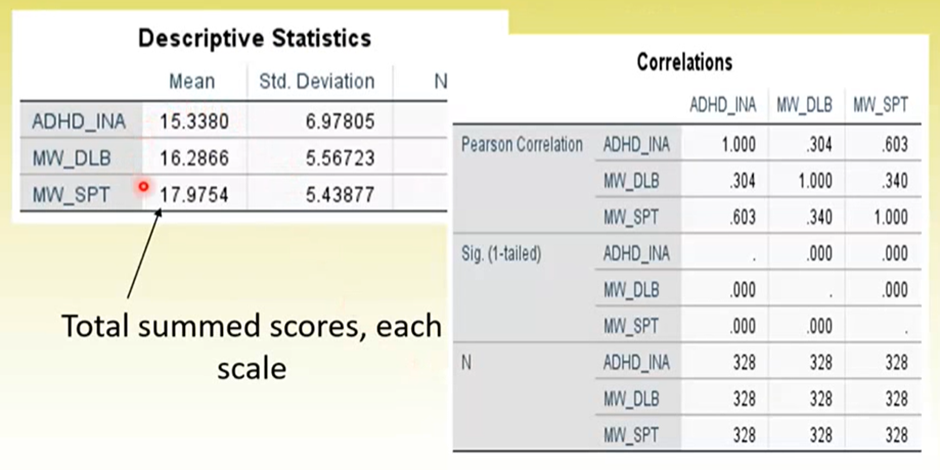
The descriptives here are much more meaningful
What to Report
Include the number of items in the final solution and how many were excluded.
State whether assumptions were met and their values
Mention the percentage of variance accounted for overall and how many factors were included
If orthogonal rotation was used: include percentage of variance for each component
Use the final solution – this should be based on conceptual meaningfulness of the outcome, not just the statistics.
Include a table with all items on each component and their loading
Describe each component and name it
Include alpha for each component