Solids liquids and gases
Units
degree Celsius (°C) → unit of temperature, used to measure how hot or cold something is; based on fixed points where water freezes at 0°C and boils at 100°C
kelvin (K) → unit of temperature used in physics, starts at absolute zero (0 K), the lowest possible temperature; temperature in K = temperature in °C + 273
joule (J) → unit of energy, measuring the amount of work done or energy transferred in processes such as heating or motion
kilogram (kg) → unit of mass, measuring the quantity of matter in an object
kilogram per metre cubed (kg/m³) → unit of density, measuring how much mass is contained in a given volume
metre (m) → unit of length or distance between two points
metre squared (m²) → unit of area, measuring the size of a surface
metre cubed (m³) → unit of volume, measuring the amount of space an object or substance occupies
metre per second (m/s) → unit of speed or velocity, describing how fast an object moves and in which direction (for velocity)
metre per second squared (m/s²) → unit of acceleration, describing how quickly velocity changes over time
newton (N) → unit of force, defined as the force required to accelerate a 1 kg mass by 1 m/s²
pascal (Pa) → unit of pressure, equal to 1 newton per metre squared; measures how concentrated a force is over an area
joules per kilogram degree Celsius (J/kg °C) → unit of specific heat capacity, measuring the energy needed to raise the temperature of 1 kg of a substance by 1°C
Density and Pressure
Density
Density describes how closely packed the particles in a substance are.
High density means particles are closely packed; low density means particles are more spread out.
Solids usually have the highest density, followed by liquids, then gases.
Density determines whether an object will float or sink in a fluid.
density = mass / volume
ρ = m / V
Increasing mass (same volume) increases density.
Increasing volume (same mass) decreases density.
Density Practical
Measure mass using a balance (ensure zero error is corrected).
Measure volume:
Regular objects: calculate using dimensions (e.g. length × width × height).
Irregular objects: use water displacement method in a measuring cylinder or Eureka can.
Submerge object fully and measure change in water level to find volume.
Calculate density using the formula.
Repeat measurements and take averages to improve reliability.
Measuring cylinder:
Put a measuring cylinder on a flat table to take a reading
Put some water in your measuring cylinder about 1/3 full
Then put your object in the measuring cylinder and read the new water level
You must read the measuring cylinder at eye level to avoid parallax error
Read the water level to the bottom of the meniscus
Eureka can
Put the eureka can on a horizontal surface so that you can catch the water that comes out of this sprout
Drop the object in and measure how much water comes out of the can
Pressure
Pressure is the force acting per unit area.
It explains why sharp objects cut more easily (small area → high pressure).
pressure = force / area
p = F / A
Increasing force increases pressure.
Increasing area decreases pressure.
The indentation is caused by when pressure is exerted by the blocks when a mass is placed on them
If the force is pread over a larger area then the pressure is smaller so the indentation is shallower
To get a high pressure, you can either have a large force, or you can concentrate the force on a small contact area
This is how sharp knives work
Units: pascal (Pa), where 1 Pa = 1 N/m².
Pressure in Fluids (Liquids and Gases)
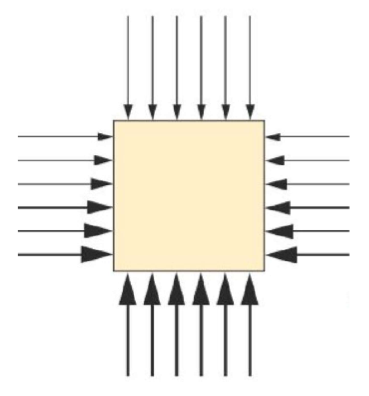
Pressure at a point in a fluid acts equally in all directions.
This is due to random motion of particles colliding with container walls.
In gases, particles move freely and rapidly, causing pressure in all directions.
In liquids, particles are close together, so pressure is transmitted throughout the fluid.
Explains why liquids can exert pressure on the sides and base of containers.
E.g. when you swim underwater the water exerts a pressure on you
The water molecules are pushing each other and on surfaces and this liquid pressure acts in all directions
Furthermore it is liquid pressure that produced upthrust, the force that keeps things afloat
If you push a balloon into a bucket of water, you can feel the water pushing back
Pressure Difference in Liquids
Pressure increases with depth because of the weight of liquid above.
The deeper you go, the greater the force from the liquid above.
pressure difference = height × density × gravitational field strength
p = h × ρ × g
h = height or depth (m)
ρ = density (kg/m³)
g = gravitational field strength (N/kg)
Greater depth → greater pressure
Denser liquid → greater pressure at the same depth
This explains why dams are thicker at the bottom and why deep-sea pressure is high
Atmospheric pressure
The Earth’s atmosphere is its outermost layer
The atmosphere is a mixture of gases and extends about 700km above the Earths surface
Atmospheric pressure at sea level is about 100000Pa or 100 kPa
However this decreases as the altitude increase
As the height above the surface (altitude) increase:
The number of gas molecules in a given volume of air decreases
The frequency of collisions with objects in the air decreases
The pressure decreases
Change of State
Energy and Heating
Heating increases the internal (thermal) energy of a system.
Internal energy consists of:
Kinetic energy (movement of particles)
Potential energy (energy stored in bonds between particles)
Energy supplied can:
Increase temperature (increase kinetic energy)
Cause a change of state (increase potential energy by breaking bonds)
Changes of State
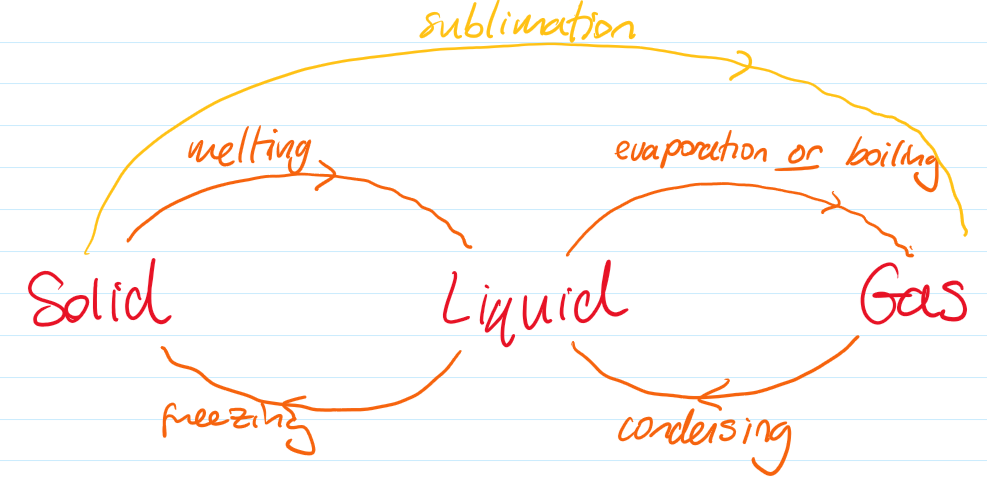
Melting: solid → liquid
Freezing: liquid → solid
Boiling: liquid → gas (throughout the liquid at a fixed temperature)
Evaporation: liquid → gas (at the surface, can occur below boiling point or at any temperature)
Condensation: gas → liquid
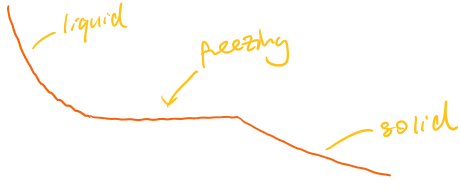
During melting and boiling, temperature remains constant because energy is used to overcome intermolecular forces.
What happens in evaporation:
The surface particles with the most KE leave the liquid
This process cools the liquid because the most energetic particles leave
The particles with less energy are left behind
The average KE decreases
The temperature in Kelvin is directly proportional to average KE of particles
This process is why sweating cools you down
Stearic acid experiment:
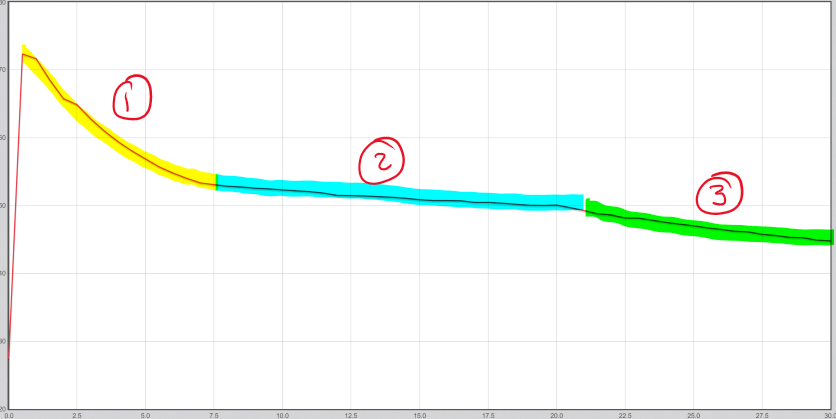
1= liquid - cooling down
2= freezing - turning from liquid to solid, temperature is barely changing as bonds are forming, heat energy is still being given off
3= Solid - cooling down
Ideal graph:
Particle Model
State | Arrangement | Motion | Energy | Properties |
|---|---|---|---|---|
Solid | Closely packed, regular lattice | Vibrate about fixed positions | Low | Fixed shape and volume |
Liquid | Close together, irregular | Move and slide past each other | Medium | Fixed volume, takes shape of container |
Gas | Far apart, random | Move rapidly in all directions | High | No fixed shape or volume |
Explanation of Changes of State
Solid to liquid (melting): particles gain energy, vibrate more, and break out of fixed positions.
Liquid to gas (boiling/evaporation): particles gain enough energy to overcome attractions and escape.
Gas to liquid (condensation): particles lose energy and come closer together.
Liquid to solid (freezing): particles lose energy and become fixed in position.
Temperature–Time Graph (Practical)
When heating:
Temperature increases steadily as particles gain kinetic energy.
Flat (horizontal) sections occur during melting and boiling.
Flat sections show energy being used to change state rather than increase temperature.
The length of the flat section depends on the amount of substance and energy supplied.
Specific Heat Capacity
Specific heat capacity is the energy required to raise the temperature of 1 kg of a substance by 1°C.
Substances with high specific heat capacity (e.g. water) require more energy to heat up.
Substances with low specific heat capacity heat up quickly.
Important in applications like heating systems and climate (oceans store heat).
Thermal Energy Equation
change in thermal energy = mass × specific heat capacity × change in temperature
ΔQ = m × c × ΔT
ΔQ = energy transferred (J)
m = mass (kg)
c = specific heat capacity (J/kg °C)
ΔT = temperature change (°C)
Increasing mass or temperature change increases energy required.
Specific Heat Capacity Practical
Measure mass of the substance using a balance.
Use an էլectrical heater to supply energy.
Measure voltage, current, and time to calculate energy supplied.
Record temperature change with a thermometer.
Calculate specific heat capacity using the equation.
Reduce errors by:
Insulating the container to reduce heat loss
Stirring to ensure even temperature
Taking repeated measurements and averaging results
Ideal Gas Molecules
Solids liquids and gases - kinetic theory
Solids:
Vibrating in fixed positions
Not compressible
Liquids:
Particles can slide over each other
Not compressible
Gases:
Rapid random motion
Easily compressible
Evidence for particle model:
Diffusion of ink happens faster in hot water than cold water
Brownian motion - smoke particles can be seen to jiggle around when hit by air particles
Perfume diffusion in air
Motion and Pressure of Gas Molecules
Gas molecules are in constant random motion in all directions.
They move in straight lines between collisions with other molecules or the walls of the container.
Collisions are elastic, meaning no kinetic energy is lost overall during collisions.
When molecules collide with the container walls, they exert a force on the walls.
This is because they change momentum and force = change in momentum/time
This exerts a small force on the container
This force acting over the surface area produces pressure.
Pressure is therefore caused by the continuous bombardment of particles on the container walls.
Increasing the number of collisions per second increases pressure.
Increasing the force of each collision also increases pressure.
Absolute Zero
Absolute zero is the lowest possible temperature: –273°C, which is 0 K.
At this temperature:
Particles have the minimum possible kinetic energy.
Particle motion effectively stops (no thermal motion).
It is a theoretical limit and cannot be reached in practice.
All temperature measurements in gas laws are based on this reference point.
Kelvin Scale
The Kelvin scale is an absolute temperature scale used in physics.
It starts at absolute zero (0 K).
There are no negative values on the Kelvin scale.
One Kelvin represents the same temperature change as one degree Celsius.
temperature (K) = temperature (°C) + 273
Kelvin is used in gas equations because it is directly proportional to particle energy and motion.
Temperature and Speed of Molecules
Increasing temperature increases the average kinetic energy of gas molecules.
This results in an increase in their average speed.
Faster-moving molecules:
Collide more frequently with the container walls
Collide with greater force
This leads to an increase in pressure if volume is kept constant.
Decreasing temperature has the opposite effect, reducing speed and pressure.
Temperature and Kinetic Energy
The Kelvin temperature of a gas is directly proportional to the average kinetic energy of its molecules.
This means:
If temperature doubles (in Kelvin), average kinetic energy also doubles.
This relationship explains why temperature must be measured in Kelvin for gas calculations.
It links microscopic particle behaviour to macroscopic properties like pressure.
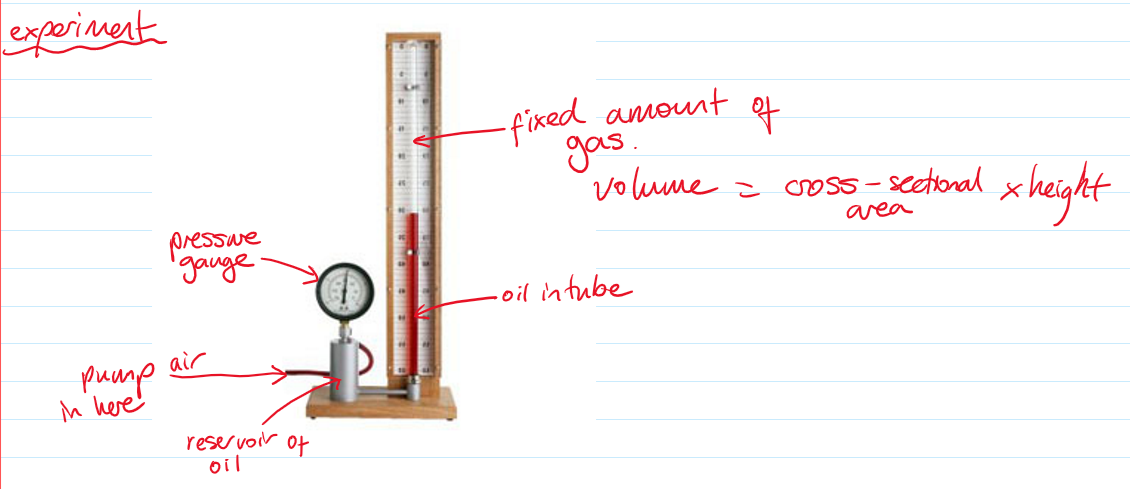
Pressure and Volume (Constant Temperature)
Boyle’s law:
The gas in the tube is trapped, so the number of gas particles doesn’t change
When air is pumped in on the left, the gas is compressed
The pressure gauge tells us the pressure
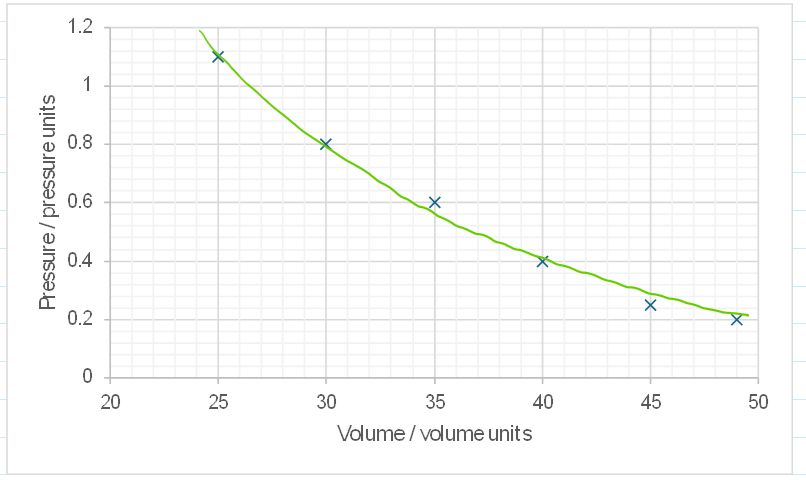
Graph and analysis:
If pressure increases, volume decrease
It is not linear
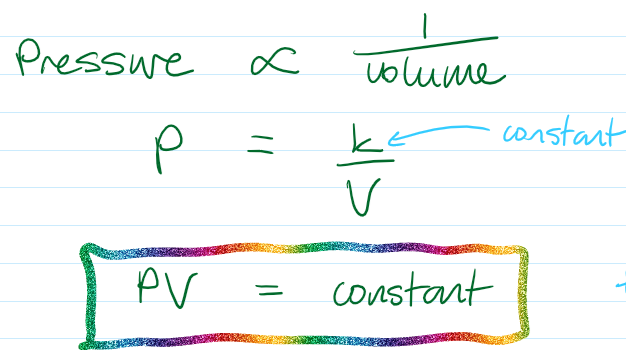
Pressure is indirectly proportional to volume
For a fixed mass of gas at constant temperature:
Pressure is inversely proportional to volume.
Increasing volume decreases pressure.
Decreasing volume increases pressure.
Explanation:
Larger volume → particles have more space → fewer collisions with walls → lower pressure
Smaller volume → particles are closer together → more frequent collisions → higher pressure
p₁V₁ = p₂V₂
How to use this equation:
pV is constant for a particular setup (it is not always the same value)
Pressure and Temperature (Constant Volume)
Pressure law:
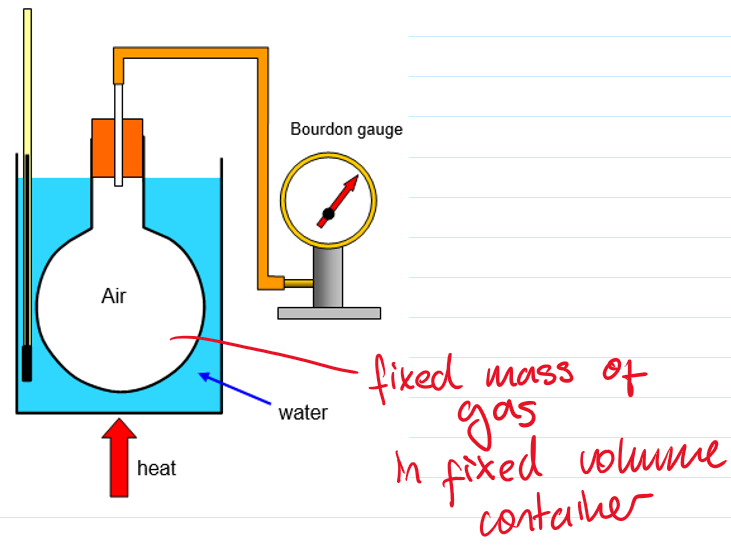
Graph and analysis:
The graph is a straight line
It does not go though the origin if the temperature is in celcius
But at 0 Kelvin, the pressure is zero as the gas particles are not moving so they don’t collide with anything
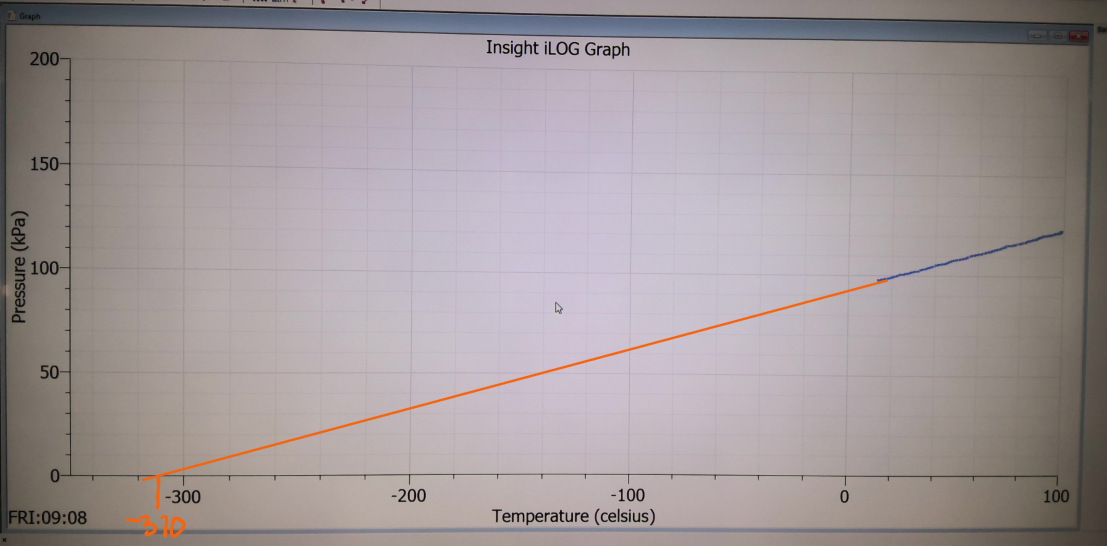
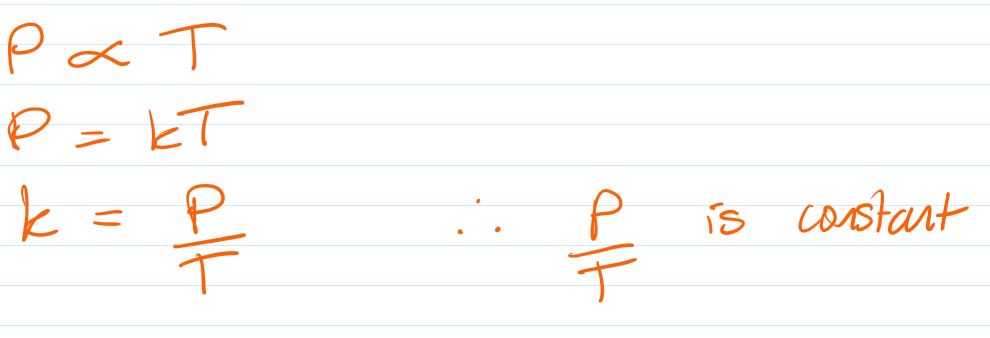
For a fixed mass of gas at constant volume:
Pressure is directly proportional to temperature (in Kelvin).
Increasing temperature increases pressure.
Decreasing temperature decreases pressure.
Explanation:
Higher temperature → particles move faster → collisions are more frequent and forceful → pressure increases
If temperature decreases towards absolute zero, pressure also decreases.
p₁ / T₁ = p₂ / T₂
For this equation to work you need:
Temperature in K
Volume of gas must be constant
Number of gas particles must be constant
Combined Understanding of Gas Behaviour
Gas pressure depends on:
Speed of particles (linked to temperature)
Frequency of collisions (linked to volume and number of particles)
Force of collisions (linked to kinetic energy)
These relationships assume:
A fixed mass (constant number of particles)
No loss of gas from the container
Real gases behave approximately like ideal gases under many conditions, especially at low pressure and high temperature.
Graphical Relationships
Pressure–volume graph (constant temperature):
Curve that slopes downwards (inverse relationship).
Pressure–temperature graph (constant volume):
Straight line through the origin when plotted in Kelvin.
These graphs help visualise how gas variables are related.