Saving and Investment Part 2
Definitions of Saving and Investment
Saving in economics (macro) is different from everyday understanding.
- Definition of Saving:
- Saving occurs when an individual spends less than their income.
- The excess income can be used to:
- Buy stocks or bonds
- Deposit into a savings accountCommon Misconception: Buying stocks and bonds is often considered investing, but in macroeconomics, this is classified as saving.
Investment in Macroeconomics
Definition of Investment:
- In macroeconomics, investment refers to the purchase of new capital equipment, inventories, or structures.
- This does not include buying stocks or bonds; these are categorized under saving.
National Saving
National Saving:
- National saving can also be referred to simply as saving, but it is comprised of two components:
- Private Saving ( ext{S}{private}) - Public Saving ( ext{S}{public})
- Formula:
Calculating Private and Public Saving
Private Saving Calculation:
- Determined by the formula:
- Where:
- = income or GDP
- = taxes
- = consumption
- Private saving represents the income remaining after taxes and consumption expenses.Public Saving Calculation:
- Defined as the difference between the government’s tax revenue and its spending:
- Where:
- = government spending
- The overall public savings equation considers budget surpluses and deficits:
- If T > G, it's a budget surplus.
- If T < G, it's a budget deficit.
Overall Saving Formula
To compute full saving including both private and public, the global formula becomes:
S = Saving
Implication: When laying out the budgets, if the public sector has a deficit, it can negatively impact overall saving and investment.
Closed Economy vs. Open Economy
Open Economy:
- Engages in trade with other countries. The GDP formula here is:
Y = Gross Domestic Product (GDP)
CC = Consumption: The total value of all goods and services consumed by households.
II = Investment: The total spending on capital goods that will be used for future production. This includes business investments and residential construction.
GG = Government Spending: The total government expenditures on goods and services. This does not include transfer payments like pensions or unemployment benefits.
NXNX = Net Exports: The value of a country's exports minus its imports. This figure can be positive (trade surplus) or negative (trade deficit).
Y=C+I+G+NXY=C+I+G+NX v
- Where = net exports.
Closed Economy:
- No interaction with other countries, removing from considerations:
- Investment can be isolated using:
- This means that saving and investment are equal in a closed economy:
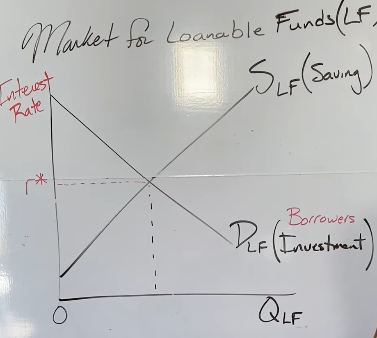
Market for Loanable Funds
The market for loanable funds consists of:
- Supply: Funds from savers.
- Demand: Funds needed by borrowers looking to invest.
- The interest rate is the price of borrowing funds, typically referred to as the real interest rate.
Shifts and Movements in the Market
Movement along the Curve:
- Changes in interest rates lead to movements along the demand and supply curves.
- If interest rates increase:
- Demand for loanable funds decreases (less borrowing).
- Supply increases (more saving).
- If interest rates decrease:
- Demand increases (more borrowing).
- Supply decreases (less saving).\
Policy Implications for Saving and Investment
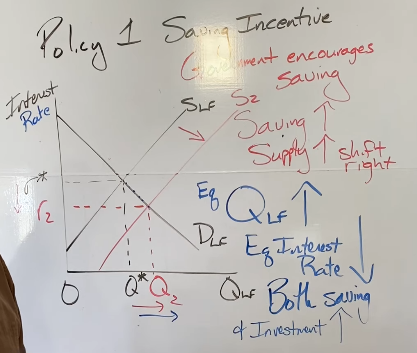
Policy One: Saving Incentive
- Government encourages saving through various means.
- Increases supply of loanable funds, shifting the supply curve to the right.
- The new equilibrium shows a decrease in interest rates and an increase in the quantity of loanable funds, boosting both
saving and investment.
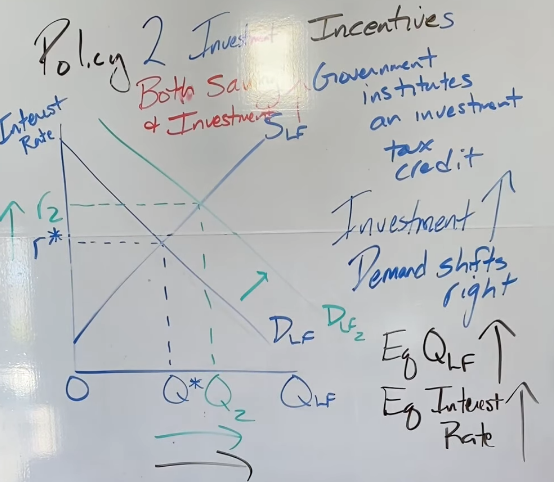
Policy Two: Investment Incentive
- Government offers tax credits for investment, pushing demand for loanable funds to the right.
- This leads to increased investment first, followed by changes in saving in response to rising interest rates.
Policy Three: Budget Deficit
- A budget deficit occurs when government spending (G) exceeds tax revenue (T), representing negative public saving.negative T < G Buget Deficit
- The supply of loanable funds decreases, leading to increased interest rates.
- This results in reduced quantities of both saving and investment due to the crowding-out effect:
- Borrowers cannot afford higher interest rates, leading to decreased investment choices.
- Crowding out leads to a drop in overall economic growth prospects.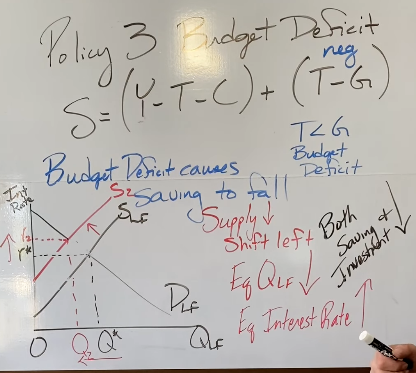
Conclusion
Saving and investment are tightly interrelated; an understanding of their definitions in macroeconomics is essential.
The dynamics of loanable funds and how different policies can affect saving and investment behaviors have substantial implications for economic growth.
Comprehensive grasp of these principles will aid in preparing for examinations and practical financial assessments.
The supply of loanable funds comes from savers, who lend directly by purchasing bonds or indirectly by depositing with banks. The interest rate reflects the return on savings. The supply curve slopes upward: as interest rates rise, supply increases; when rates fall, supply decreases as saving becomes less attractive.