ALGEBRA
Descriptive Statistics
Measures of Central Tendency (where the data “sits”)
Mean (average) – The balance point of the data; pulled by outliers.
Median (middle value) – The central value when ordered; not affected by extremes.
Mode (most common value) – The value that appears most often.
2. Measures of Spread / Dispersion (how spread out the data is)
Range (max − min) – How wide the data is overall.
Variance – How far values spread from the mean, on average (squared units).
Standard Deviation – Typical distance from the mean; variance in original units.
Interquartile Range (IQR) – Spread of the middle 50% of the data; ignores outliers.
3. Measures of Position (where a value stands)
Minimum – The smallest observed value.
Maximum – The largest observed value.
Quartiles (Q1, Q2, Q3) – Cut the data into four equal parts.
Percentiles – Show the percentage of data below a value.
4. Measures of Shape (how the data looks)
Skewness – Tells if the data leans left or right.
Kurtosis – Tells how heavy the tails are (outlier-prone or not).
5. Counts / Frequency
Count (n) – Number of observations.
Frequency – How often values occur.
Vectors
List of attributes of an object
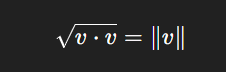
We can get the size of a vector by taking the square root of the dot product:
Vectors have the associativity property : A+B = B+A
Dot product is commutative and distributive over addition and associative over scalar multiplication
A*B=B*A
r.(S+T)= rS+rT
a*rs= r*as
Cosine Rule - (2 sides + angle)
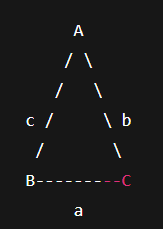
a²= c²+b² -2bcCosA
c.b = |c|. |b|CosA
The Identity matrix is the matrix that does not change a vector when multiplied by it for example 1 0
0 1
Inverse of A * A = Identity Matrix