t-tests
Comparing two means
- common and fundamental testing paradigm
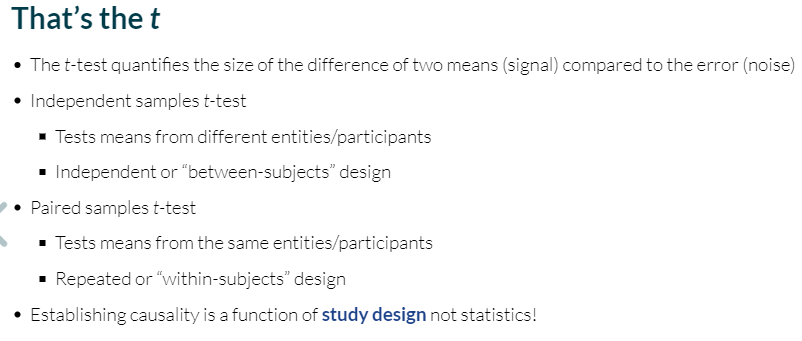
- two types
- independent - different entities/participants in each group
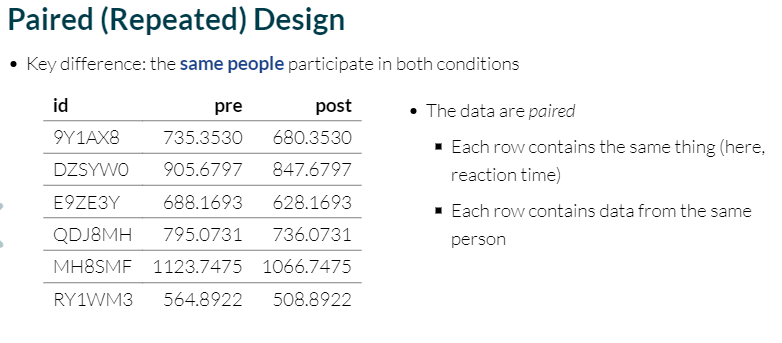
- paired - same entities/participants in both groups
Independent samples t-tests
- tests the null hypothesis that two samples come from the same population (i.e. Mdiff = 0)
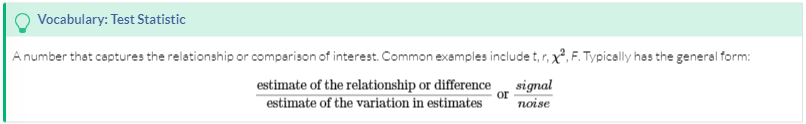
- calculate the test statistic t, which expresses signal-to-noise ratio
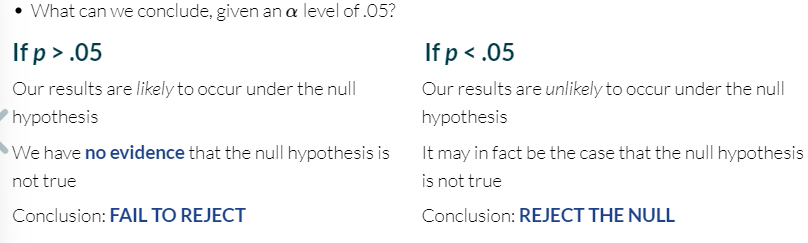
- Then, evaluate the probability p of obtaining t of this size (or larger) under the null hypothesis
- If p < α, we might conclude that group membership is associated with some difference
Steps of analysis
- calculate the test statistic t (signal-to-noise ratio)
- signal - the difference in means
- noise - the variation in mean differences
- compare that test statistic to its distribution under the null hypothesis
- obtain the probability p of encountering a test statistic of the size we have, or larger, assuming the null hypothesis is true
calculating the test statistic: the signal
- the signal is the relationship of interest - it is the the variation in scores explained by group membership
- method:
- calculate the mean of each group
- subtract one mean from the other
- the size of the difference in means is the signal
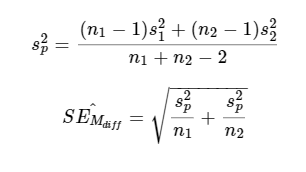
calculating the test statistic: the noise
- the noise is the standard error (i.e. the variation not explained by group membership)
- it is an estimate of how different we expect any two sample means to be from the same population
- the differences in means have a sampling distribution that is exactly analogous (comparable) to the sampling distribution of the mean
compare that test statistic to its distribution under the null hypothesis
Paired samples t-tests