02.04 Price Elasticity of Supply
Elasticity of Supply: Detailed Notes
Introduction to Elasticity of Supply
Concept: Elasticity of supply measures how much the quantity supplied of a good or service responds to a change in its price.
Analogy: If a neighbor offers $1 per bag of leaves, you might rake a few. If they offer $50, you'd rake every leaf you could find.
Law of Supply: As price increases, the quantity that producers are willing to supply also increases.
Elasticity's Role: Elasticity explains how much more suppliers will provide for each unit increase in price.
Calculating Elasticity of Supply
Formula: Identical to the price elasticity of demand formula, but uses the change in quantity supplied (Qs).


Midpoint Formula: Can also be used for elasticity of supply.
Elasticity Coefficient: The result of the above division. It indicates the price elasticity of supply.
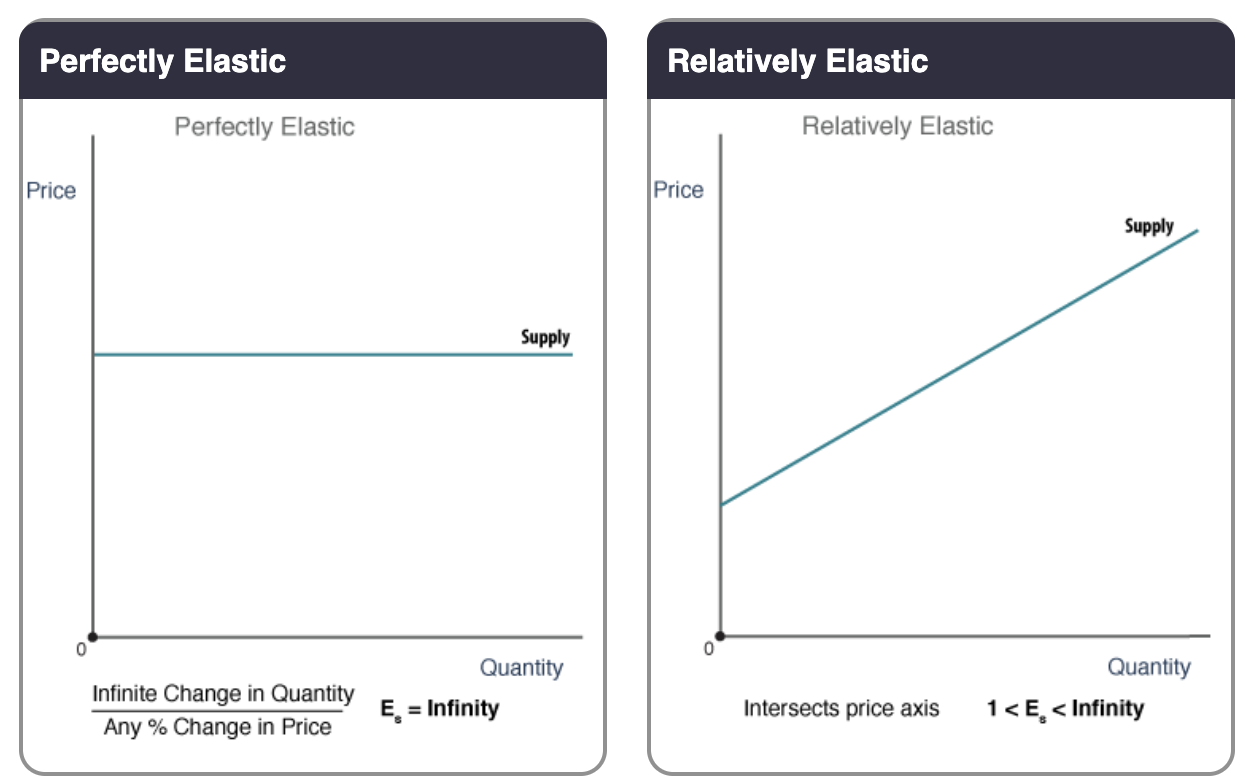
Supply Curve Elasticities: Visual Representation
Perfect Elasticity and Perfect Inelasticity: Look the same for both supply and demand curves.
Key Difference: The three graphs in the middle (elastic, inelastic, unit elastic) are different for supply and demand because price and quantity supplied have a direct (positive) relationship, whereas price and quantity demanded have an inverse (negative) relationship.
Interpreting Perfectly Elastic and Inelastic Supply
Perfectly Elastic Supply:
Any price above the line results in suppliers willing to supply an infinite quantity.
Any price below the line means suppliers won't supply anything (quantity supplied falls to zero).
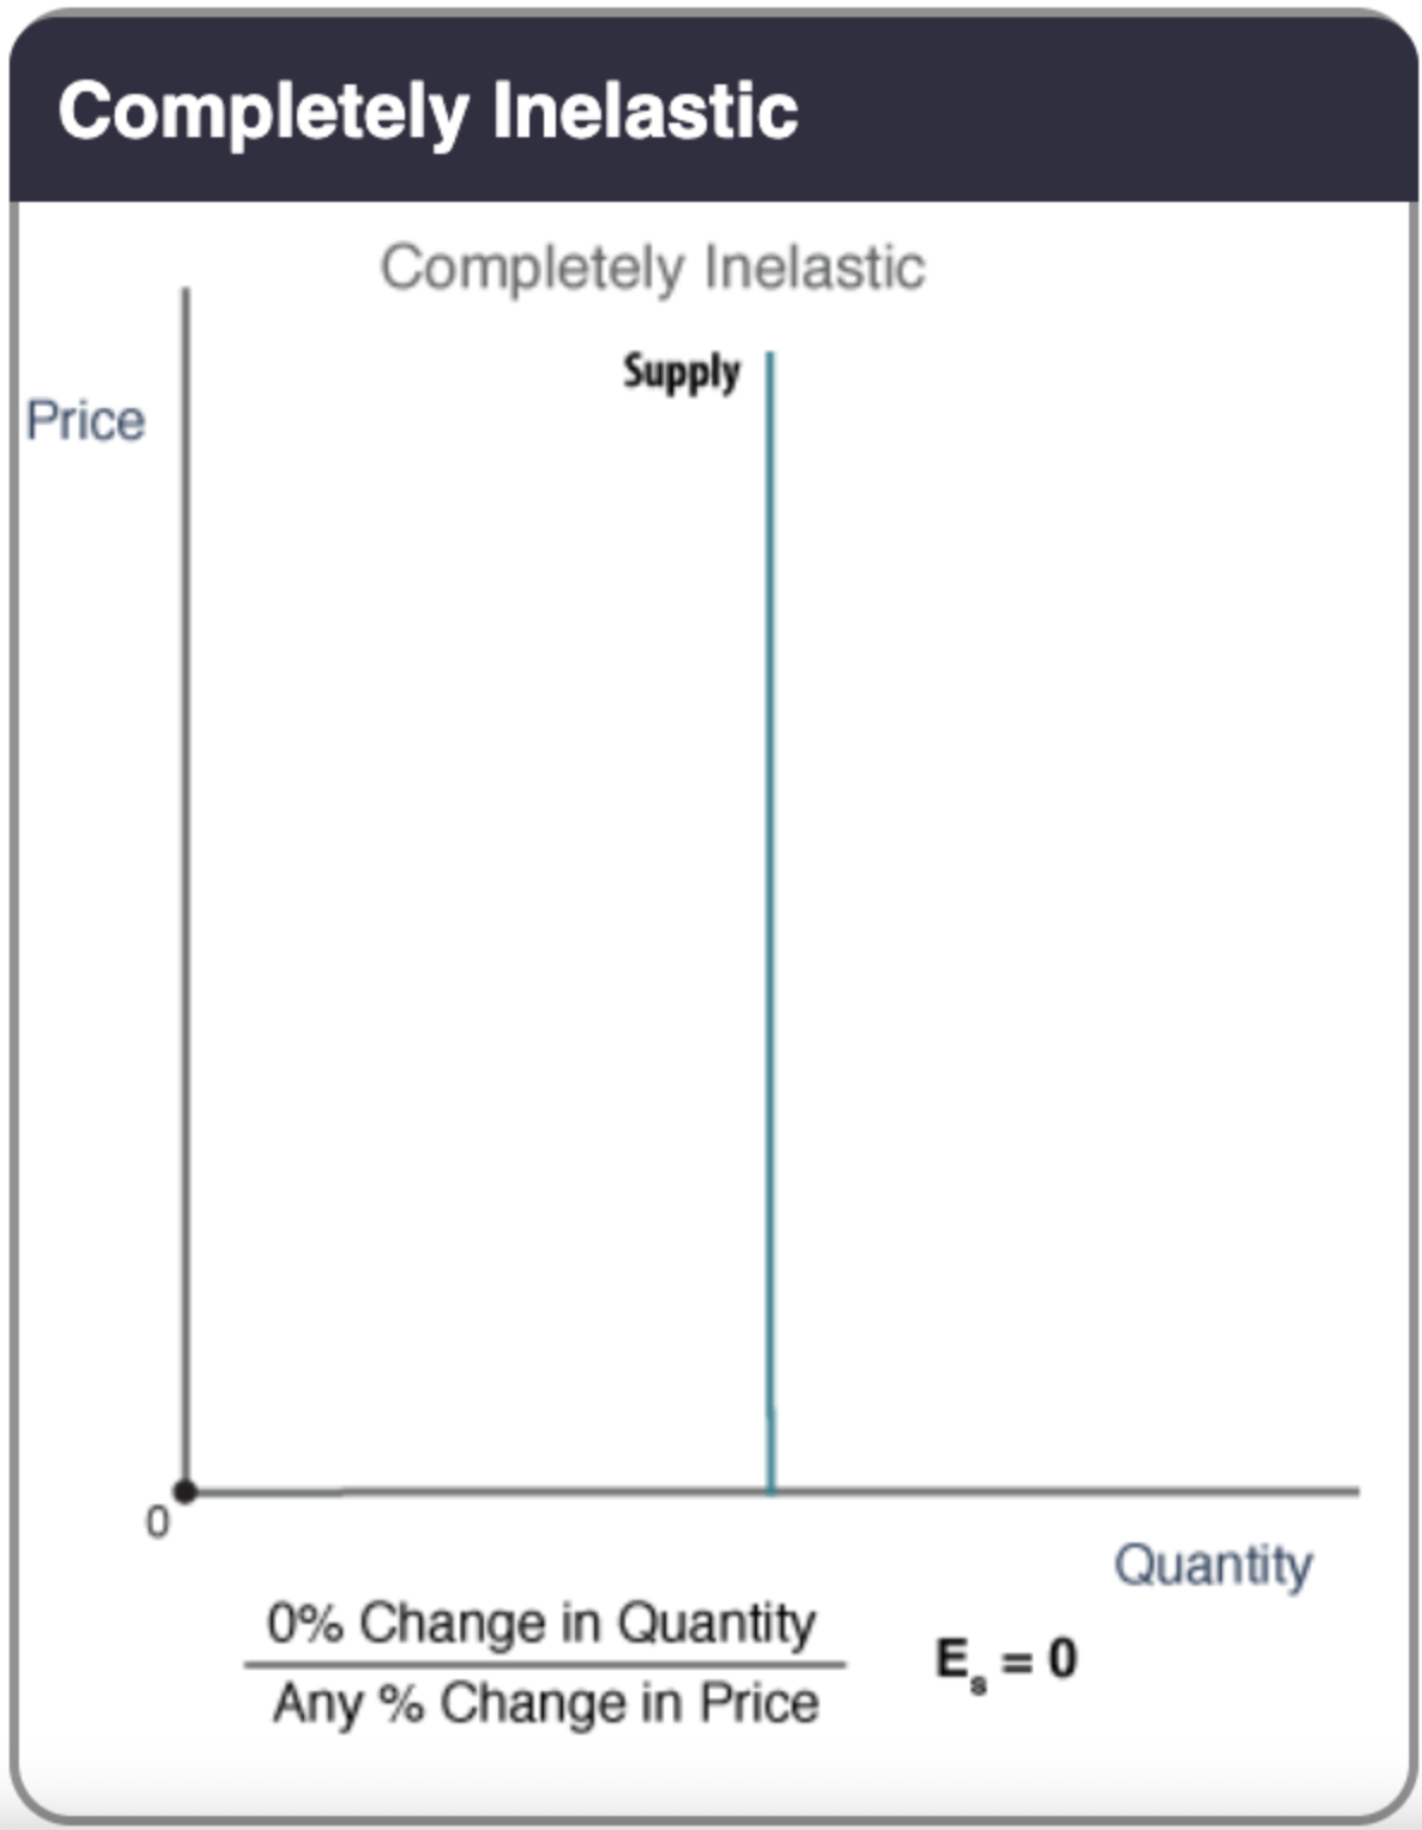
Perfectly Inelastic Supply: Quantity supplied remains constant regardless of price.
What Affects Suppliers? Determinants of Elasticity of Supply
Key Determinants: Input availability and time.
Profit Maximization: Businesses will supply more of a good if they can charge more for another unit, unless the cost of producing that unit exceeds the revenue gained.
Additional Considerations
Input Market Share: How much of the market for their inputs a good's supplier represents.
Example: Automakers and palladium. Automakers use a significant portion of the palladium supply, so increased car production affects the price of palladium.
Geography and Transportation: The cost of transporting goods to market (especially relevant for perishable items).
Example: Tropical fruit suppliers must consider the cost of transporting ripe fruit to market.
Time as a Resource
Time Constraint: Time is a major constraint on supply elasticity.
Example: If the market price for a handcrafted item increases dramatically, producers are limited by the number of hours they have to produce. Similarly, soybean prices depend on growing time.
Countering Time: Suppliers can add resources to reduce time to market or increase production possibilities.
Which is More Elastic? Examples
Toothpicks vs. Laptops: Toothpicks are more elastic. Toothpick suppliers can scale up production more easily due to lower resource costs.
Original Art by Michelangelo vs. Cruise Ships: Cruise ships are more elastic. The supply of Michelangelo's art is nearly perfectly inelastic (fixed).
Hamburgers vs. Hotel Rooms: Hamburgers are more elastic. Fast food production is faster than hotel construction, and input costs for hamburgers are lower.
The Supply Graph: Key Differences from Demand
Demand Curves:
Typically intersect both the price (y) and quantity (x) axes (except for perfectly elastic and inelastic cases).
Have a price point where no one will buy, and a quantity where marginal benefit is zero.
Constant-slope demand curves are half elastic and half inelastic, with the unit elastic point in the middle.
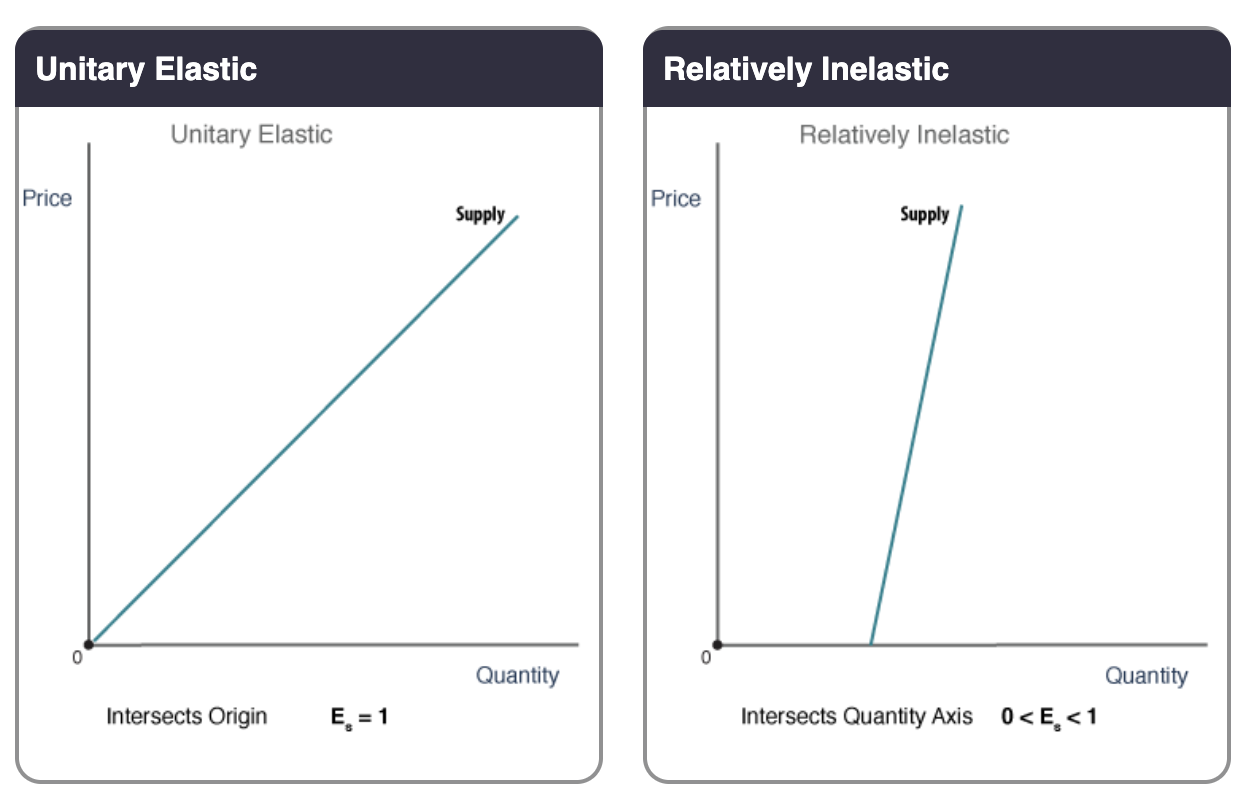
Supply Curves:
Will only intersect one point along the axes (price, quantity, or the origin).
Can be entirely elastic, entirely inelastic, or entirely unit elastic.

Critical Factor: For supply curves, where the curve intersects the axes is more important than the slope.
An inelastic supply curve can become elastic if it shifts far enough to the left to intersect the price axis.
Why the Total Revenue Test Does Not Apply to Supply
Total Revenue and Supply: At every price increase for supply, total revenue goes up (assuming all supplied units are purchased).
Difference from Demand: Demand has a unitary elastic point where revenue starts to decrease after price increases.
Reason for Inapplicability: Because revenue always increases with quantity supplied, the total revenue test is not used to determine elasticity of supply.