Business Statistics: Chapter 13; Correlation and Linear Regression
Correlation Analysis
Correlation Analysis: group of techniques used to measure the relationship between two variables. First step is to plot data in a scatter diagram.
Scatter Diagram: used to portray the relationship between two variables.
Independent Variable: A variable that provides the basis for estimation. The x-values.
Dependent Variable: The variable that is being predicted or estimated.. The y-value.
Correlation Coefficient
Correlation Coefficient: describes strength of relationship between two sets of interval- or ratio-scaled variables.
r = (each x minus the mean of x) + (each y minus the mean of y) / (n-1) * standard deviation of x * standard deviation of y
Characteristic of the Correlation Coefficient:
Sample correlation coefficient is identified by r
Shows direction and strength of linear relationship between two interval- or ratio-scale variables
Ranges from -1 to +1
Value near 0 shows little relationship between variables
Value near +1 shows direct or positive relationship between variables
Value near -1 shows inverse or negative relationship between variables
Excel Functions:
Use data analysis, descriptive statistics, select data for data like mean, sample standard deviation, etc.
To compute correlation coefficient, r, use data analysis, correlation, then select data set for r.
Testing Significance of Correlation Coefficient, r:
t-test for correlation coefficient:
t = r * square root of n-2 / square root of 1-r² with n-2 degrees of freedom
Decision rule, fine critical value, use t-table with degrees of freedom and significance level. If two-tailed, remember df=a/2.
Regression Analysis
Regression Equation: expressed relationship between two variables. Use to estimate one variable based on another, usually y based on x, or independent based on dependent variable.
ŷ= estimated y-value for selected x-value= a +bx
Where a is the y-intercept, b is the slope, and x is the independent variable selected
b = slope = r * (sample standard deviation of y / sample standard deviation of x)
a = y-intercept = ȳ - bx̄
ȳ is mean of y, x̄ is mean of x
Lead Squares Principle: use data to draw a line to minimize sum of squares of vertical distance between actual y-values and predicted y-values.
Testing Significance of the Slope
Test for Slope: test hypothesis that slope of line is 0. If rejected null hypothesis, then there is a relationship between the variables. If accept null, then there is no relationships.
t = b - 0 / standard error of slope estimate
To find decision rule, use t-table with significance levels and degrees of freedom (n - 2)
Evaluating Regression Equation’s Ability to Predict
Standard Error of Estimate: measures of scatter of observed values around line of regression for a given value of x.
= square root of all y - (mean of y)² added / n - 2 = square root of ( SSE / n - 2 = square root of MSR
Coefficient of Determination: proportion of total variation in the dependent variable y that is explained by the variation in independent variable x.
r² = SSR / SS Total = 1 - (SSE / SS Total)
Relationships Between Correlation Coefficient, Coefficient of Determination, and Standard Error of Estimate:
Standard error of estimate measures how close the actual values are to the regression line. When it is small, the two variables are closely related.
Correlation coefficient measures the strength of the linear association between two variables. When points on the scatter diagram are close to the line, the correlation coefficient tends to be large.
Correlation coefficient and the standard error of estimate are inversely related
The coefficient of determination is the correlation coefficient squared
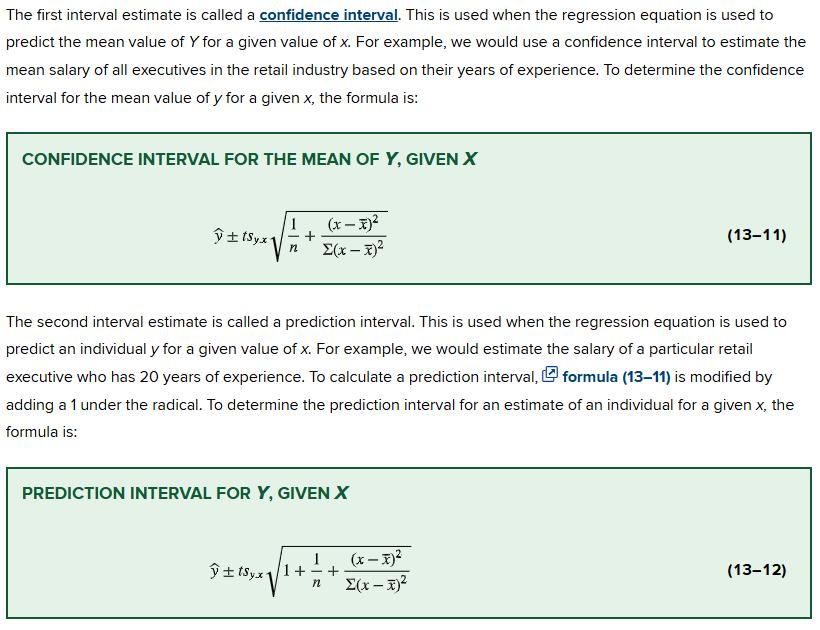
Interval Estimates of Prediction
Regression Assumptions:
Follow the normal distribution
Has a mean on the regression line
Has the same standard error of estimate
Is independent of the others
Inference about Linear Regression:
ŷ + and - standard error of estimate will include 68% of observations
ŷ + and - 2 * standard error of estimate will include 68% of observations will include 95% of observations
ŷ + and - 3 * standard error of estimate will include 68% of observations will include virtually all observations