The level of overall economic activity
This chapter aims to answer the question of ‘How is the economy performing?’
8.1 Economic Activity
The circular flow of income dictates that households sell their factors of production( labor) to firms and receive income in exchange(this all happens inside only the ONE OUNTRY).
Firms sell the goods and services produced to households and receive profit in exchange.
The value of the output produced is equal to the total income (Y) generated
With government involved in the flow, we add leakages and injections.
We have 3 3rd party players:
Government
Foreign market
Banks
Leakages for the third parties:
Tax( Government) tax is a leakage because households pay taxes to the government(govt) rather than buying goods and services( G, S).
Imports( Foreign market) Imports are a leakage as households spend money on foreign goods and services.
Savings( Banks) Savings are a leakage because that is money being stored instead of being spent in the circular model.
Injections for the third parties:
Government spending( Government) Government spending(G) is an injection because the government spends on certain activities and, therefore, puts money back into the circular flow.
Exports( Foreign market) Exports are an injection because the revenue earned from foreign spending on domestic goods puts money into the circular flow.
Investments( Banks): Investments are when firms purchase capital goods in oder to increase production; this puts money into the circular flow.
If leakages > injections → circular flow decreases
More savings>investment = less spending on G,S → less production→ less labor bought( inc. unemployment)→ less household income.
If injections>leakages→ circular flow increases in size
More investment>savings= more spending on capital goods→ increased production→ increased employment→ increased income→ increased spending on G,S.
8.2 Measures of economic activity
National income accounting = value of output. The output of an economy is refered to as national output. Useful because you want to assess economies perfomance over time, compare with other economies’ perfomance, and policy-making.
How economic activity is measured
Expenditure approach= total spending on final G&S.
Note: Distinguish between final(supermarket steak) and intermediary(restaurant steak) goods to avoid double counting.
Components of the expenditure approach
Consumption spending(C): All purchases by households on final G&S.
Investment Spending(I): Spending by firms on Capital goods and new construction.
Government spending(G): Spending by gov within a country.
Net exports(X-M): value of all exports minus value of all imports.
GDP= C+I+G+(X-M)
I= Gov I + Firm I= Human capital+ natural capital
Income approach= all income earned by FOP over time period.
All factor income= national income.
Components of the income approach (returns to FOP)
Labor → income
Land→ Rent
Capital→ Intrest
Entrepeneurship→ Profit
Output approach: Sums the value of each G&S produced.
Components of the output approach
The value of output in each economic sector.
Distinctions relating to measurs of the value of the output.
Distinction between GDP and GNI
GDP measures the total vlaue of all G&S produced in a country by domestic or foreign citizens
GNI measures the income of all residents in a country, wether or not the income was earned domestically or in a foreign country
Distinction between nominal values and real values
Nominal value is the face value of a product
Real value is the value of G&S adjusted for inflation
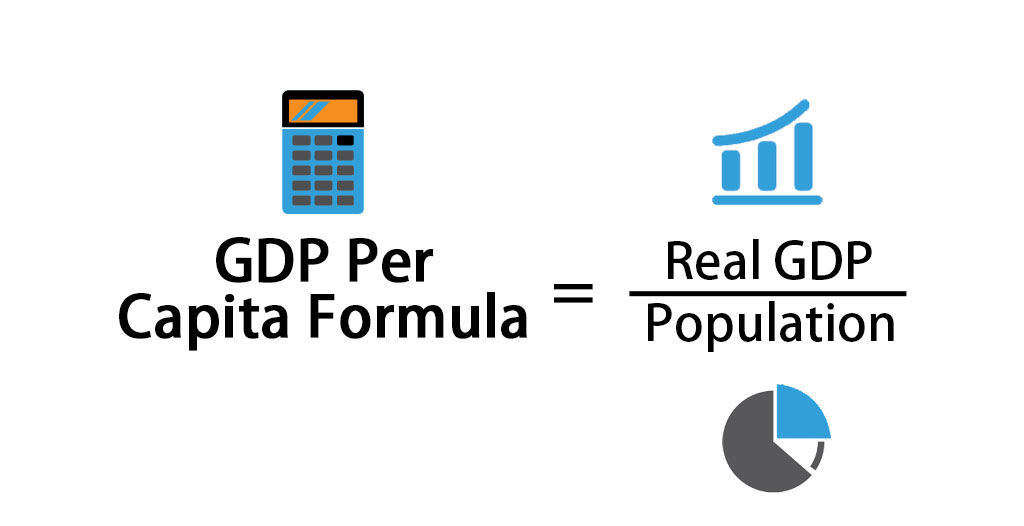
Distinction between total and per capita values
GDP per capita is the total GDP of a country divided by its population
The importances of per capita:
Differing population sizes across countries
Population growth
The meaning of real GDP/GNI per capita at purchasing power parity( PPP)
Purchasing power is the quantity of G&S that can be purchased with money
Purchasing power parity(PPP) is the amount of a country’s currency needed to buy the same quantity of G&S in another country’s currency.
TAKE INTO ACCOUNT PRICE LEVEL DIFFERENCES + EXCHANGE RATES DIFFERENCES AMONGST COUNTRIES
An advantage of PPP is that it allows us to make more accurate comparisons across countries by eliminating differences in price levels.
8.3 Calculations based on national income accounting
Calculating nominal GDP using the expenditure approach
GDP= C+I+G+(X-M) is a calculation for nominal GDP
Calculting GNI
GNI=GDP+ income from abroad - income sent aboread
(income from abroad - income sent abroad) = Net income
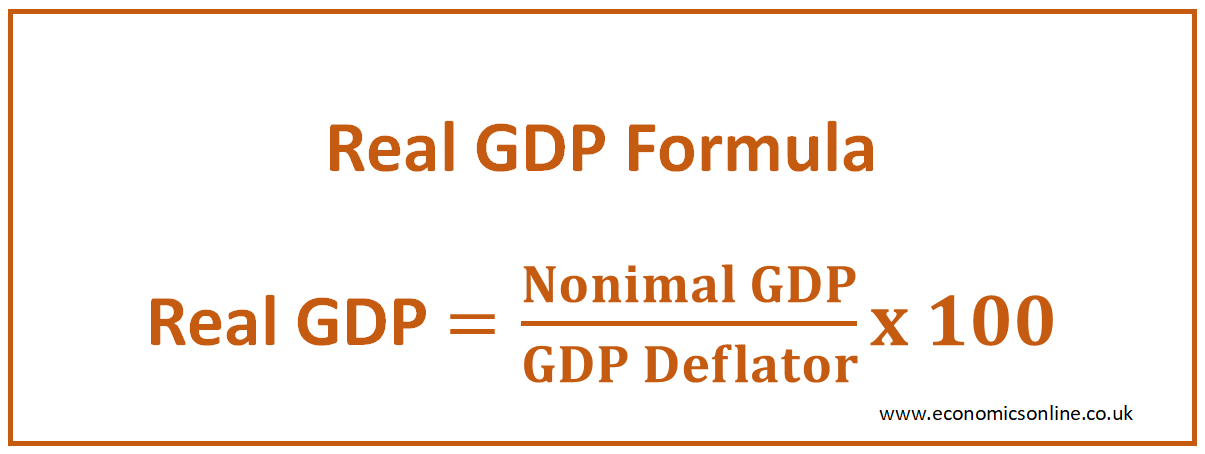
Calculating real GDP and real GNI using a price deflator
Nominal vs Real GDP:
Nominal GDP= quantity of a year * price of that same year
Real GDP= quantity of a year * the base year price(assuming price doesn’t change)
Nominal GDP
measured with current prices
Real GDP
measured with constant prices
The reason we use real GDP to avoid GDP being inaccurately reported/observed.
Note: only meaningful if we use the same base year for every other year’s calculation
Understanding how the GDP deflator is derived
A price deflator converts nominal GDP to real GDP.
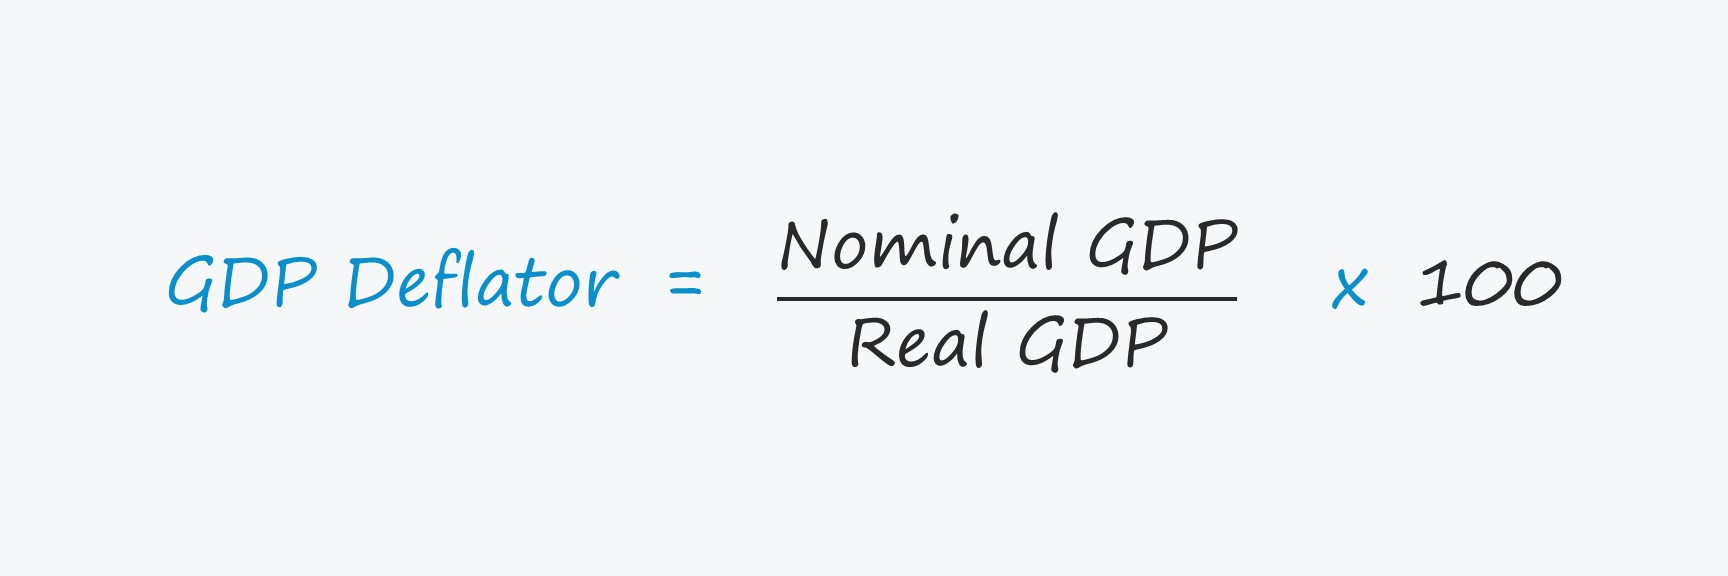
Using the GDP defaltor to calculate real GDP
Increasing GDP deflator→ rising prices on avg
Decreasing deflator→ falling prices on avg
Calculating per capita values
8.4 The Business Cycle
The cyclical pattern and phases of the business cycle
A Business Cycle consists of short term fluctuations in the growth of real output.
The following are phases of the business cycle:
Expansion: Occurs when there is positive growth in real GDP. use of resources+general price level increases (inflation).
Peak: represents the cycle’s maximum real GDP(end of expansion). Unemployment+ price levels increase (inflation)
Contraction: A fall in real GDP, with a downward slope, of course. If it lasts for more than six months, it is termed a recession. It increases resource unemployment.
Trough: Represents the cycle’s minimum level of GDP, end of contraction. Widespread unemployment.
Peak→ peak /trough→ trough = length of business cycle
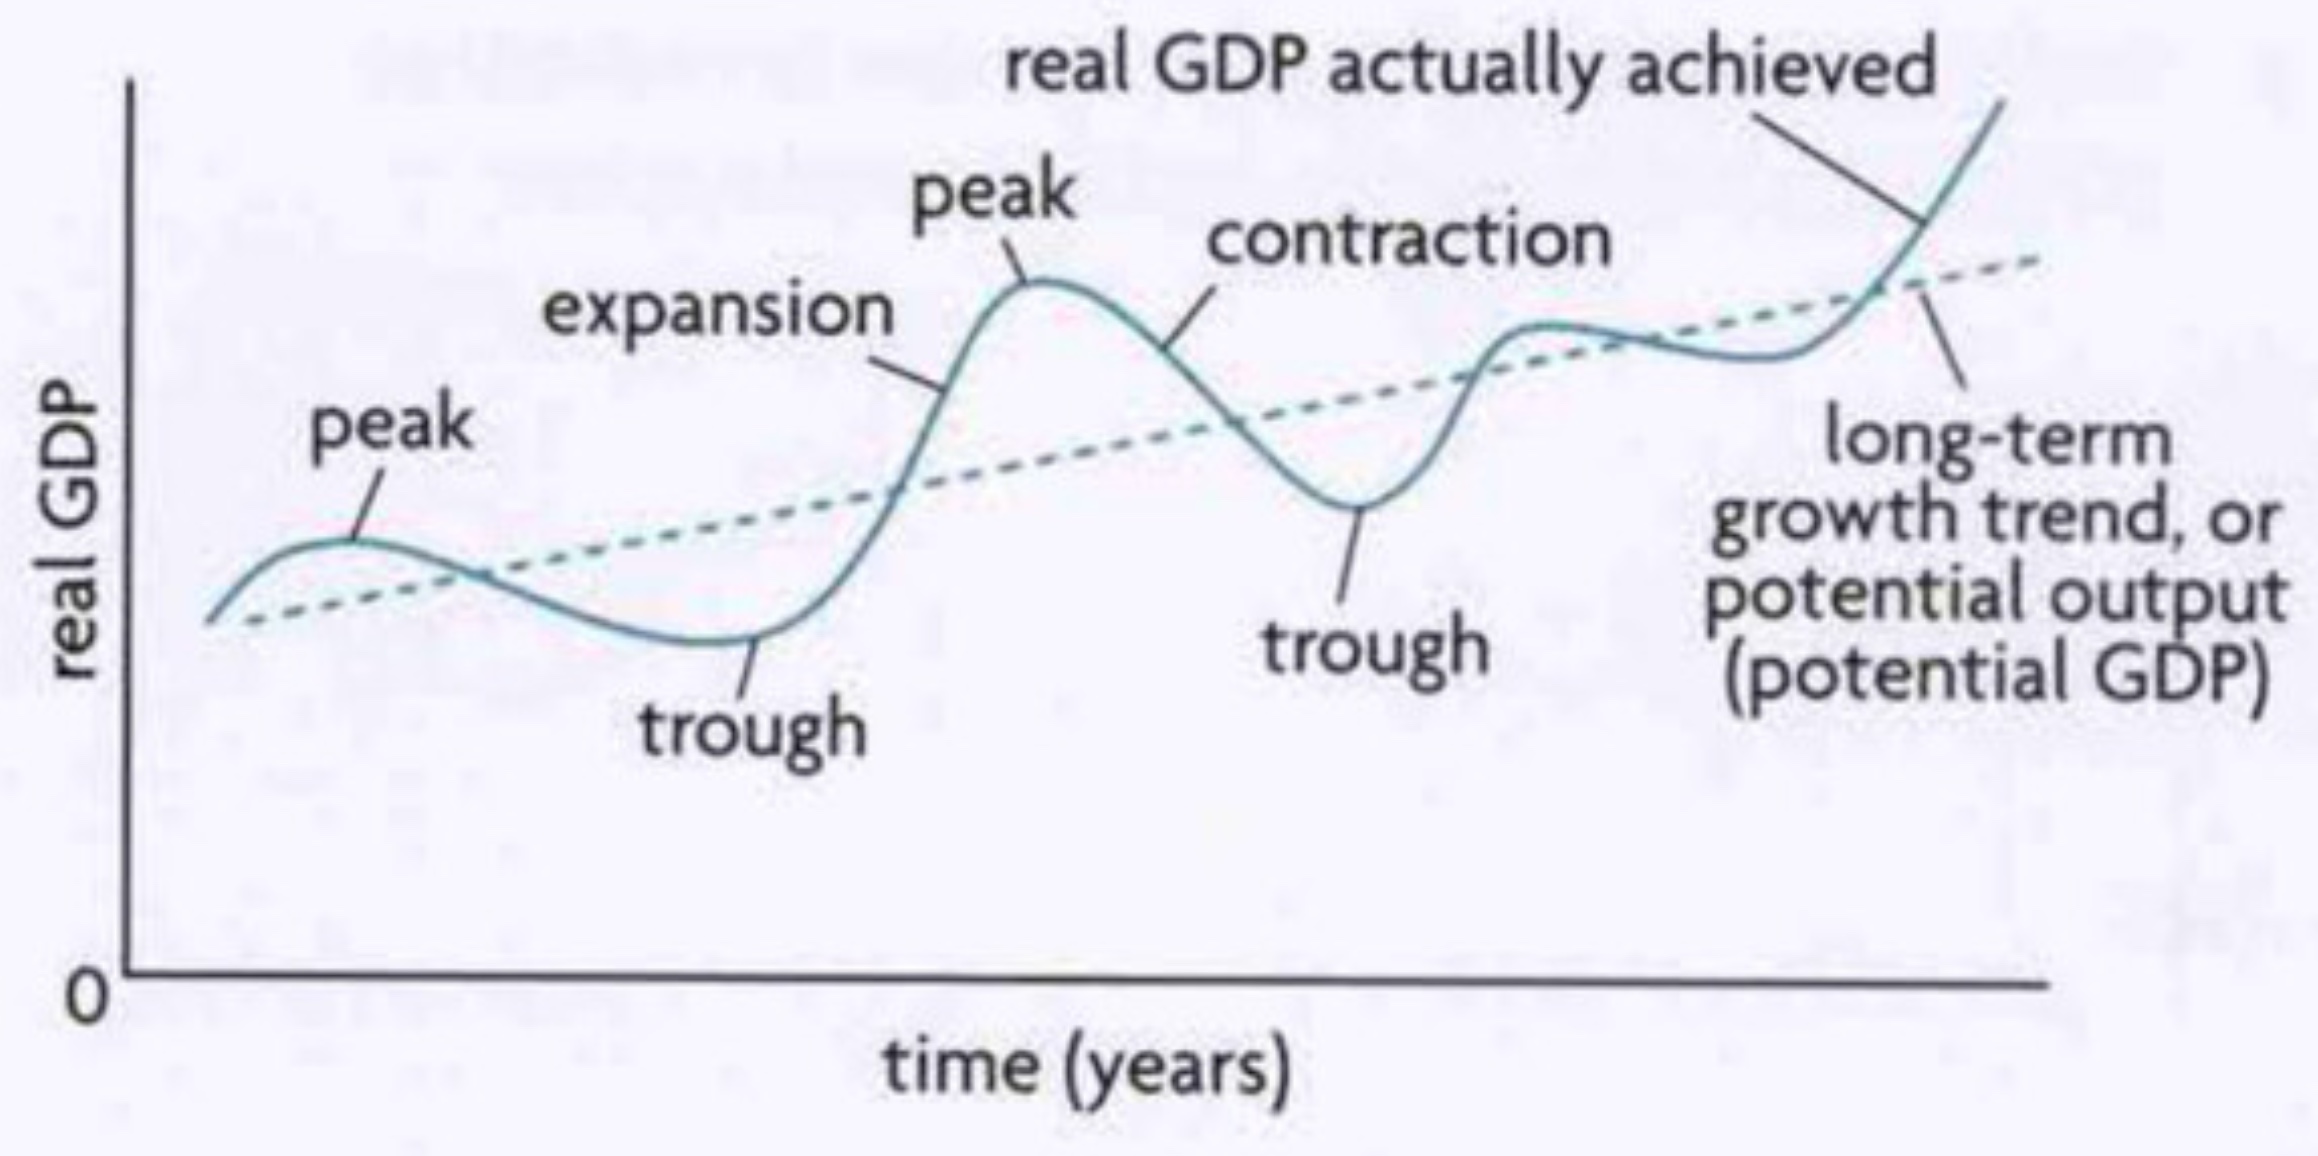
Potential output is the output represented by the long-term growth trend.
How unemployment relates to actual and potential output
GDP fluctuation has a direct correlation with unemployment of labor( macroeconomic variable)
When real GDP grows during expansion, unemployment falls.
When GDP falls during Contraction, unemployment increases.
expansion=more output
contraction=less output(firms cut back on production)
In every economy, a certain level of real GDP for an economy is called ‘full employment’
Full employment: full employment level of output, at full employment your unemployment= natural unemployment
Does Not mean all resources are used, unemployment instead known as ‘natural rate of unemployment’
When Real GDP>potential GDP→ Unemployment<Natural unemployment
When Real GDP<potential GDP→ Unemployment>natural unemployment
Cyclicle fluctuations, potential output and output gaps
GDP/Output Gap: The difference between actual GDP and potential GDP
Calculating Output Gap= Actual GDP-Potential GDP
When Actual GDP=potential GDP, output gap=0
Macroeconomic objectives using the business cycle
To reduce the size of the output gap, negative or positive
Reduce inflation during expansion
Reduce unemployment during contractions
Increase the steepness of the line representing potential output.
8.5 National income statistic and alternative measures
Evaluating national income statistics
Higher GDP per capita/GNI per capita ≠ better economic well-being
Why?
national income statistics do not accurately measure true value of output produced in an economy
Other factors contributing to economic well-being that GDP and GNI cannot account for.
Why national income statistics(GDP/GNI) do not accurately measure the ‘true’ value of output
GDP and GNI don’t include non-marketed output:
Informal work(house repairs, subsistence farming) that does not generate income and does not reach the marketplace.
GDP and GNI don’t include output sold in underground(parallel) markets
Traded and generates income but is unrecorded. Reselling, illegal G&S, avoiding taxes, informal markets.
GDP and GNI don’t take into account quality improvements in G&S
Quality improvements and tech advancements allow improved products to be sold at lower prices. This is not accounted for.
I'm sorry, but it seems like you forgot to provide the sentence so I can create flashcards. Could you please provide the sentence so I can assist you in creating the flashcards?
GDP and GNI don’t account for the value of negative externalities, such as pollution, toxic wastes, and other undesirable by-products of production
GDP and GNI don’t account for the depletion of natural resources
GDP and GNi and differing domestic price levels
Purchasing power parities allow us to get a more accurate picture of the standards when comparing different countries by accounting for the differing price levels across countries.
Why measures of the value of output(GDP/GNI) cannot accurately measure economic well-being
GDP and GNI make no distinction about the composition of output
It doesn’t differentiate about if the good has a positive/negative addition to the standard of living, just the monetary value utilized.
GDP and GNI cannot reflect achievement in levels of education, health and; life expectancy
Education, health care, and life expectancy are large contributing factors to the standard of living and changes to them are not reflected in GDP and GNI figures.
Explain, using a diagram, the determination of long-run equilibrium, according to the monetarist / new classical model, indicating that long-run equilibrium occurs at the full employment level of output.
Examine why, in the monetarist / new classical approach, while there may be short-term fluctuations in output, the economy will always return to the full employment level of output in the long run.
Unknown