MOD 9 - Exposure and IQ in Digital Imaging Systems
Learning Objectives
Contrast the terms "exposure" and "dose"
Relate dose to image quality
Recognize factors that affect image quality.
Describe the factors that affect image quality.
Describe methods for changing image quality.
Explain how the imaging process affects image quality.
Explain how the technologist can control image quality.
Image Quality
subjective aspects:
viewer's preferences
visual acuity
Contrast Resolution
= the ability of the imaging system to express slight attenuation differences between similar adjacent tissues
= difference between the brightness of two adjacent structures
therefore images containing bone, fat, and air as the primary components will display a higher range of attenuation and thus a higher visualized contrast
oppositely with muscle, water and fat these items attenuate to a similar degree and thus will display with lower contrast
Greyscale
= the range of different brightness levels within an image
High contrast resolution
= images will have sharp differences between structures but not be able to differentiate similar attenuating tissues
smaller grey scale
Low contrast resolution
= images will be better at defining these similarly attenuating tissues
extensive grey shades
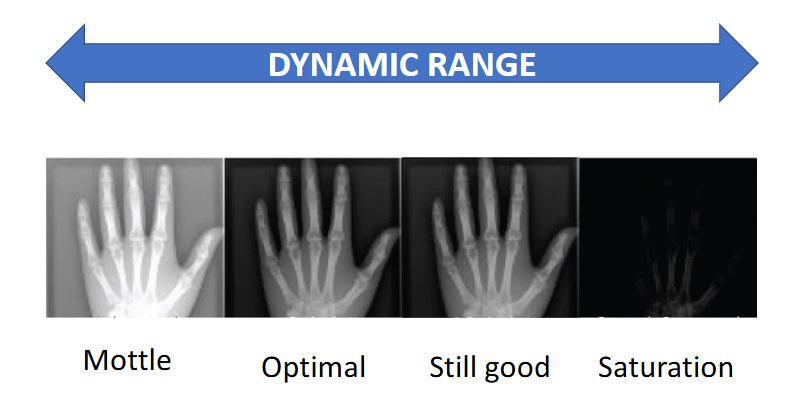
Dynamic Range (long grey scales)
= range of exposures that can be captured by a detector
= detector ability to accurately capture the range of photon intensities that exit the patient
DR have wide range of radiation intensities
this explains how little over/under exposures won’t show substantial decrease in IQ
Spatial Resolution
= the measure of a system's ability to accurately demonstrate small objects as distinct, often considered high detail or high resolution
All radiographic images have some degree of unsharpness
DR systems have fixed spatial resolution determined by the detector element size
In CR imaging the spatial resolution is determined by the frequency of sampling of each area of the plate being laser stimulated
Spatial resolution and DR
DR is inferior when compared to the spatial resolution in film screens
DR benefits
improved detector design
improved spatial frequency
superior contrast resolution
patient dose savings
elimination of film processing and storage more than compensate for this deficiency
How is a systems spatial resolution measured?
Line Pair Testing and Spatial frequency (determined from pixel pitch)
Modulation Transfer Function (MTF)
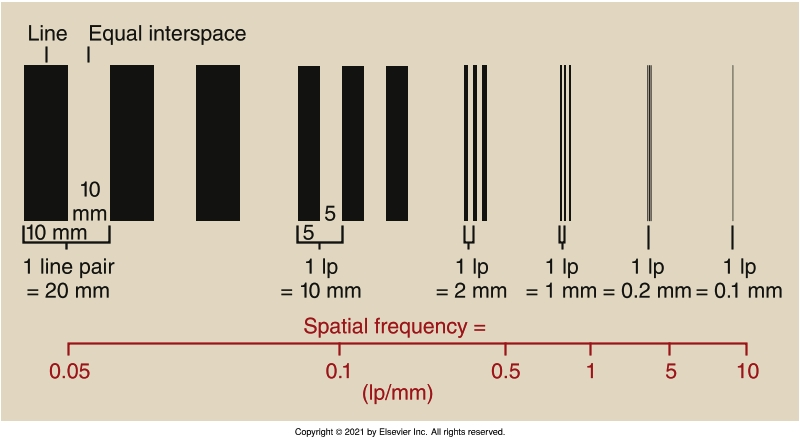
Spatial Frequency
= tests the system's ability to distinguish adjacent small objects as separate
usually assessed by the 'line pair' test tool that contains pairs of thin dense objects (wire) with increasing narrow spaces between the lines
spatial frequency = line pair = defined as both the solid line and the adjacent space
higher spatial frequency = higher spatial resolution
higher spatial frequency of the anatomy = smaller in size = reduced modulation and more difficult to image
Modulation Transfer Function (MTF)
= the ability of a system to accurately demonstrate small objects accurately
most common method of describing spatial resolution
ideal MTF = 1 (meaning the system expresses very small objects exactly as they exist, 0 = the object is not represented at all)
lower MTF = blurrier images
High spatial frequency objects/high spatial resolution/smaller objects → harder to image and thus look blurrier
MTF ranges 0-1
MTF can never be 1 in diagnostic imaging due to a variety of geometric factors and detector element size limitations (impossible)
Image Noise
= a blanket title that defines all destructive data being included in an image
Electronic Noise (dark current noise)
= inherent noise in digital imaging systems due to the use of electrical devices
managed by manufacturers through the use of fiber optics and direct transmission methods
display systems, CCD’s, II
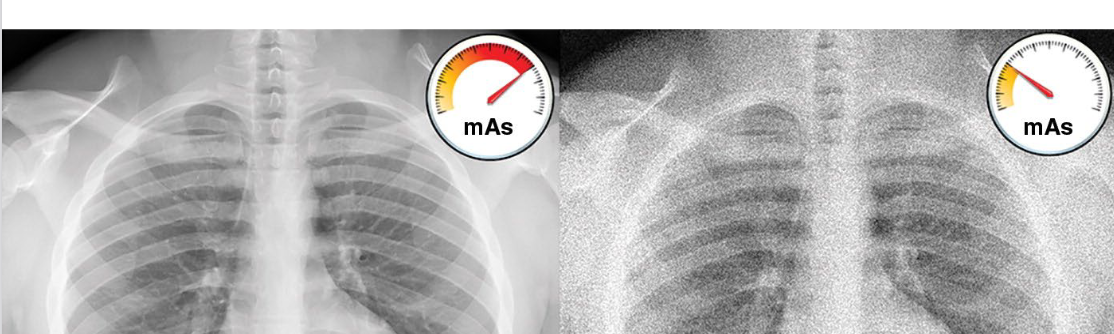
Quantum Mottle
= another form of image noise, is directly related to dose and receptor exposure
Depending on patient factors, this may have both a direct and an inverse relationship with patient dose
Visible as brightness fluctuations and is photon-dependent
incident beam lacks sufficient energy = high absorption (photoelectric effect) → insufficient beam transmission = increased noise and patient dose
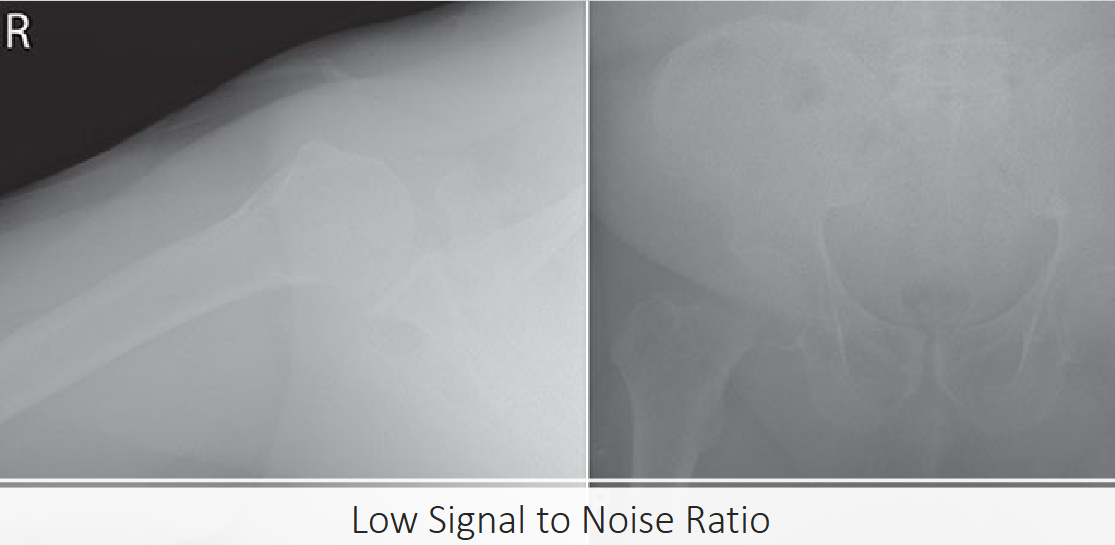
low-signal-to-noise ratio = noisy images that are produced when the detector pixels do not receive sufficient signal to produce an accurate sample
higher signal to noise ratio = more signal (useful diagnostic information), less noise
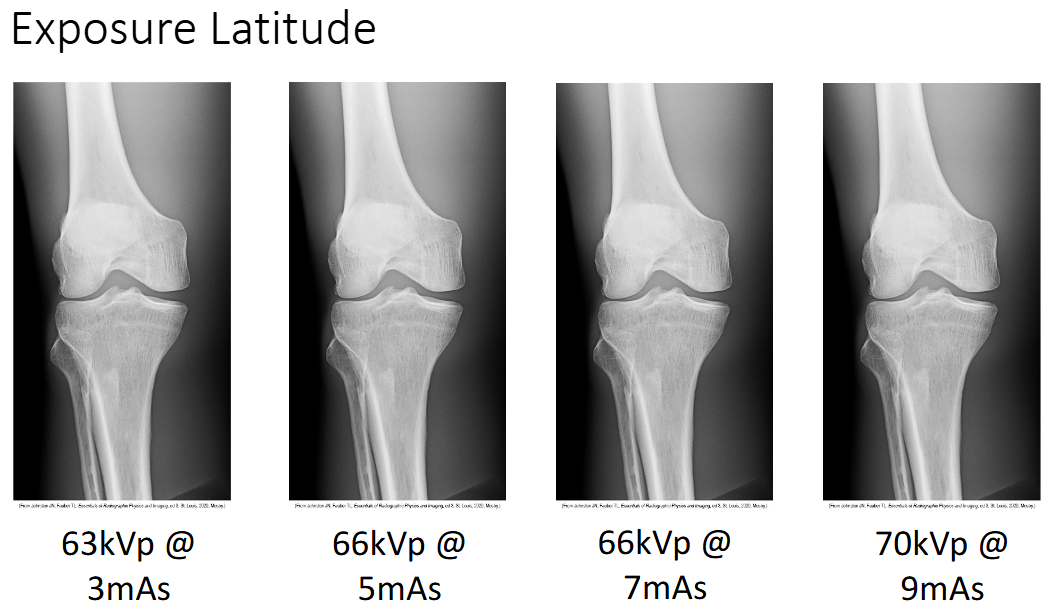
Exposure Latitude
= a digital image processing algorithm which is associated with a histogram of ideal exposure intensities that during processing can correct a wide variation in actual exposure
BUT DR systems cannot compensate for excessive noise caused by quantum mottle
Detector Saturation
= when the detector elements are flooded with transmitted photons (high exposure) and the differential attenuation required for radiographic is lost
Detective Quantum Efficiency (DQE)
= represents the detector absorption efficiency for a wide range of photon energies
detector signal-to-noise ratio is influenced by the DQE
DQE depends on the detector materials and design
DQE of 1 = a 100% probability of photons being detected
in all DR systems, DQE drops with increasing kV
high DQE = fewer x-ray photons are required to produce an image
Direct DR that uses amorphous selenium (a-Se) has the highest DQE

Dynamic Range and Exposure Latitude
Dynamic Range
= The DR system's ability to express its contrast resolution
= the number of gray shades that a system is capable of representing on an image
= range of exposures that can be captured by a detector
= detector ability to accurately capture the range of photon intensities that exit the patient
DR have wide range of radiation intensities
A deep contrast resolution range is a strength of DR imaging
DR systems have a dynamic range of over 16,000 gray shades which requires highly sensitive detectors with high bit depth
DR has a wide exposure latitude = wide range of exposures that make an acceptable image
allows moderately overexposed or underexposed images to be processed to display acceptable diagnostic quality
Basic Windowing
Windowing
= allows the viewer to alter the grayscale display to improve visualization of different densities
a post-processing function
done by altering the window width (WW- number of gray shades represented) or the window level (WL- range of gray shades on the scale represented)
Image contrast is influenced heavily by quantum mottle
Window Level
= located on the display monitor which allows the image brightness to be increased or decreased throughout the entire range of densities
Things to Note when Windowing
done at the workstation monitor through the mouse function
important to return the image to the original grayscale before sending to PACS to ensure any adjustments are not saved
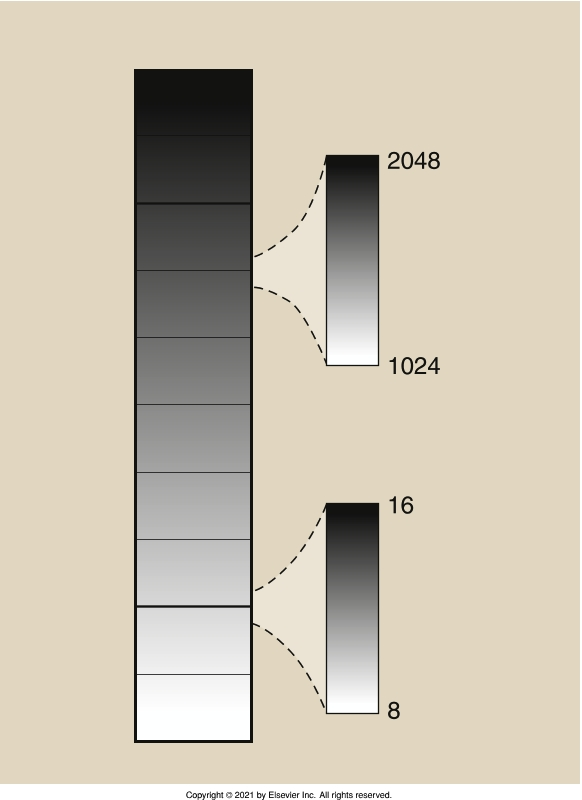
Image Brightness Adjustments
→ Adjusting the window level means that the center of the range of gray shades is moved up or down the scale → this will either allow more light gray shades or more dark gray shades to be expressed on the screen = decreased/increases brightness
Contrast Adjustments/Window Width
Increasing the number of gray shades represented on an image (widening the window width) = decreases image contrast
reducing the window width, image contrast can be improved
Image Brightness and Digital Imaging
Image brightness is controlled by our software processing system and also can be adjusted at the monitor and image viewer level
image brightness is determined through the attenuation of x-ray in the tissue
adequate brightness = proper attenuation of xray beam
bright = white = lots of attenuation
dark = black = no attenuation