Central Tendency
measures of central tendency summarize the middle or most typical values for a variable
mode
median
mean
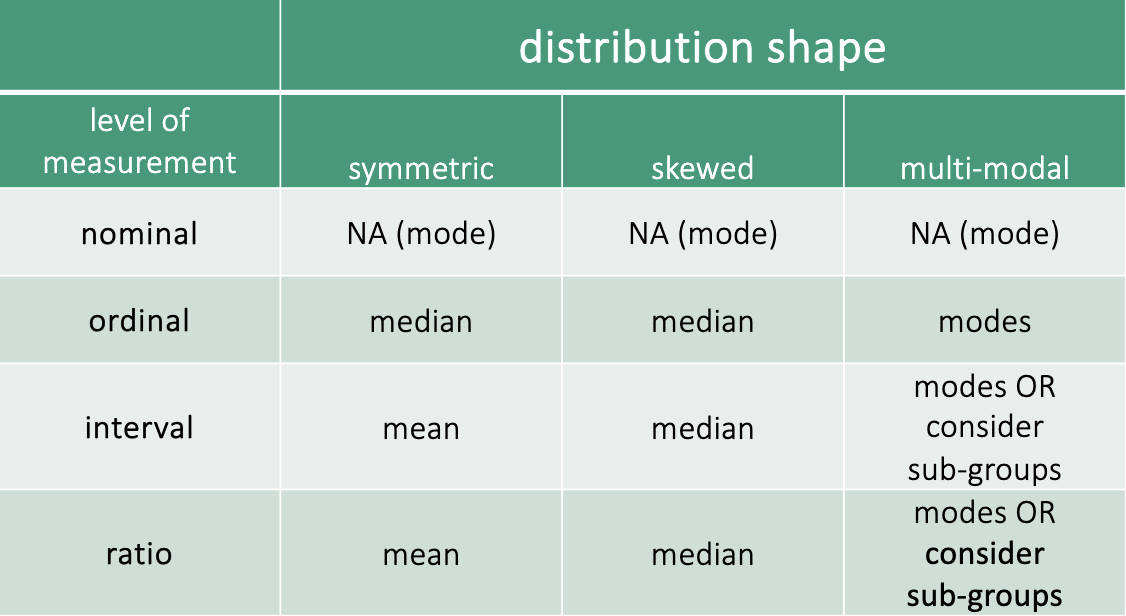
two factors guide choice of measure for summarizing data
level of measurement
shape of distribution
mode
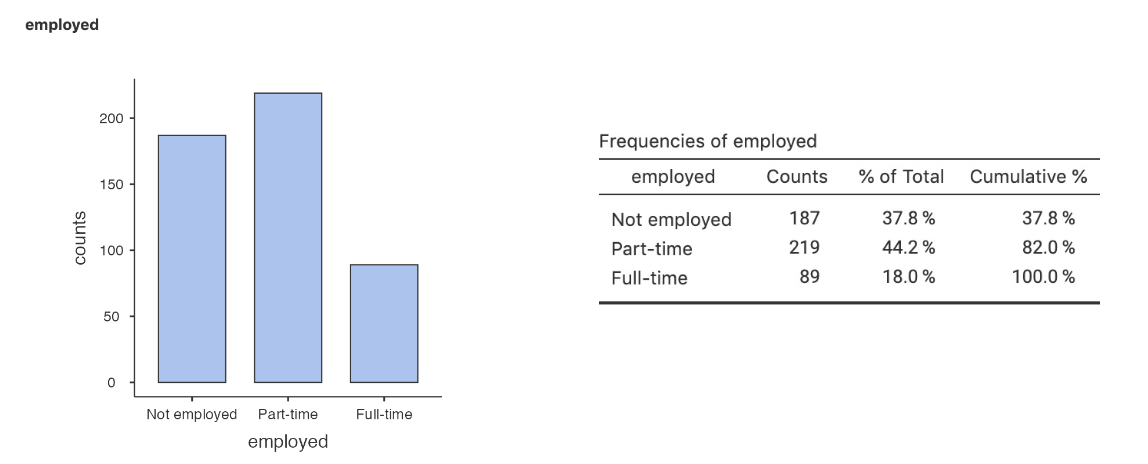
mode: the value of the most common score of the variable
the only and best measure for nominal variables
complement with frequencies of each category
ex: self-reported employment in n=500 UNLV students
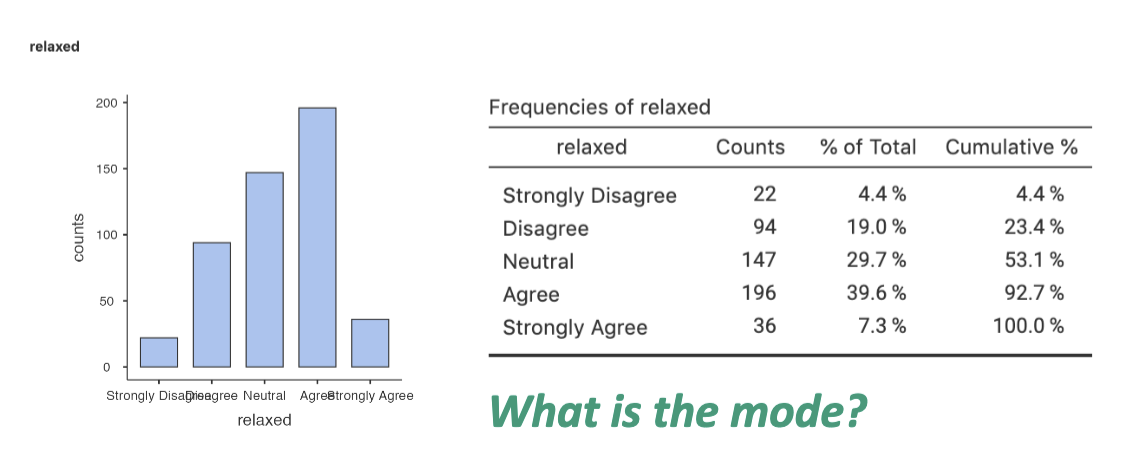
could use for ordinal, interval, and ratio if the values are discrete
discrete variables can take on a finite number of values
ex: survey response to “I am relaxed most of the time”
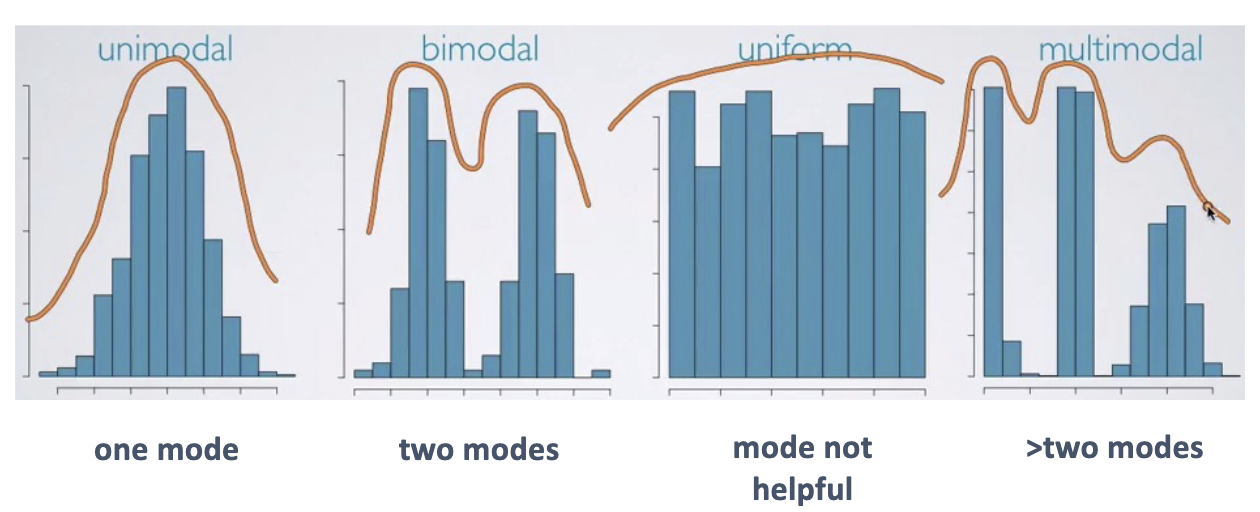
technically mode is the absolute peak
sometimes there is another peak slightly lower but is visible in frequency distributions
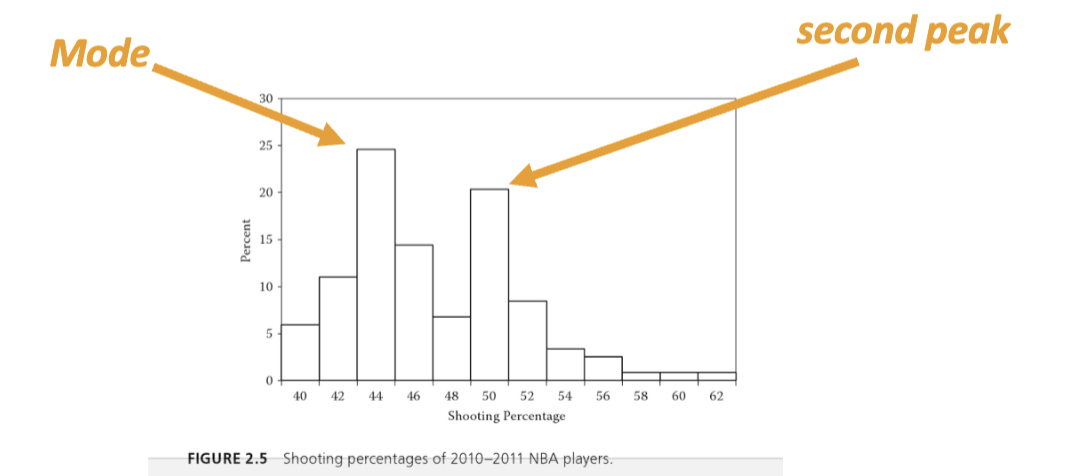
multiple peaks in a distribution often means there are sub-groupings in the sample
you could consider separating them for further analyses
what might the distribution shape look like, where would two peaks be?
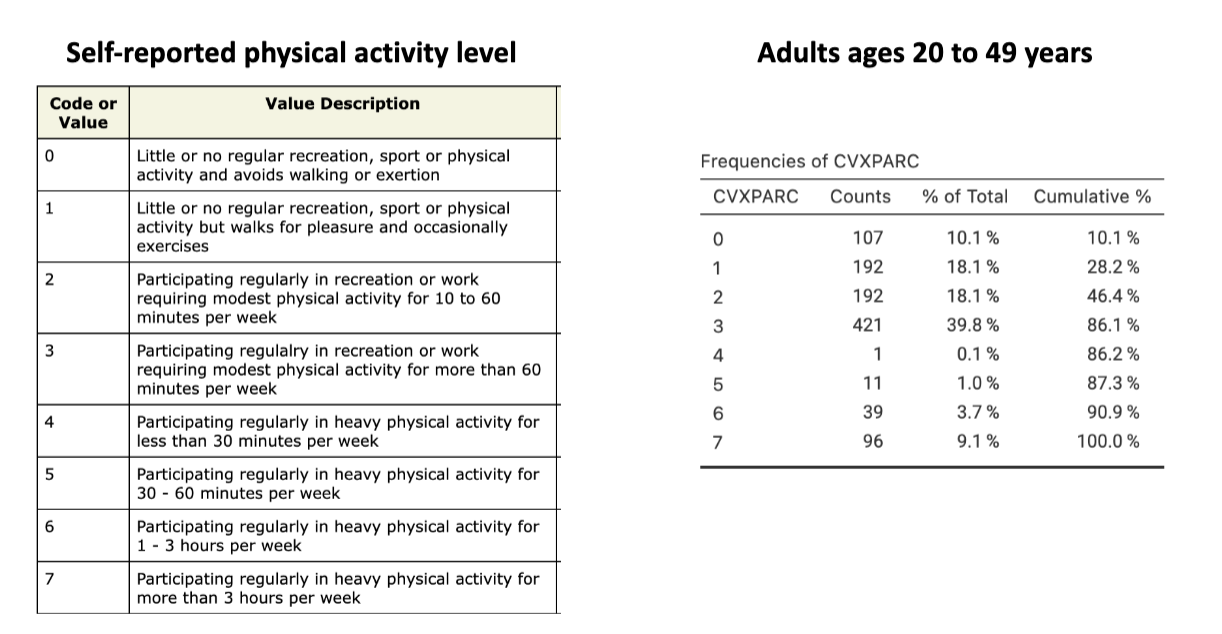
multimodal
3 and 1/2
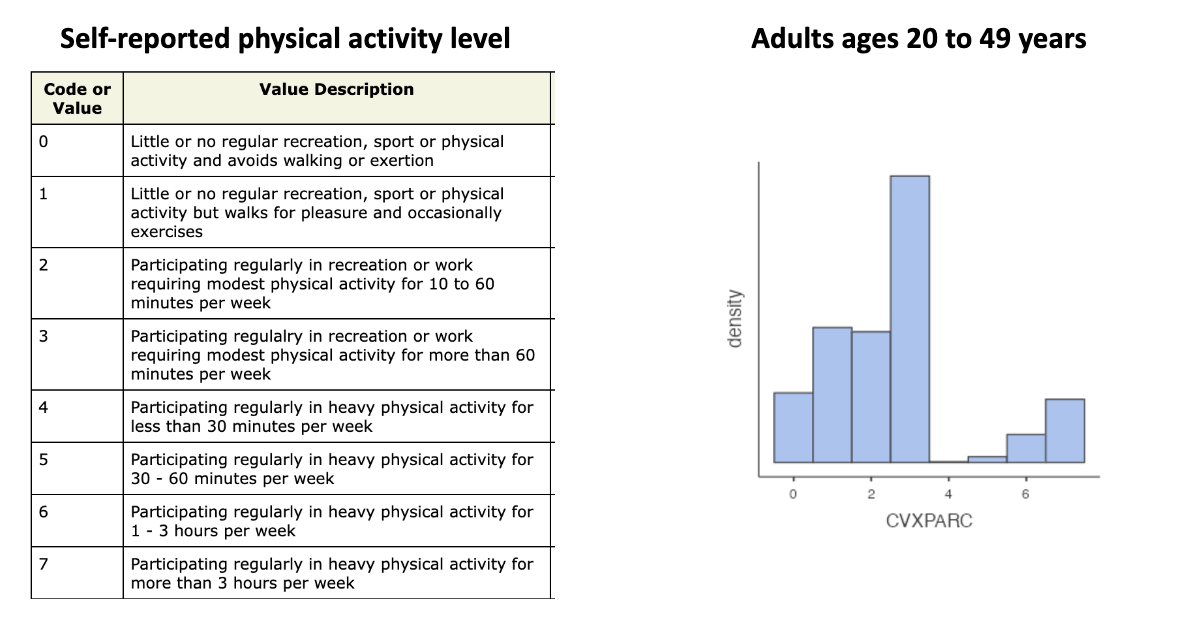
if quantitative and multimodal consider why
are there naturally occurring groups in the data that should be examined separately?
were different versions of a measure used?
was there some procedural difference that could have created unintended grouping in the data?
median
median: the middle value in a frequency distribution
the point that falls in the middle of all points when putting the data in chronological order
in a cumulative frequency table, the median is the point at the 50th percentile
half of the measurements are below it and half are above
the ordinal middle of the distribution
if there are an odd number of data points:
put the points in order
count the points (n)
median is the value of item at (n+1)/2
if there are an even number of data points:
put the points in order
count the points (n)
take points surrounding (n+1)/2
median is the midpoint of these two points
does not use all of the values in the data
could use for ordinal, interval, and ration scales
be cautious with averaging of middle two ordinal values
should not do arithmetic with values on an ordinal scale because they’re not incremental in value
complement with frequencies if small number of levels
best when:
shape of the distribution for interval/ratio variable is skewed
mean
mean: typically what people refer to when they say average
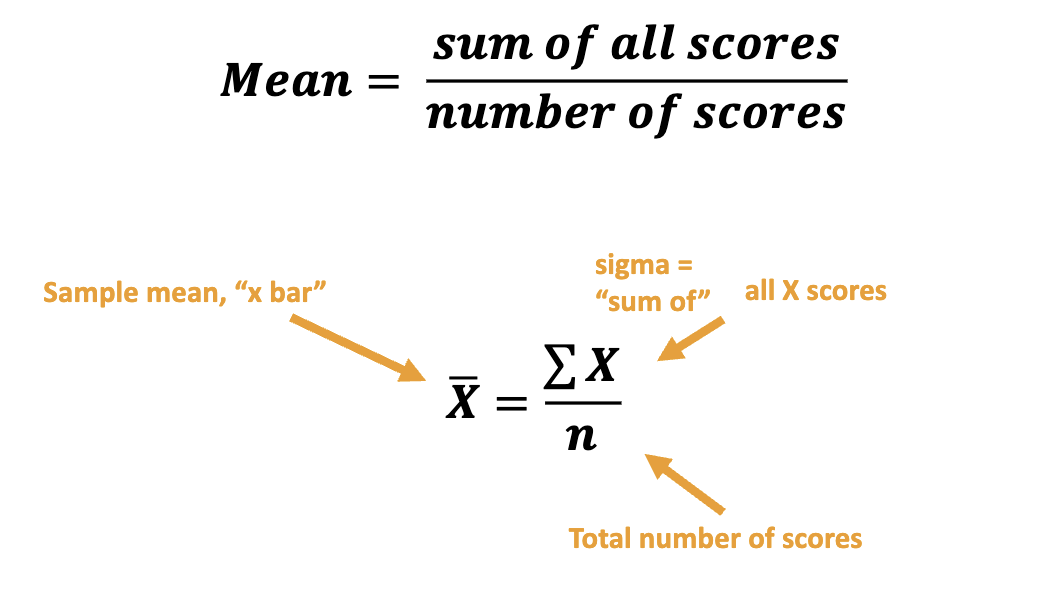
the arithmetic center of a distribution
a balance point of all scores
use the median when distribution is heavily skewed
uses all of the values in the data
implications
may be misleading for multi-modal data
misleading for heavily skewed distributions
influenced by extreme values
best for interval and ratio scales
best when
shape of the distribution for interval/ratio variable is symmetrical (not heavily skewed) and unimodal (not bi-modal identified sub-groups)