1.2.3 Revenue, costs and profit
Percentage change
(New – Old x 100
Old)
Total revenue
Total Revenue is the amount of money a firm makes from sales.
Formula: Price per unit x no of units sold
TR = P x Q
Costs
Fixed costs (FC): do not vary with output. E.g. rent, insurance. FC are the same when a firm produces 0 or 1000 units
Total fixed costs: All fixed costs added together
Variable costs (VC): costs that do vary with output. E.g. raw materials
Total variable costs (TVC): Variable cost per unit x number of units sold (VC x Q)
Total costs: Total fixed costs + total variable costs (TFC + TVC)
Average costs: Cost per unit. Total cost/ number of units sold. (TC/Q)
Profit
The amount of money a firm makes after all costs have been deducted from revenue.
A firm makes a profit when total revenue is greater than total cost.
If total cost is greater than total revenue, a loss is made.
Total revenue – Total cost
TR - TC
Economies of scale
Economies of scale occurs when increasing output results in falling long run average costs (LRAC).
Internal economies of scale occurs when a firm grows – as a firm increases output, the firm benefits from falling long run average costs.
External economies of scale occurs when an industry grows – all firms in the industry benefit from falling long run average costs.
Types of internal economies of scale
Purchasing EOS – Bulk buying
Technical EOS – average costs falls when a firm invests in technology as it improves efficiency
Financial EOS – larger firms tend to be offered cheaper borrowing interest rates as they as seen as less risky
Managerial EOS – larger firms can employ specialist managers who improve efficiency
Marketing EOS – larger firms can spread their marketing costs over a larger output (e.g. Cadburys)
Risk-bearing EOS – larger businesses have a large product range so they reduce risk of failure
Types of external economies of scale
Infrastructure: Improved infrastructure such as faster internet connection or improved roads can lower costs for all firms in an area
Access to supplier: As an industry grow, more suppliers enter the market, driving down prices (reducing average costs for firms)
Skilled workers: As industries grow, more workers may become trained, this lowers cost as firms may not need to do the training themselves.
Similar businesses in the area – When firms in the same industry are located close to each other, they are likely to cooperate with each other so they can all gain. E.g. sharing research
Diseconomies of scale
Diseconomies of scale occur when average costs rise as output increases.
Types of diseconomies of scale
Bureaucracy – complicated administration procedures. E.g. time wasted filling in forms, slows down decision making.
Communication problems – large firms employ a large number of workers, communication can become challenging.
Lack of control – Large businesses are difficult to control and coordinate.
Distance between senior staff and shop workers – Relations between workers and managers can worsen. This can result in demotivation, lack of productivity and conflicts
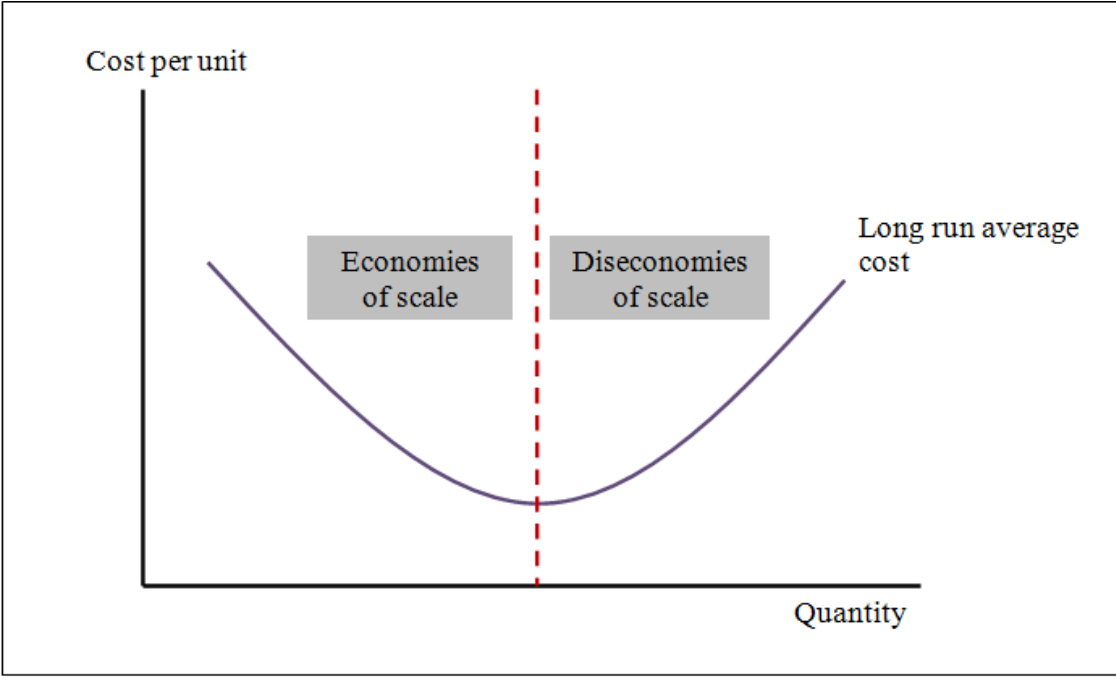
Long run average cost curve
The long run average cost curve shows the long run average costs of a firm as output increases.
At low levels of output, LRAC falls as output increases (economies of scale)
The lowest point on the LRAC is the most efficient level of output
As output continues to rise, long run average cost rises due to diseconomies of scale.