Ideas About Science (OCR)
Scientific method
Science seeks to provide an accurate explanation for observed natural phenomena, or events. The scientific method is used by scientists to create explanations.
This works in a particular manner:
make a speculative hypothesis to explain an observation.
based on the premise, create a hypothesis about how changing a single element will impact the result.
organize an experiment that will verify the hypothesis and the hypothesis
A student might, for instance, make the following hypothesis while thinking about a house's solar panels: "The voltage obtained from a solar panel is affected by the size of the solar panel."
The size of the solar panel is the independent variable in this particular example. The student is speculating that the size of the solar panel has an impact on the voltage it produces.
In contrast, controlled variables include solar panel type, temperature, duration of exposure to sunlight, angle of incidence of sunlight, and intensity of sunlight (if performing tests outside). To separate the impact of panel size on voltage production, these factors would have to be regulated.
The students can observe and evaluate how panel size affects voltage production by varying the size of the solar panels (an independent variable) while maintaining constants for all other pertinent variables (controlled variables). This allows the student to test their hypothesis.
The inclusion of the scientific justification for a prediction might enhance it. In which case it might be "as the size of a solar panel increases the size of the voltage produced will also increase because they will be able to absorb more energy from the light source."
Conducting experiments
Always give an investigation significant thought before beginning. Writing a plan is expected, and it should include a logical flow of procedures. For reproducible results, the strategy should be able to be applied by another scientist with comparable equipment.
The equipment utilized, the experimental methodology, the range, and the quantity of readings should all be specified.
Measurements
Selecting the right tools, supplies, and methods is crucial. Measurements It's critical to ensure that the equipment used in a practical study to test a prediction will produce findings that are reliable, precise, and accurate.
Risk assessment
To determine dangers and reduce risks, every experiment should have its risks evaluated. Always heed safety warnings and directions from your teacher.
Using a table to list the risks, identify the dangers, and offer suggestions for reducing the risks is one method of doing this.
Consider the practical investigation of whether the magnitude of the voltage produced grows with the size of a solar panel. This would include using a voltmeter to measure the voltage generated by shining a bulb on a solar panel from a fixed distance.
Processing data
Tables
A table is the most effective way to present gathered data. This aids in keeping your data collecting organized.
When displaying results in tables, the following rules are helpful to follow:
If creating a table by hand, utilize a pencil and a ruler.
Column headers ought to display the quantity and unit.
First column's independent variable and the columns to the right's dependent variables
The same number of decimal places should be recorded for each result for a given quantity.
There are no units in the table's body.
Significant numbers
The response should have the same number of significant numbers as the measured value when performing computations with measured answers.
Charts
Data can be displayed using charts once it has been gathered.
Discrete data are displayed using a bar chart and are limited to specific values.
This can assist in highlighting any trends. A pie chart compares one category to the total.
Graphs
Any value in a specified range can be found in continuous data. It consists of length, mass, and time.
A line graph should be used to display continuous data.
When trying to identify any trends or patterns in the data, line graphs are especially helpful.
Use of units
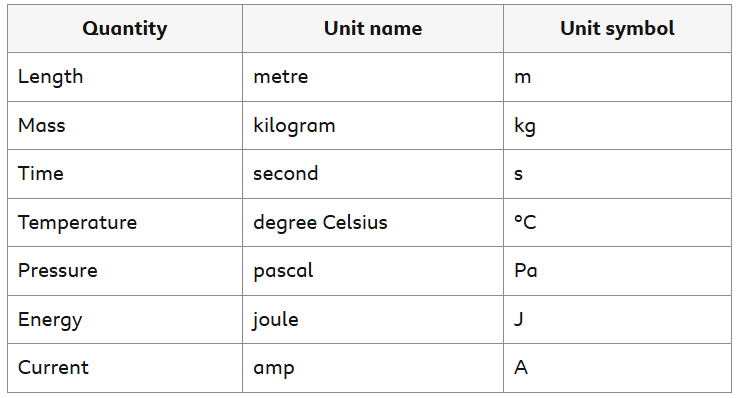
Standard units
The International System of Units, or SI units, is used by scientists. A few common units are displayed in the table.
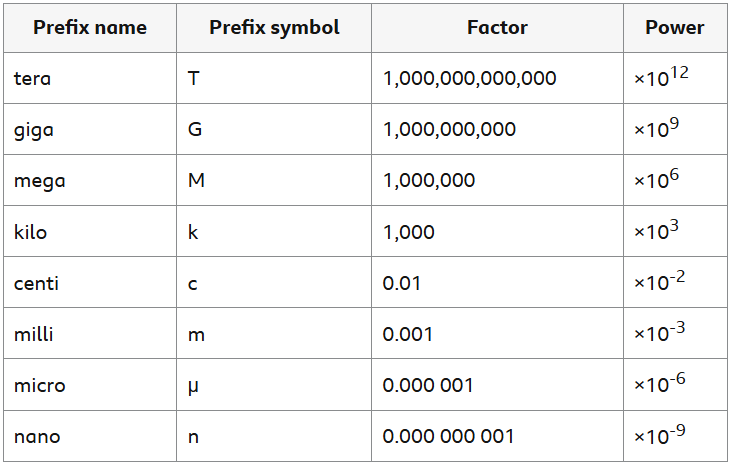
Prefixes
Many different quantities, some very huge and some extremely little, are measured by scientists.
Measurements with varying orders of magnitude are prefixed with particular terms:
Unit conversion
A right factor of ten (10, 100, or 1,000) is multiplied or divided to convert between units with different prefixes.
When multiplying or dividing, always ask yourself, "Is the answer supposed to be larger or smaller?"
Evaluating data
Any data should have its quality assessed before any conclusions are drawn.
Precision, repeatability and reproducibility:
precision: measurements closely match each other.
repeatable: repeated measurements made by the same individual or group with the same tools and techniques are fairly similar.
reproducible: when measured again by a different individual or group using different tools and/or techniques, the results are fairly consistent.
A table of data with repeat measurement clearly shows precision and repeatability.
The data is accurate and reproducible if the intervals between the repeat measurements are small.
Accuracy
Accuracy should be taken into account when evaluating the data.
If a measurement is almost accurate, it is the real value.
Determine the best approximation of the true number in order to guarantee the data is as accurate as feasible.
Data interpretation
There are mathematical techniques that can be utilized to further analyse the results based on the given data.
It is possible to calculate the gradient from a straight-line graph. A force-extension graph's gradient equals the spring constant, and a distance-time graph's gradient equals the speed.
It is also possible to compute the area beneath a graph. The distance traveled is indicated by the area under a velocity-time graph.
To estimate a value between two known values, interpolation can be employed, and lines can be extrapolated to estimate values beyond the measured values.
Enhancing procedures
The last stage is to think about ways to raise the precision and accuracy of the data gathered by making adjustments to the experimental setup and equipment.
Considerations for enhancing procedure include:
Is the finest tool being utilized? For example, while measuring a relatively short length, should one use Vernier calipers rather than a ruler? While determining the volume of a small amount of liquid, would it be preferable to use a measuring cylinder with a smaller diameter?
Do we need to do additional repetitions? Does it need to take any additional readings, for instance, if three consecutive readings are reliable?
Could the experiment be repeated by someone else? Were there any outside factors that we could have better control over?
Could the experiment be repeated by someone else?
Were there any outside factors that we could have better control over? For example, is it better to undertake a cooling experiment next to a heater or next to a door that is opened frequently?
Recognizing errors
Any study should aim to minimize errors as much as feasible. Making mistakes is not the same as making errors.
Any measurement has random errors that are unavoidable and cannot be adjusted for. By establishing the mean and performing further measurements, their impact might be diminished.
For instance, attempting to measure the pendulum's time period will inevitably result in a random error because timing a timer at precisely the right instant is not possible.
When a measured result regularly deviates from the true result on all occasions, this is known as a systematic mistake. A meter with a zero inaccuracy, for instance, will result in a systematic error.
Data correlation
Correlation
A correlation is an association of two items. To prove a link between a factor and an outcome, evidence is needed.
There is a correlation if a result occurs when a factor is present and does not occur when the factor is absent. There are more elements to take into account that might have an impact on the result.
Causal relationship
A factor may not always be the cause of an outcome, even when there is a correlation between it and the result. To demonstrate that the factor produced the result, data must be gathered and supporting documentation must be provided.
A causal relationship can only be demonstrated by scientists if they can locate data to support the relationship.
There is merely a correlation in the absence of a scientific explanation. It cannot be demonstrated that the factor leads to the result.
Scientific theory
The development of theories in science
A general explanation that works for a broad variety of scenarios and instances is called a scientific theory.
As technology advances, new kinds of observations can be made and more data can be gathered.
A testable explanation for an observable event is called a hypothesis. A novel scientific explanation could result from new data that defies an established theory. The supposition is modified. The model of the atom is a nice illustration of this.
Scientists may provide various interpretations for the same evidence.
An accepted scientific hypothesis or explanation is typically not instantly refuted in the face of fresh facts. Until a more compelling explanation is developed, the current one continues to be accepted.
The Big Bang theory of the universe's creation and the theory of evolution in biology are two examples of scientific theories.
Review by peers
A scientific community comprises scientists from all across the world. Students in your age group make up your peer group at school. Scientists who work in the same field of study are considered peers by other scientists.
Peer review, which involves having other scientists with specialized knowledge in that field of study assess scientific claims from recently completed research, is a requirement for publications in journals.
Researchers verify that the study is:
Validity: Does the approach measure what it claims to measure, and was it adequately and correctly designed?
Original: Has anyone else conducted such research before, and if so, has their work received credit? Are the outcomes fresh?
Significance: Do the study's conclusions hold importance?
Evaluating scientific claims
Always be skeptical of claims derived from non-peer reviewed studies. There can be issues with the methodology employed, the precision of the findings, or the inferences made.
If a study's data cannot be replicated by other scientific teams or by the scientists who conducted it, it should also raise red flags.
Scientific models
Models are used by scientists to test hypotheses and clarify concepts.
A model:
is a more basic illustration of something
contains the salient characteristics of the object being represented
demonstrates how these essential elements relate to one another
is employed to provide explanations, resolve issues, or forecast
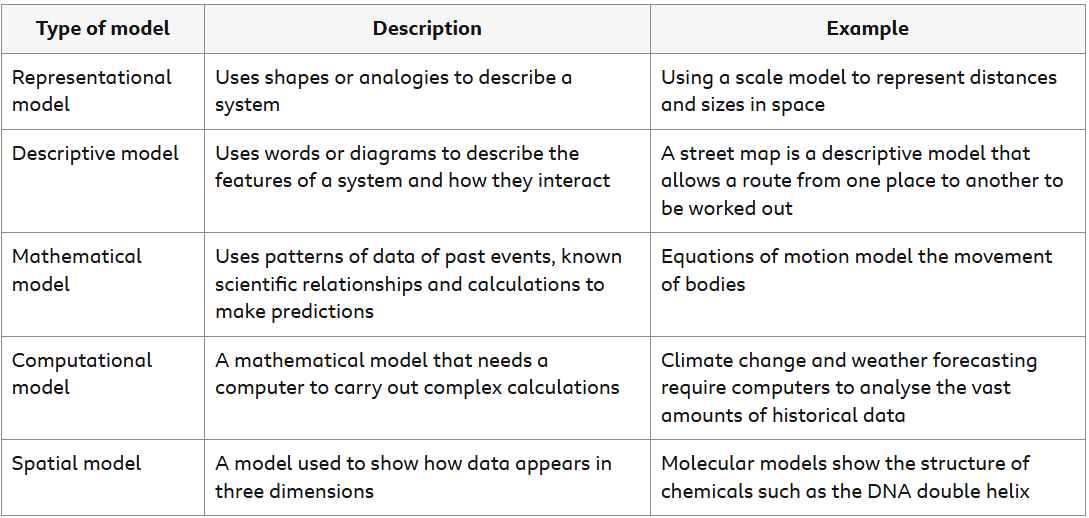
Models can be used to study a concept without creating moral or practical issues. But a model can only account for so much. Models are not perfect.
The degree to which a model properly captures the real world determines how valuable it is. The many model types are displayed in the table:
Scientific and technological advancements
Positive effects
The application of science and technology can improve people's lives. A benefit is an advantage that a procedure or product has.
As an example:
Scientific advancements in the utilization of radioactive materials occurred during the beginning of the 20th century. The gamma camera and other technological advancements would not have benefited medicine without these discoveries.
Greenhouse gas emissions have decreased as a result of power plants using nuclear fission to generate electricity. Electric vehicles are propelled by fuel cells, which also lessen air pollution emissions in the vicinity of the vehicle.
On the other hand, hazards might also arise from new developments. An assessment of the possibility that an undesirable outcome will occur is called a risk.
The likelihood that a risk may materialize in a sizable sample over a predetermined period of time is used to evaluate the risk's size. Scientific and technological advancements are not without peril. Scientists come up with strategies to lower these dangers.
Another instance:
Many workers died during the start of the 20th century as a result of ignorance about the risks posed by radioactive materials.
Numerous nuclear catastrophes, like those at Fukushima and Chernobyl, have claimed numerous lives.
Negative effects
Although generally beneficial, the use of science and technology can also have negative effects.
For example:
Genetically modified organisms (GMOs) are the result of scientific advances in genetic engineering and have been hailed for their potential to improve food security and raise agricultural yields.
But concerns have been raised about how they would affect the environment and human health in the long run. According to some research, there may be a danger of allergic reactions in those who are sensitive to them or inadvertent harm to beneficial insects like pollinators.
Another instance:
Technology and scientific development could worsen environmental conditions by increasing pollution or resource extraction. It includes the generation of certain substances or technologies, which may have unanticipated consequences on ecosystems or human health if their full effects are not known beforehand.
Thus, even if science and technology have a lot to give, it's important to maintain a balance between advancement and appropriate stewardship in order to reduce any potential adverse impacts.
Scientific risk reduction
The following people make decisions about the use of science and technology:
each of us individually
governments
local government
To lower risk, public regulations may be implemented.
People must weigh the advantages and disadvantages for both individuals and groups of people while making decisions.
Taking on risk
Individuals are more likely to take a chance if:
They are not being forced to make the decision; rather, it is their choice.
Rather than being long-term, the impacts are temporary.
Their advantages are considerable.
Risk interpretation: Higher
A risk's perceived value may differ from its estimated value. Individuals frequently exaggerate the danger of strange activities (like skydiving) and invisible hazards (like ionizing radiation).
The perceived risk, or the risk that someone believes to exist, may not always match the real risk.
For many people, nuclear radiation seems dangerous even if it is invisible. Because of this, the risk appears greater than it would be for something more obvious and recognizable.
A lot of people are unaware that radiation from nuclear sources has always existed in our surroundings.
It is a common misconception that food that has been exposed to radiation is radioactive in and of itself.
Calculated risk, on the other hand, is making choices in situations where the possible advantages outweigh the disadvantages or uncertainties after carefully weighing the information and data that is at hand.
Scientists use evidence and scientific understanding to identify cancer targets and formulate hypotheses regarding the drug's mechanism of action.
Researchers thoroughly assess the drug's effects in controlled laboratory settings before testing it on humans in order to anticipate any advantages and risks.
These trials are intended to gradually amass data regarding the safety and effectiveness of the medication in humans, beginning with small-scale investigations and progressing to bigger populations.
Balancing benefit and risk
The advantages and hazards of introducing science and technology should be taken into account, along with who, how, and why it will affect people.
As an illustration, air travel is actually the safest mode of transportation, despite the fact that aircraft accidents typically result in numerous fatalities and are extensively covered by the media.
Similar to how many people died as a result of the nuclear accidents in Chernobyl and Fukushima, the likelihood of dying in a nuclear accident is actually very low; in fact, riding a bike is more dangerous.
Like any activity, there are hazards involved, but it's crucial that the advantages outweigh the disadvantages.
Making scientific decision
Upon weighing the advantages and disadvantages, alternative course of action selections can still be taken.
The benefits and drawbacks of any activity should be stated or described using the evidence at hand in order to thoroughly assess the potential courses of action. After that, a well-informed choice based on the arguments and supporting data can be made.
To support a decision:
Identify the main consequences
Give a case to demonstrate how the choice strikes a balance between these to get, in your opinion, the optimal result.
Ethical considerations
Certain questions are outside the purview of science. Whether a course of conduct and its effects are ethical or wrong is a matter of ethics.
This may have to do with the actual study of science or its applications. Science by itself is unable to offer a solution. The pros and negatives of their decision-making must be taken into account.
Sharing ideas
Speaking with a variety of audiences—including the general public, other scientists, and politicians—about their work is the greatest method for scientists to ensure that all points of view are taken into account.
This allows the scientist to make the best choice that will benefit the most number of people by providing input on the risks, benefits, costs, and ethical considerations.