Descriptive statistics
Variance was NOT met in familiarity, as Levene’s test p > .05
Familiarity: 0.05/6 = .0083
Alcohol - cola
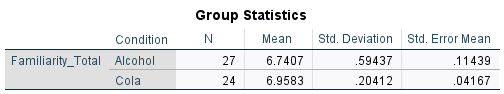

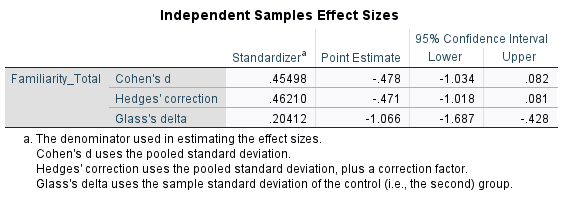
No significant difference was revealed in brand familiarity between the alcohol condition (M = 6.47, SD = 0.594) and the cola condition (M = 6.96, SD = 0.204; t(32.7) = -1.79, p = .095).
Alcohol - Core NoLo
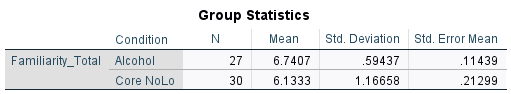


No significant difference was revealed in brand familiarity between the alcohol condition (M = 6.47, SD = 0.594) and the core NoLo condition (M = 6.13, SD = 1.17; t(44.05) = 2.51, p = .016).
Alcohol - non-core NoLo
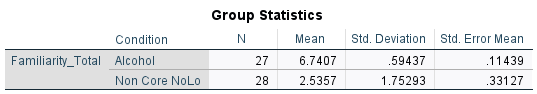

Brand familiarity in the non-core NoLo condition (M = 2.54, SD = 1.75) was significantly lower than the alcohol condition (M = 6.74, SD = 0.59; t(33.33) = 12.00, p < .001).
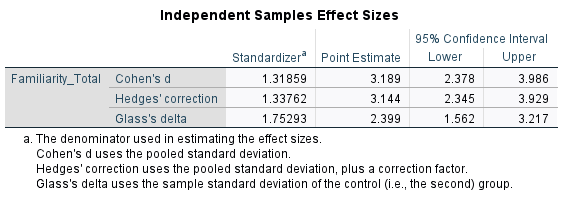
Cola - core NoLo
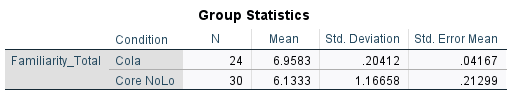

Brand familiarity in the core NoLo condition (M = 6.13, SD = 1.17) was significantly lower than the cola condition (M = 6.96, SD = 0.20; t(31.21) = 3.80, p < .001).
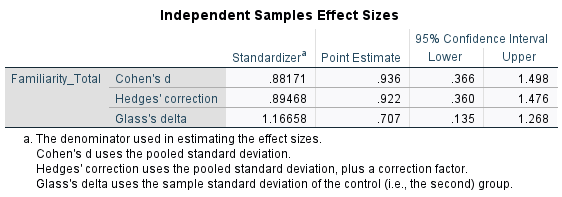
Cola - noncore NoLo
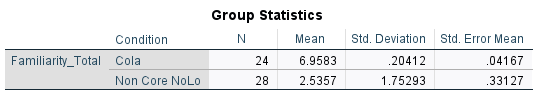


Brand familiarity was significantly lower in the non-core condition (M = 2.54, SD = 1.75) than the cola condition (M = 6.96, SD = 0.20; t(27.85) = 13.25, p < .001).
Core - noncore NoLo
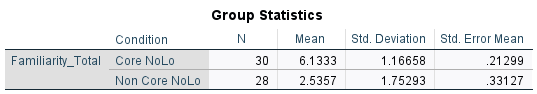
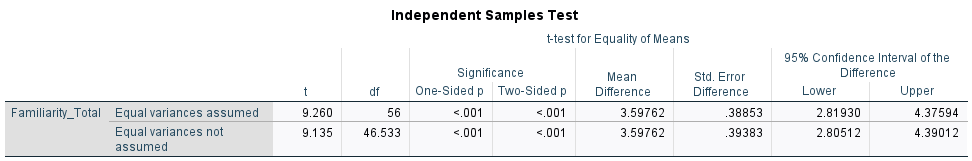

Brand familiarity was significantly lower in the non-core NoLo (M = 2.54, SD = 1.75) than the core NoLo condition (M = 6.13, SD = 1.17; t(46.53) = 9.14, p < .001).
Assumption of equal variance was met in Brand Liking
alcohol - cola
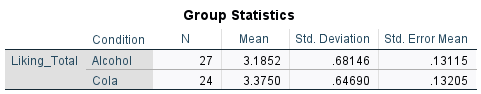
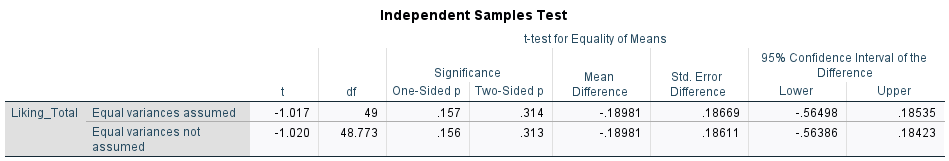
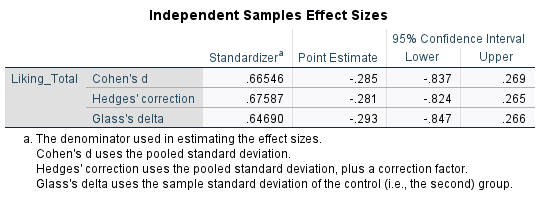
There was no significant difference in brand liking between the alcohol condition (M = 3.19, SD = 0.68) and the cola condition (M = 3.38, SD = 0.65; t(48.77) = -1.020, p = .314).
Alcohol - core NoLo


Brand liking was significantly lower in the core NoLo condition (M = 2.67, SD = 0.66) than in the alcohol condition (M = 3.19, SD = 0.68; t(55) = 2.91, p = .005).
Alcohol - noncore NoLo
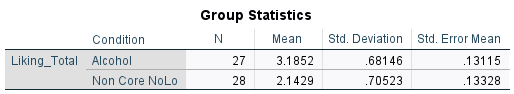

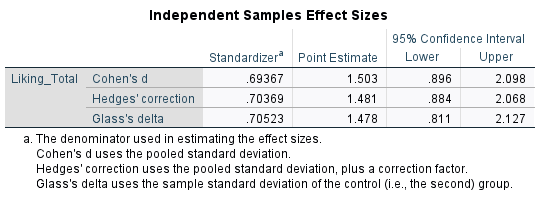
Brand liking was significantly lower in the non-core NoLo condition (M = 2.14, SD = 0.71) than the alcohol condition (M = 3.19, SD = 0.68; t(53) = 5.57, p < .001).
Cola - Core NoLo
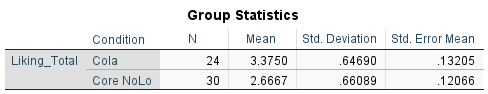


Brand liking was significantly lower in the core NoLo condition (M = 2.67, SD = 0.66) than in the cola condition (M = 3.38, SD = 0.65; t(52) = 3.95, p < .001).
Cola - Noncore NoLo
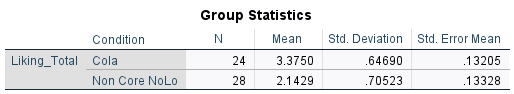


Brand liking was significantly lower in the non-core NoLo condition (M = 2.14, SD = 0.71) than the cola condition (M = 3.38, SD = 0.65; t(50) = 6.52, p < .001).
Core - noncore NoLo
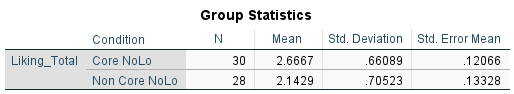
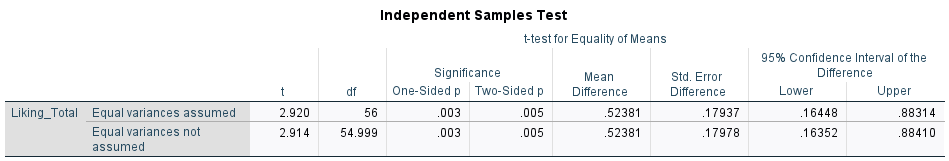

Brand liking was significantly higher in the core NoLo condition (M = 2.67, SD = 0.66) than in the non-core condition (M = 2.14, SD = 0.71; t(56) = 2.92, p = .005
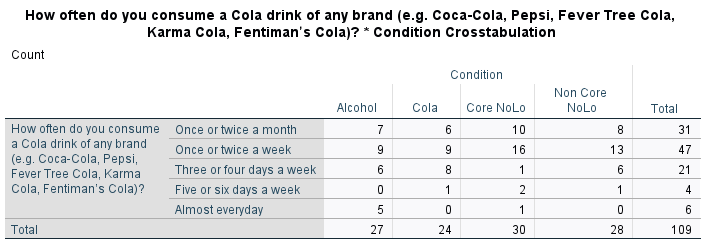
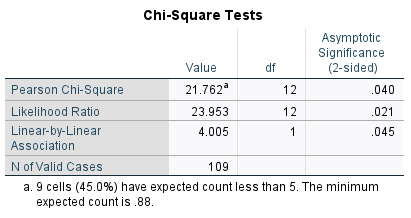
Chi - square and Kramer’s V of soft drink frequency
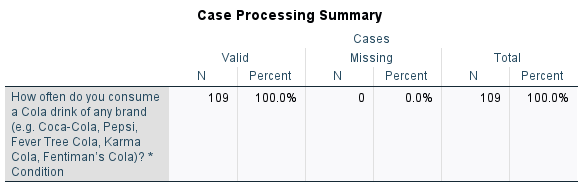
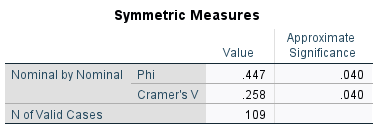
This is a small effect (Cramer’s V = 0.26) which suggests that the relationship is not very important.