Chapter 4 Notes: Sample Surveys in the Real World
Overview of Sample Surveys and Response Rates
Survey Participation and Response Dynamics
Reaching human subjects and obtaining completed survey responses presents substantial practical challenges.
Incentives, monetary compensation, or brief survey durations are frequently employed to encourage participation.
Below is an example of a corporate survey invitation sent via email to collect customer feedback:

Mathematical Formulation of Survey Metrics
Response Rate Formula:
Nonresponse Rate Formula:
Empirical Telephone Survey Outcome Breakdown
The table below illustrates contact outcomes from a real-world dual-frame survey (landline vs. cell phone):

Landline Sample Call Metrics:
Noncontacts:
Not eligible:
Other:
Unknown eligibility:
Refusals, breakoffs, and partials:
Complete interviews:
Total landline numbers called:
Cell Phone Sample Call Metrics:
Noncontacts:
Not eligible:
Other:
Unknown eligibility:
Refusals, breakoffs, and partials:
Complete interviews:
Total cell phone numbers called:
Combined Response Calculation:
Total completes across both frames:
Total phone numbers called across both frames:
Overall Response Rate:
Overall Nonresponse Rate:
Extreme nonresponse rates (such as 96.6\%$) call into question whether the participating sample remains representative of the overall target population.\n\n# Classification of Survey Errors\n\n* **Sampling Errors**\n * Errors that occur directly as a result of the act of sampling.\n * Includes deliberate or structural sampling bias (e.g., convenience or voluntary response sampling) as well as natural random sampling error.\n\n* **Non-Sampling Errors**\n * Errors that arise from factors unrelated to the act of sampling.\n * Caused by structural flaws in the experimental design, execution, data collection, or participant interactions.\n\n# Sampling Errors and Mitigation Strategies\n\n* **Types of Sampling Errors**\n * **Biased Sampling Design:** Non-probability designs (e.g., convenience sampling, voluntary response sampling) systematically favor certain outcomes over others.\n * **Random Sampling Error:** Natural variation resulting from surveying a sample subset rather than observing the entire population.\n\n* **Characteristics of Random Sampling Error**\n * It is inherent and unavoidable in any sample-based study.\n * Margin of Error (MOE) in formal confidence statements exclusively accounts for random sampling error.\n * MOE does **not** account for nonresponse, bad wording, interviewer bias, or sampling bias.\n * **Reduction:** Increasing the sample size n reduces random sampling error.\n * **Elimination:** Conducting a full population census completely eliminates random sampling error.\n\n# Non-Sampling Errors\n\n* **Primary Sources of Non-Sampling Errors**\n * Nonresponse bias.\n * Misleading or poorly worded survey items.\n * Interviewer bias (influencing responses intentionally or unintentionally).\n * Data entry errors by researchers.\n * False responses supplied by subjects (either accidentally or intentionally).\n\n* **Strategies for Mitigating Nonresponse**\n * **Alternative Contact Methods:** Follow up with nonresponders using different modes of communication (e.g., switching from phone calls to email outreach).\n * **Household Substitution:** Replace nonresponding households with demographically similar households using historical demographic data (Note: this practice can introduce secondary errors).\n * **Probability Weighting:** Adjust final estimates by mathematically weighting responses based on known population distributions.\n\n# Probability Weighting and Population Adjustment\n\n* **Mechanics of Probability Weighting**\n * If a demographic subgroup's response rate is below its population proportion, responses from that subgroup are assigned a higher statistical weight.\n * If a demographic subgroup's response rate is above its population proportion (e.g., overrepresentation of rural areas), responses from that subgroup are assigned a lower statistical weight.\n * Real-World Weighting Example (New York Times Polls): Survey results are weighted to adjust for household size, total residential phone lines, geographic region, sex, race, age, and educational attainment.\n\n* **Worked Mathematical Example of Probability Weighting**\n\n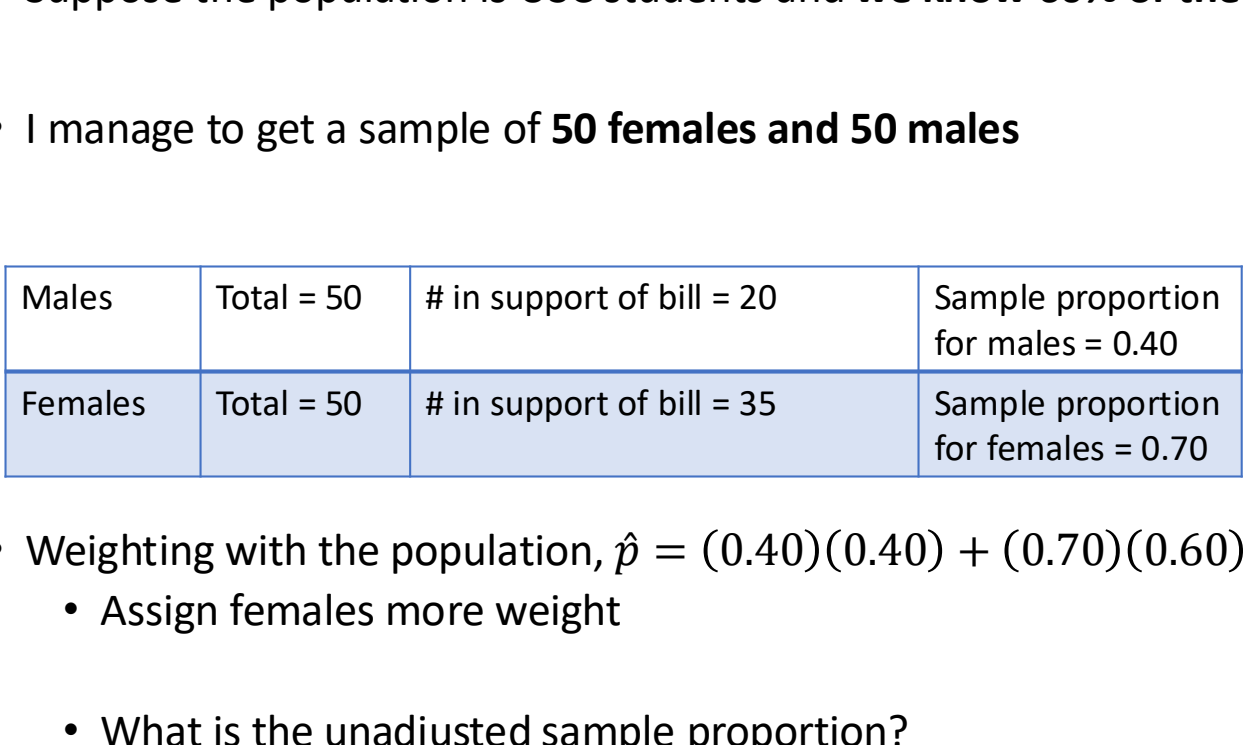\n\n * **Population Parameters:** Target population is University of South Carolina (USC) students, known to be 60\%0.6040\%0.40).\n * **Sample Collected:** n = 1005050 females.\n * **Subgroup Survey Results:**\n * Males: n_{\text{male}} = 5020.\n \hat{p}{\text{male}} = \frac{20}{50} = 0.40\n * Females: n{\text{female}} = 5035.\n \hat{p}{\text{female}} = \frac{35}{50} = 0.70\n * **Unadjusted Sample Proportion:**\n \hat{p}{\text{unadjusted}} = \frac{20 + 35}{50 + 50} = \frac{55}{100} = 0.55\n * **Weighted (Adjusted) Population Estimate:**\n \hat{p}_{\text{weighted}} = (0.40)(0.40) + (0.70)(0.60) = 0.16 + 0.42 = 0.58\n * **Conclusion:** Weighting gives females a higher weight (0.600.50 sample proportion) to accurately reflect the overall population composition.\n\n# Misleading Questions and Question Phrasing Effects\n\n* **Psychology of Wording**\n * Minor changes in sentence structure, term choice, or framing heavily alter participant responses.\n\n* **Government Spending Survey Comparison**\n * **Framing A:** "Is our government spending too much money for welfare programs?"\n * Result: 44\% of respondents answered "yes".\n * **Framing B:** "Is our government spending too much money for assistance to the poor?"\n * Result: 13\% of respondents answered "yes".\n\n* **Gallup Tax Survey Study (April 2018)**\n\n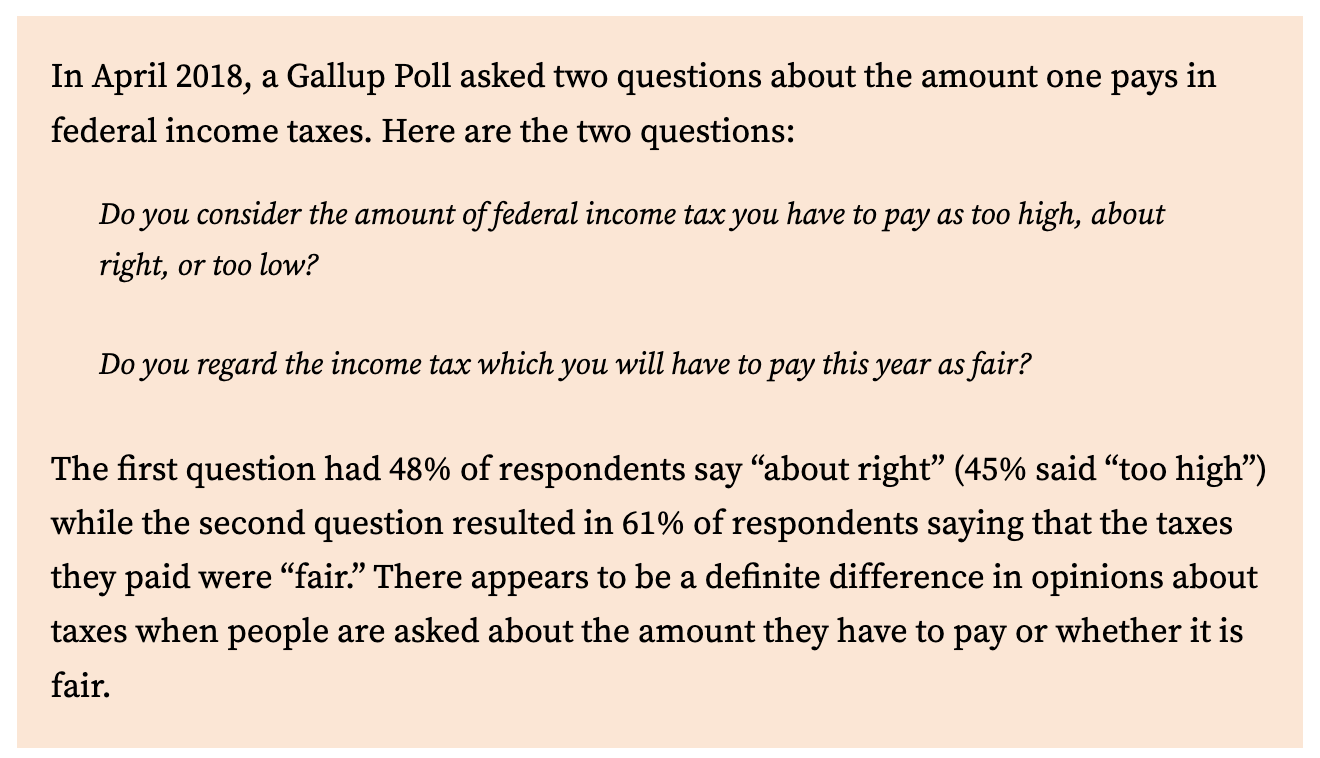\n\n * **Question 1:** "Do you consider the amount of federal income tax you have to pay as too high, about right, or too low?"\n * Results: 48\%45\% stated "too high".\n * **Question 2:** "Do you regard the income tax which you will have to pay this year as fair?"\n * Results: 61\% stated that their taxes were "fair".\n * **Analysis:** Asking respondents about the specific dollar amount yields significantly more negative sentiment than asking whether their tax burden is fair.\n\n# Response Errors and the Randomized Response Technique\n\n* **Classification of Response Errors**\n * **Accidental Response Error:** Occurs when subjects genuinely cannot recall precise details and resort to guessing or estimating.\n * Example Prompt: "How many times did you shop at Publix during the month of July?"\n * Behavioral Reality: Humans are poor estimators and consistently over- or underestimate historical behavior.\n * **Purposeful Response Error:** Occurs when subjects knowingly provide false answers to avoid embarrassment, legal consequences, or social stigma.\n * Example Prompt: "As an athlete, have you ever taken performance enhancing drugs that are prohibited?"\n * Behavioral Reality: Direct questioning regarding illicit behavior leads to severe underestimation of the population proportion p$.
Randomized Response Technique (RRT)
Designed to ensure complete anonymity when asking sensitive or potentially incriminating questions.
Procedure:
Participants are presented with two questions:
(Sensitive): "As an athlete, have you ever taken prohibited performance enhancing drugs?"
(Baseline/Neutral): "Are there seven days in a week?"
Participants randomly select a number between and (e.g., rolling a die or using a random number generator).
If the random number selected is odd, the participant answers .
If the random number selected is even, the participant answers .
The interviewer records only a "Yes" or "No" without knowing which question the participant was assigned.
Analytical Benefit: Preserves complete respondent privacy, encouraging truthful answers and enabling researchers to calculate unbiased population proportion estimates using known probability distributions.
Probability Sampling Designs
Simple Random Sample (SRS)
Every distinct sample of size has an equal probability of selection from the population.
Stratified Random Sample
Step I: Divide the total population into mutually exclusive subgroups called strata, where individuals within each stratum share specific characteristics.
Step II: Draw an independent Simple Random Sample (SRS) from every stratum.
Types: Proportionate sampling (stratum sample size is proportional to population size) vs. Disproportionate sampling (stratum sample size is intentional to oversample rare groups).


Empirical Example: 1990 Houston Intravenous Drug Study
Objective: Estimate HIV prevalence in heterosexual males who use intravenous drugs across racial groups.

* Data breakdown:
* Hispanic Stratum: , Infected = , Sample proportion
* White Stratum: , Infected = , Sample proportion
* Black Stratum: , Infected = , Sample proportion
* Combined Sample: Total , Total Infected = , Combined Proportion
* Mathematical Warning: Individual subgroup proportions cannot simply be summed or averaged directly without taking overall sample weights into account.
Cluster Random Sample
Step I: Divide the target population into naturally occurring sub-units or groups called clusters.
Step II: Randomly select a subset of full clusters, and sample individuals within the selected clusters.

Applied Example: Studying teenager eating habits in Columbia, SC.
Define 33 high schools as distinct clusters.
Randomly select 6 high schools out of the 33, and collect data from students within those 6 selected schools.
Comparative Analysis: Stratified vs. Cluster Sampling
Stratified Sampling Characteristics
Subdivides population based on shared homogeneous characteristics (e.g., sex, race, age, income bracket).
Primary Purpose: Ensures adequate representation of key demographic subgroups and enables robust cross-group comparative analysis.
Data Collection: Samples are drawn from every established stratum.
Cluster Sampling Characteristics
Subdivides population into miniature heterogeneous representations of the target population.
Primary Purpose: Administrative efficiency, logistical convenience, and cost reduction.
Data Collection: Only a subset of selected clusters is sampled; non-selected clusters are ignored.
Systematic and Multistage Combination Sampling
Systematic Random Sample
Selection occurs at fixed, pre-determined numerical increments from an ordered sampling frame.
Examples: Selecting every retail customer, every registered student, or every unique website visitor.
Benefit: Removes subject selection bias from field researchers.
Multistage Combination Sampling
Combines multiple probability sampling methodologies sequentially to solve complex field research challenges.
Applied Example: Sampling adult residents of South Carolina:
Stage 1 (Cluster Sampling): Use the counties of South Carolina as clusters; randomly select a sample of counties.
Stage 2 (Stratified Sampling): Within each randomly selected county, perform stratified random sampling based on demographic variables (e.g., sex, race, political affiliation).