Ch 53-54 Notes
Characteristics of Populations:
Density
Distribution
Age Structure
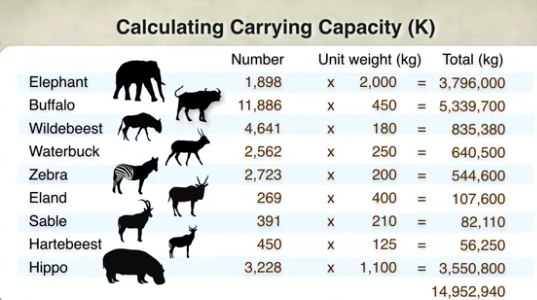
Carrying Capacity
mortality rate
one useful sampling technique for estimating population density is the mark-recapture method

Sampling Methods:
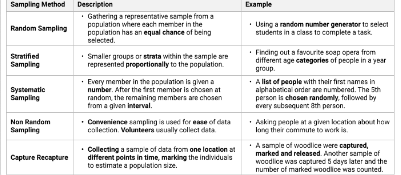
Population Characteristics:
Density: # of individuals per unit of area; counts:
sample size estimate(sometimes possible to count individuals)
indirect indicators
mark-recapture
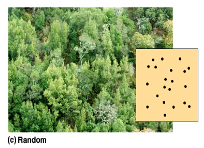
Dispersion: pattern of spacing
random;unpredictable, patternless spacing
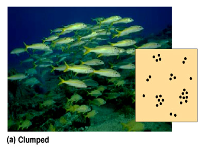
clumped- patchy aggregation (most common in nature)(has to do with available resources, not territory)
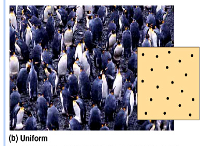
uniform-even spacing(usually territorial behavior)
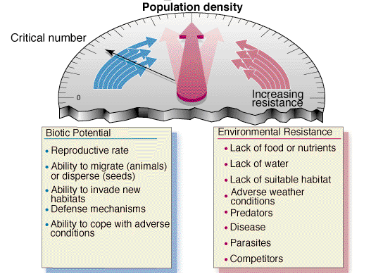
Biotic Potential (r max)
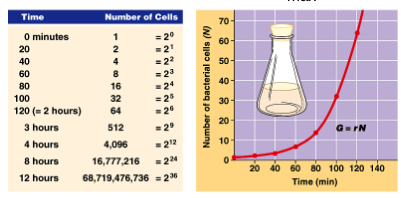
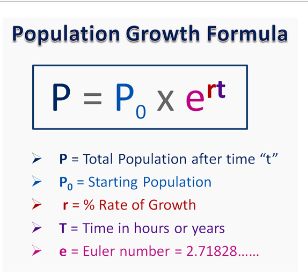
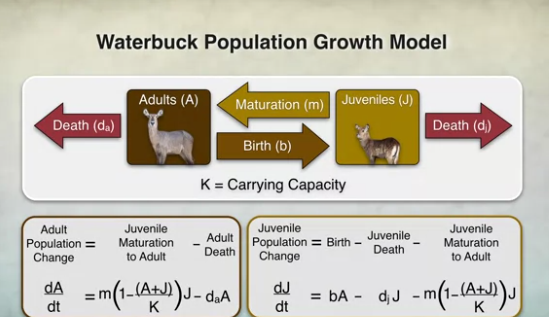
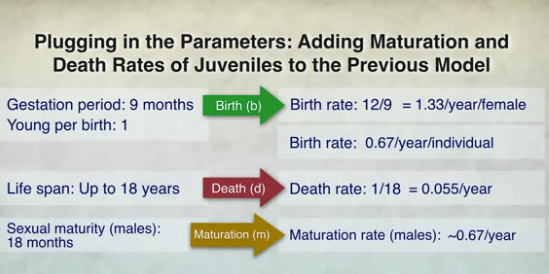
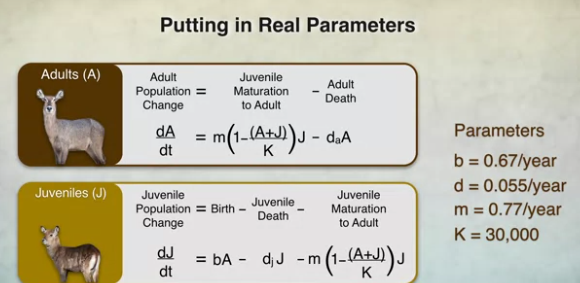
Exponential growth is the accelerating increase that occurs during a time when growth is unregulated
A J-shaped growth curve described by equation G = rN is typical of exponential growth
rN tends to cause the population to grow increasingly rapidly(r is difference between birth and death rates, is pop. size, therefore rN is population growth rate)
G = population growth rate
r = intrinsic rate of increase/ organism’s maximum capacity to reproduce
r = (birth rate - death rate) + (immigration rate - emigration rate)
N = population size
Influences that regulate pop. growth rates
competition
territoriality
health
predation
intrinsic factors(physiological)
other extrinsic factors(environmental)
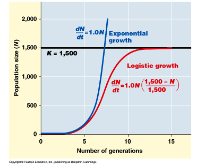
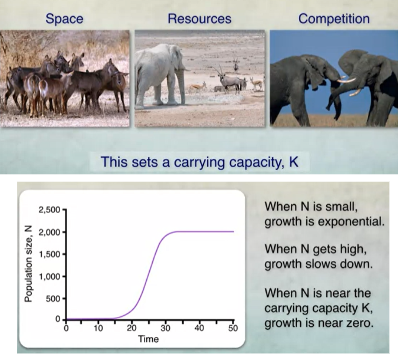
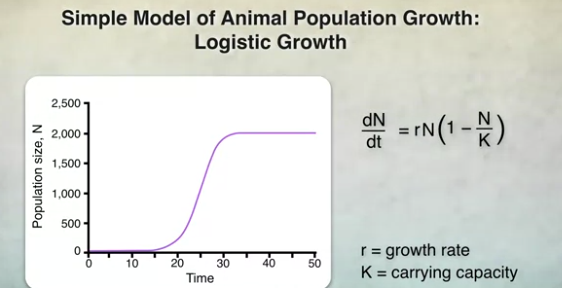
Equation G = rN(K-N)IK describes a logistic growth curve
K = carrying capacity
(K - N)IK = accounts for leveling off of the curve
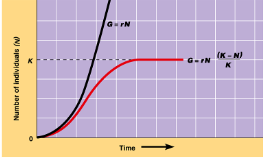
Logistic growth is slowed by population limiting factors
tends to level off at carrying capacity
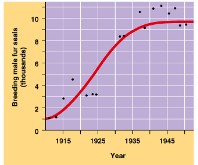
Population Growth Models
Exponential model(blue)
idealized population in an unlimited environment (J-curve)
r selected species (r=per Capita growth rate)
Logistic model(red)
carrying capacity(K): maximum population size that a particular environment can support (S-curve); K-selected species
Density Controls
Life Tables
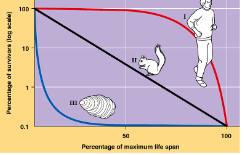
Life Tables and survivorship curves predict an individual’s statistical chance of dying or surviving during each interval in its life
Life tables predict how long(on average), an individual of a given age can live
Population ecologists have adopted this technique, construcuting life tables for various plant and animal species
Type 1 Survivorship: a K selected species(humans)
live long, few offspring (maternal care)
mortality is later in life
low rates of juvenile mortality
Type 2 Survivorship: intermediate (plants, lizards)
mortality is equal across all age groups ( probability of survivorship does not change with age)
Type 3 Survivorship: a r-selected species
mortality is high right after birth (high rate of juvenile mortality)
small body, no paternal care
high production of offspring(weeds, fish, asexual reproducers)
Survivorship curves plot proportion of individuals alive at each age
3 types of survivorship curves reflect species differences in life
R-Selected Species(density independent selection)(high reproductivity, short lifespan)(unrelated to population size)
high population growth rate (r=growth rate)
tends to maximize r, fluctuates well below carrying capacity
small body
early maturation
short lifespan
large broods
little or no paternal care
considered as opportunistic
found in environments that are temporary, unpredictable, and variable
low survivorship; die early
face little competition
ex: weeds, dandelions, asexual reproducers
K-Selected Species(density dependent selection) (humans; low reproducitvity, high life span)
number of individuals is near carrying capacity (K)
(tends to maximize population size at/near “K”
sensitive to population density
large body
low reproductive rate
produce few offspring
long lifespan
development is slow(late maturation)
parental care and protection of young
found in stable environments
ex: birds and mammals
Density Independent factors:
unrelated to population size(ex: temperature
affects same percentage of the population regardless of population density
NOT: accumulation of toxic wastes(increases and decreased with population size)
NOT: disease(spread increases and decreased with population size)
NOT: food availibilty(increases and decreased with population size)
NOT: Parasites(eash with which Parasites spread increases and decreased with population size)
Density Dependent factors:
predators
affects larger percentage of the population as population density increases
competition with individuals
food supply
Semelparity - (one time reproduction)
“Big Bang” reproduction
ex: agave and annual desert flowers
(obs. in highly variable or unpredictable environments)
Iteroparity - (repeated reproduction)
ex: lizards
(obs. in dependable environments/competition for resources are intense)
Life Histories - Follows a “cohort”
an organism’s life history is the series of events from birth through reproduction to death
Life history traits include:
age at which reproduction first occurs
frequency of reproduction
number of offspring
amount of parental care given
energy cost of reproduction
when reproduction begins, how often organism breeds, and how many offspring are produced during each reproductive episode
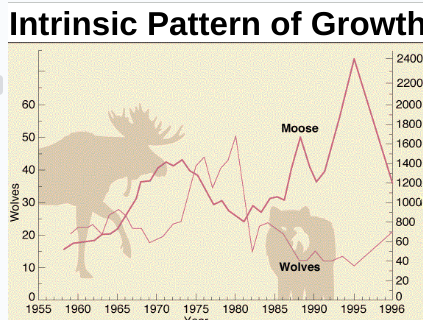
Boom-and-bust cycles of growth and decline
ex: population cycles of the lynx and the snowshoe hare
lynx is one of main predators of snowshoe hare in northern forests of Canada and Alaska
Intrinsic Growth Pattern
Human Population
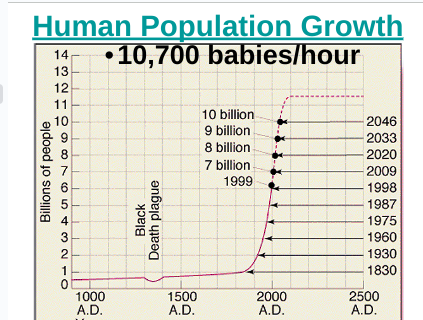
pop. doubled 3 times in the last 3 centuries
Increase due to improved health and tech and decline in death rate
birth rate has decreased
growth rate: 1-2% per year
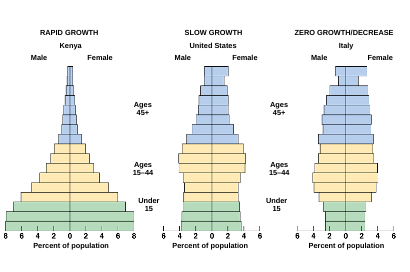
Zero Population growth: ZPG, number of people in specified population neither grows nor declines; number of births plus in-migrants equals the number of deaths plus out-migrants.
Age Structures Diagrams
percentage of age groups in a population; pre-reproductive, reproductive, post-reproductive
helps predict future growth
can show if population is increasing, decreasing, or constnat
shape matters:
pyramid vs tapered base (funnel)
We Study Communities by Examining these Factors:
Number of species present
abundance of each species
defining their niche
interactions (ex. Predator/prey)
resiliency to a disturbance (succession)
energy and nutrient flow(food webs and geocycles)
productivitie(autotrophs)
Aspects of a Community
composed of a variety of species and all of the abiotic factors
lack of precise boundary
involves all of the interactions that occur between each species
diverse and complex
difficult to study accuratley(many variables)
has obvious patterns and processes
Examples of Communities
hydrothermal vent
rotting logs
pond
tree canopy
intertidal zone
Interactions in a Community
Interspecific: interactions between populations of a different species within a community
less intense
Intraspecific: between SAME species; intense
Predatory/prey: adaptations and protective traits
mimicry
warning coloration
cryptic coloration
Predation: the interactions in beneficial to one species and detrimental to another(including parasitism; may involve a keystone species/predator)
Competition: interaction detrimental to both species
Commensalism: one species benefits from the interaction but the other is unaffected(or harmed)
ex: epiphytes and forest trees
pearl fish and sea cucumber
Mutualism: interaction is beneficial to both species, facultative, not required
ex: rhinos and oxpeckers, trees and fungi
ants and acacia(ant protects aphids eggs, feeds larva, tends them, keeps them safe, aphid supplies ant with food it secretes from its body)
pollination(need insectsm bads, birds, and some mice to assist them, animals eat nectar and pollen)
The Niches
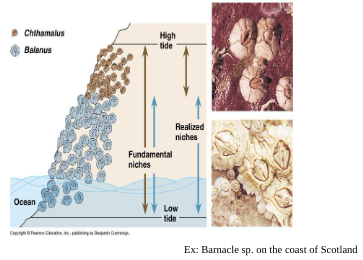
Ecological niche: the sum total of an organism’s use of biotic and abiotic resources in its environment
Fundamental: the set of resources a population is theoretically capable of using under ideal conditions
Realized: the resources a population actually uses
thus, 2 species cannot coexist in a community if their niches are identical
Dominant Species in a Community
dominant Species in the community
other species are dependent on its presense
most successful at avoiding predation and disease
when removed, Major changes
invasive species(human introduced) are examples
ex: American Chestnut tree
Keystone Species:
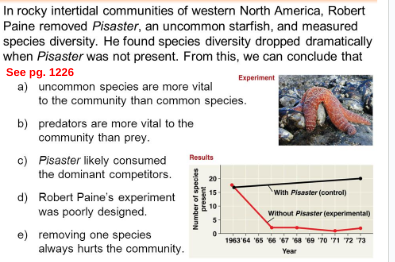
maintains the species diversity in a community
not always the most abundant species
control the structure of the community
ex: pisaster and Mytilus, sea otters, coyote
Key Members of community
need certain limited resources
critical element when describing an ecosystem
Competition Evidence:
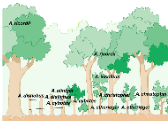
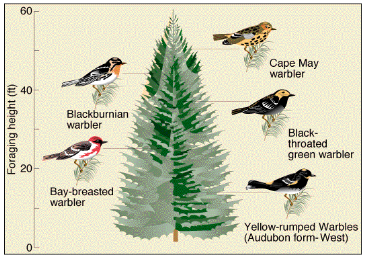
Resource partitioning: sympatric species consume slightly different foods or use other resources in slightly different ways
ex: seven species lizard(Anolis) perching sites in Dominican Republic
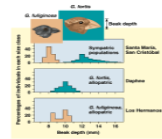
Character displacement: sympatric species tend to diverge in those characteristics that overlap
ex: Darwin’s finch break size on the Galapagos Islands
Predation Defense:
cryptic: camouflage, coloration
aposematic: warning, coloration
mimicry: superficial resemblance to another species
batesian: palatable/harmless species; mimics an unpalatable/harmful model
mullerian: 2 or more unpalatable, aposematically colored species resemble each other
Mimicry:
batesian: palatable(harmless) mimics the harmful model
mullerian: two or more unpalatable mimic each other
mostly a prey technique
optical illusions
looks like a predator
school of fish; fase eyes, filled neck and inflation
Predator Strategies:
Structural advantages
natural weapons - fangs, clws
flexible bodies
larger size
Ambush
stalk victim
gape and suck (fish)
keen eyesight
venom
Speed and Cunning
more intelligent than prey
run faster than prey
hunt in packs
Prey Strategies:
Defense Techniques
inflate, flee, fight back, stab, poison
Structural Advantages:
hard body coverings
thorns or spines
break away body parts
natural weapons
Chemical Warfare
blinding ink, poison, offensive smells and tastes
Camouflage
color change, counter-shading, disruptive patterns, mimicry(batesian, mullerian)
Species Diversity
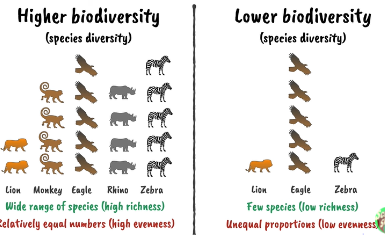
Tropical rainforest/coral reefs= HIGH diversity
Deserts and mountain tops = LOW diversity
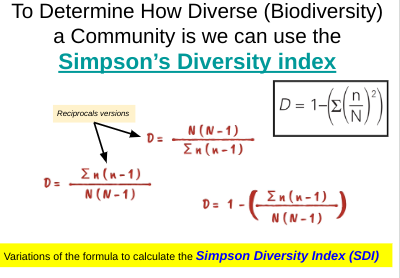
Determining Diversity of a Community(Biodiversity)
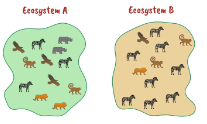
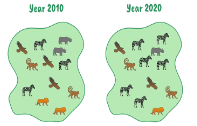
between TWO different communities OR how the diversity has changed over time
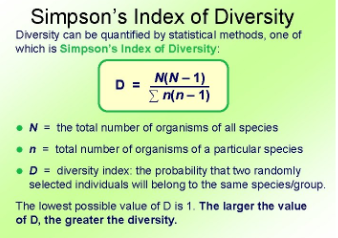
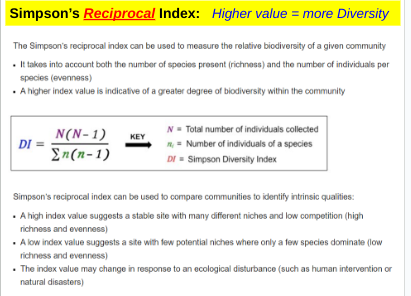
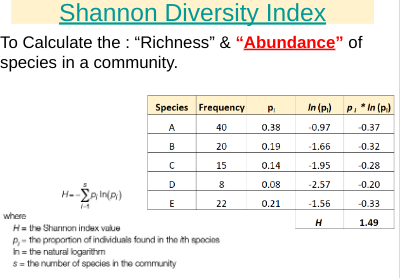
examine “richness” (number of species) and the “evenness” (relative population of each species)
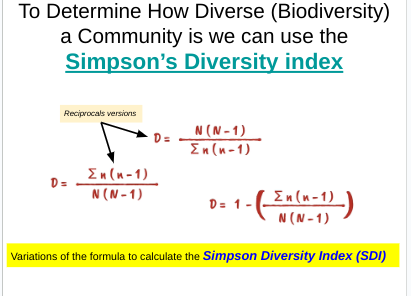
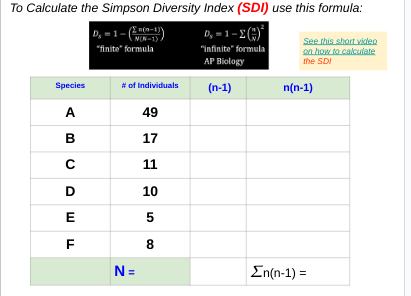
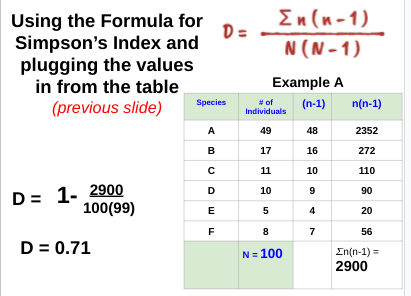
Measuring biodiversity - Simpson index
Shannon Diversity Index
How Communities Change Over Time
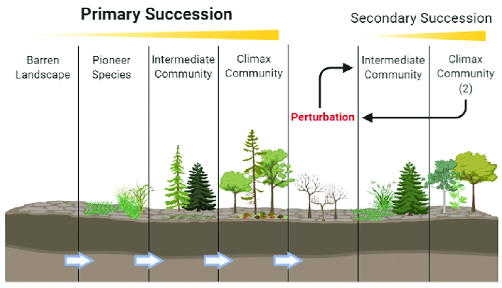
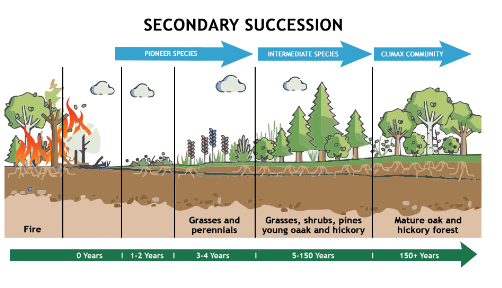
Succession: a process of community development that involves a changing sequence of species
Ecological Succession: transition in species composition over ecological time
Primary: begun in lifeless area: no soil, perhaps volcanic activity or retreating glacier
ex: Lichens
Secondary: an existing community has been cleared by some disturbance that leaves the soil intact
Why are Disturbances Important?
can foster greater species diversity
some are important to maintain the community
freezing in lakes and ponds
fires in grasslands and chaparral
Fire disturbance:
needed for reproduction
for clearing out competitors
Introduced Species:
6500 species introduced to U.S.
annual costs: billions
30% are due in part to exotics
introduced species:
no natural enemies
can outcompete natural spcies
As Ecosystems Mature:
increase in diversity and pop numbers
increased system stability
increase in biomass
decrease in net productivity
greater capacity to hold nutrients