002 choices and constraints
The economic system
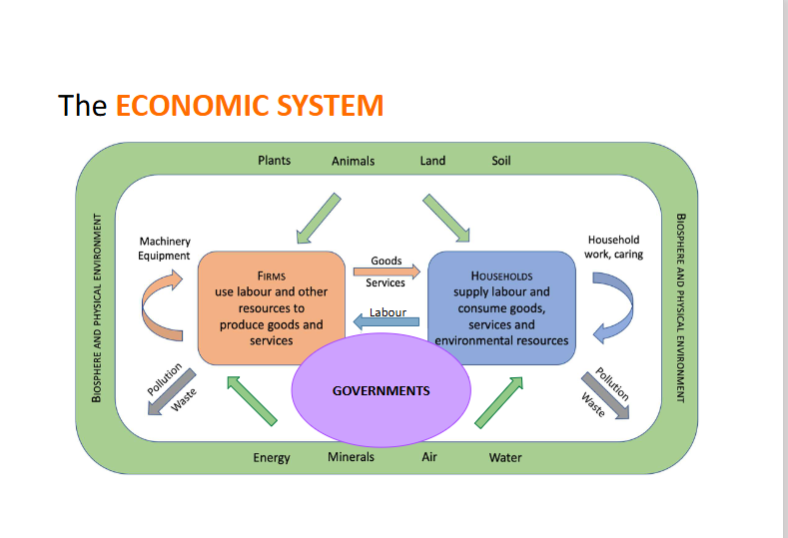
We aim to explain:
Inequality (wealth and income)
The environment
The global world
the environment and technology
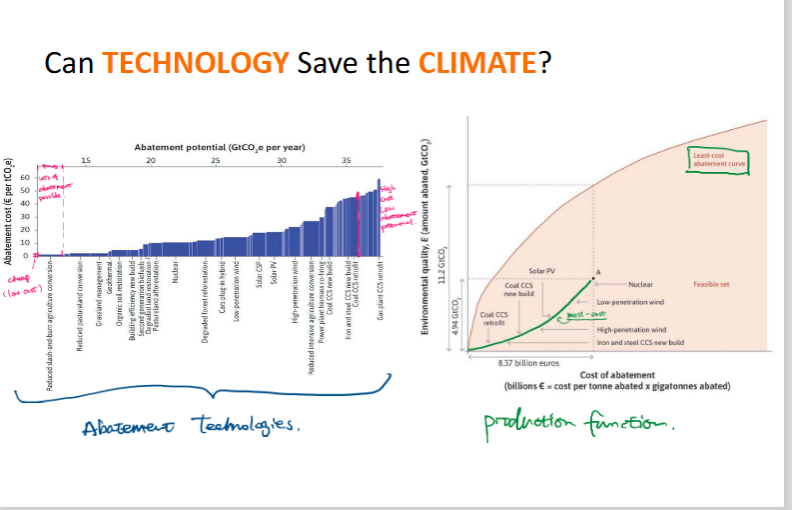
More expensive technologies can lead to reduced carbon emissions/ a better environment
Developing countries cannot afford to spend these amounts- They prioritise reducing poverty (High cost of abatement)
Major categories of abatement opportunities:
energy efficiency
low-carbon energy supply
Terrestrial carbon (forestry, agriculture)
Technical measures
Behavioural changes
How the government can incentivise these:
Subsidies
information
taxation (change relative prices)
regulation
quotas
tradeable permits
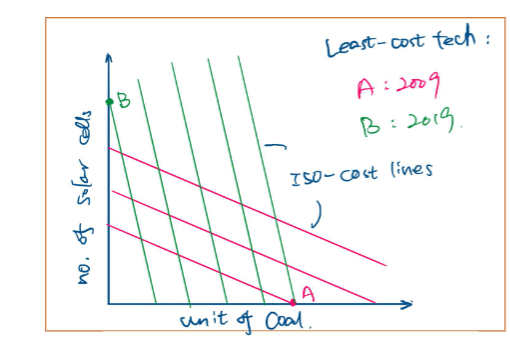
Relative price of solar power has declined in the last 10 yrs
Understanding individual choice
There is a problem of scarcity
Constrained choice problem: how we can do the best for ourselves, given our preferences and constraints, and when the things we value are scarce?
Solution: optimal choice condition
However this is unlikely to always apply in day to day life: Humans are irrational beings, and most people don’t make these calculations
also depends on elasticity
feasible set
Shows the set of possible choices you can have given constrains (economic, physical or other)
The feasible frontier is downward sloping due to opportunity cost
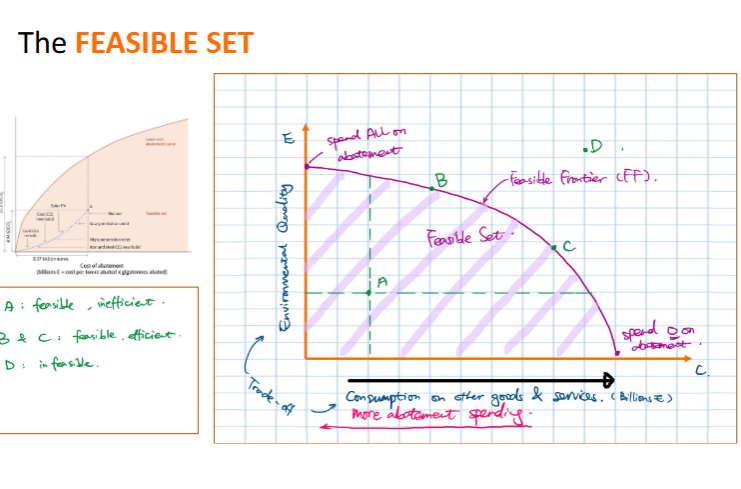
Point D is infeasible due to scarcity of resources
Point A is inefficient as not all resources are being used efficiently
points B and C are both feasible and efficient
opportunity costs
When taking an action implies forgoing the next best alternative action, this is the net benefit of the foregone alternative.
Economic cost = The out-of-pocket cost of an action, plus the opportunity cost
Economic rent is A payment or other benefit received above and beyond what the individual would have received in their next best alternative
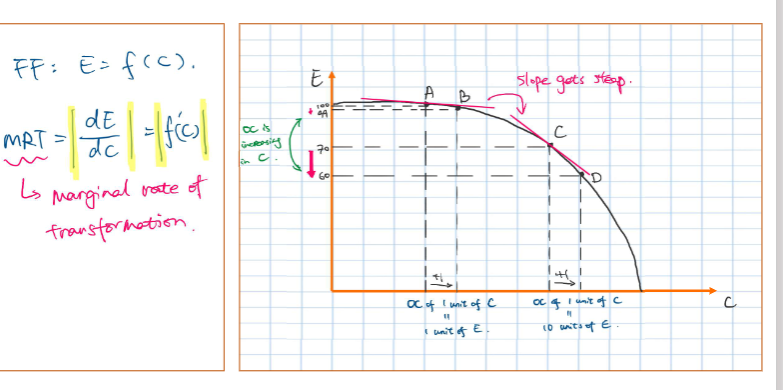
There is a trade off between environmental quality and consumption of other g&s
one has to be sacrificed for the other
The MRT is the slope of the FF, and gets steeper as C increase
the MRT is The quantity of some good that must be sacrificed to acquire one additional unit of another good.
the opportunity cost of consumption therefore increases (from 1 unit of E to 10 units of E)
preferences
A description of the benefit or cost we associate with each possible outcome.
Shown by indifference curves: utility function
indifference curves show all the possible combinations that provide a given level of utility to the individual
Utility: A numerical indicator of the value that one places on an outcome, such that higher valued outcomes will be chosen over lower valued ones when both are feasible.
The MRS is the slope of the indifference curve
It is diminishing - the amount of E you are willing to sacrifice for a unit of C falls
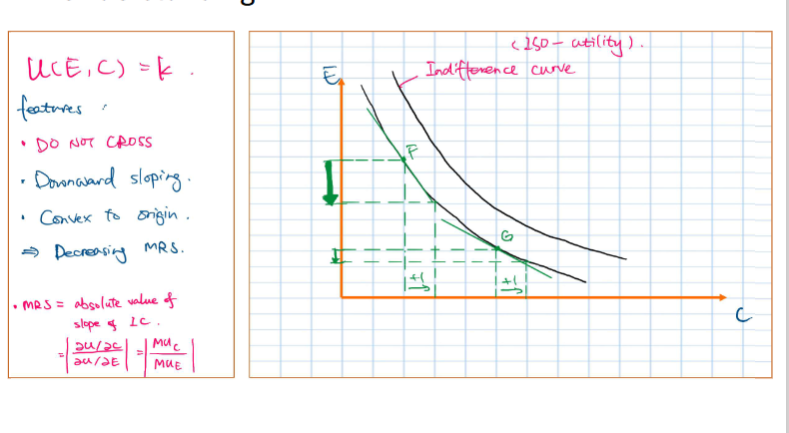
Indifference curves slope downward due to trade-offs: If you are indifferent between two combinations, the combination that has more of one good must have less of the other good.
-Higher indifference curves correspond to higher utility levels: As we move up and to the right in the diagram, further away from the origin, we move to combinations with more of both goods.
-Indifference curves are usually smooth: Small changes in the amounts of goods don't cause big jumps in utility.
-Indifference curves do not cross:
-As you move to the right along an indifference curve, it becomes flatter.
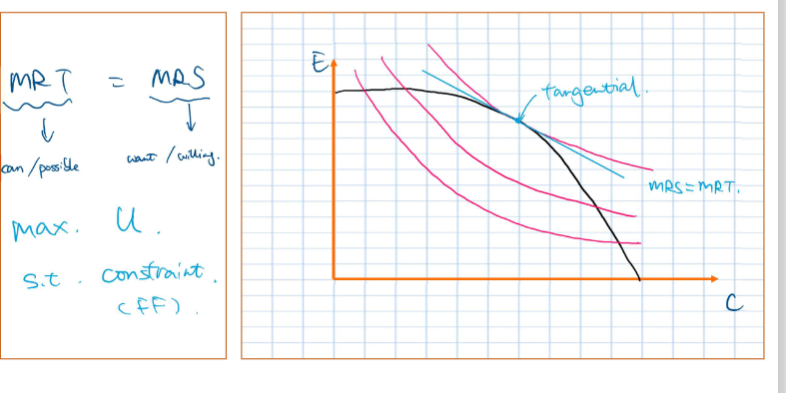
Optimal choice
Shows the maximum utility someone can achieve within the resources available (constrained optimization)
A shift to a different indifference curve is caused by an increased range in options (feasible set). This increases overall satisfaction
optimal choice lies at MRS=MRT (assuming the aim is to maximise utility)
here, Utility is maximised
Decomposition of Price effect
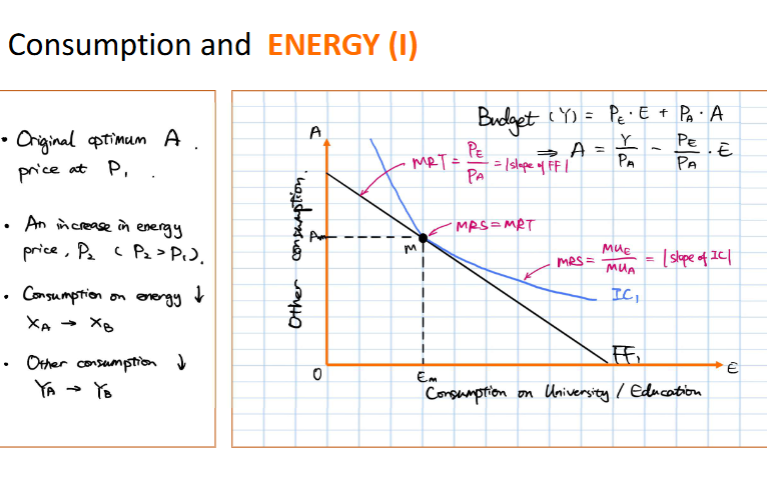
the FF represents a budget constraint
When energy prices increase, the budget constraint tightens (less real income), and overall consumption falls
the budget constraint becomes steeper since the relative price of energy is higher
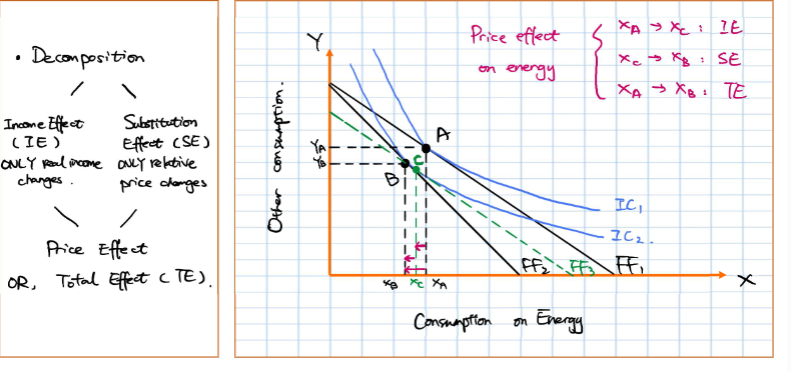
Income effect
A change in the price of a good alters people’s real
income, expanding or shrinking the feasible set of purchases. The
effect of this change in real income on the goods purchased is the
income effect.This is is represented by moving from point M to point X on FF3 on the diagram, as the budget becomes smaller
Substitution effect
When the price of a good changes, the
change in the consumption of the good that is due to the change in
relative prices (holding constant the buyer’s real income) is the
substitution effect.Shown by the movement from point X to point N on the diagram, where the FF is steeper (energy relatively more expensive than other goods)
Occurs when utility is held constant (on the same indifference curve)
Price cap on energy and optimal choice
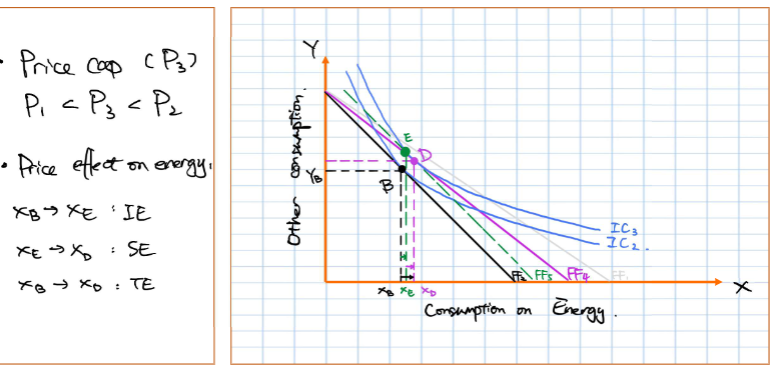
When there’s a price cap on energy, real income rises, so the FF shifts outwards to FF5 (income effect)
The relative price of energy falls, so the budget constraint becomes flatter (FF4)
The optimal bundle lies at point D, where MRS=MRT
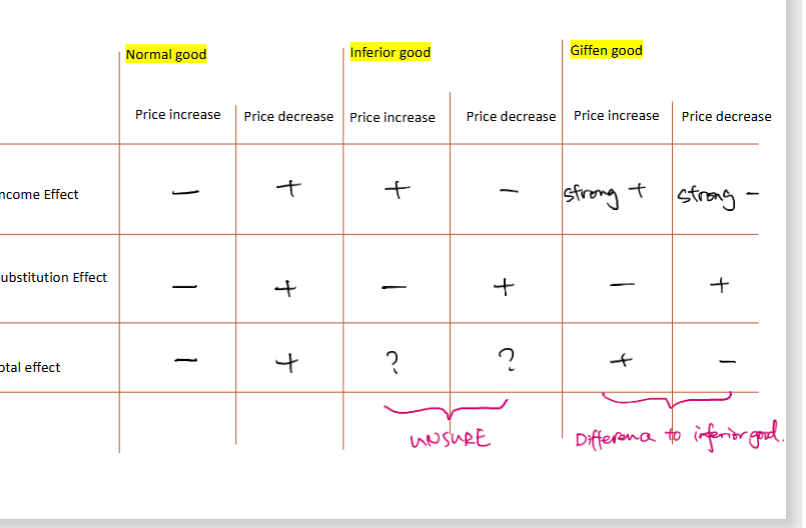
Types of Goods and price effects
Fall in bus travel example
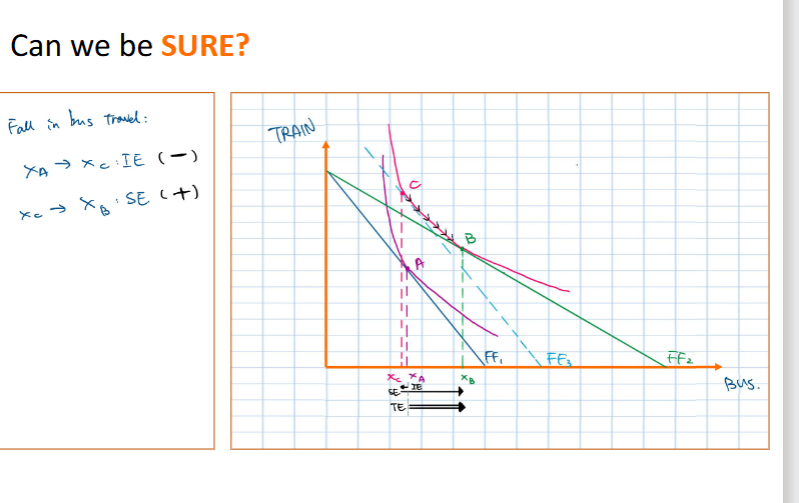
When bus fares fall, there is a negative income effect since real income has risen. Bus travel has not increased
the bus is an inferior good
There is a positive substitution effect, more people take the bus because it is relatively cheaper than the train
In this case, the substitution effect dominates the income effect (bigger than the negative income effect)
Price effect and working hours
If workers earn additional income:
- Budget constraint shift upwards: feasible set expands
-Opportunity cost of time doesn't change
- new ideal point of allocation of time on new budget constraint curve
income effect: Budget constraint shifts outwards, increases your consumption for each level of free time, willing to take more free time
substitution effect: the slope of the budget constraint (MRT) is steeper, so there us more incentive to work (more OC cost of free time)
Therefore working hours will increase
Budget constraint equation for consumption and free time:
C=w(24-t)
w=wages
t=no. of hours
Optimal consumption and free time bundle: MRS = MRT=𝑤 (differentiation of utility function)
Effect of Carbon tax
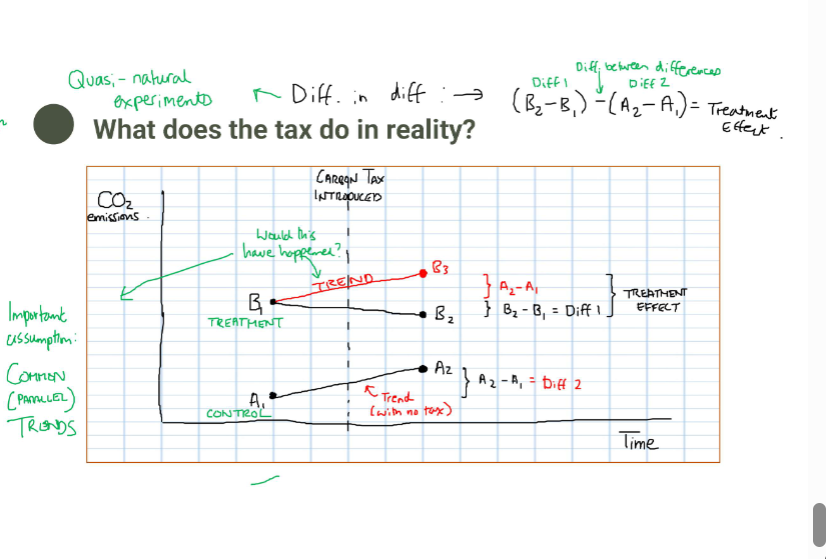
Without tax, B3 would have occurred
the actual difference tax makes is the change from B3 to B2
Key terms and questions
Utility: Utility refers to the satisfaction or happiness a person gets from consuming a good or service. It helps explain why people choose certain products based on how much value or enjoyment they expect to receive. For example, if eating a slice of pizza makes someone feel satisfied
and happy, that feeling is the utility they get from the pizza.Marginal Rate of Transformation: It measures how much of one good a business or economy must give up to produce more of another good. It shows the trade-offs between two goods when resources are limited.
For example, if a factory can produce either 5 more cars or 10 fewer bicycles, the MRT between cars and bicycles is 2 bicycles for every car produceMarginal Rate of Substitution: shows how much of one good a person is willing to give up to get more of another good while keeping the same level of satisfaction. It reflects the trade-offs people are willing to make between two goods. For example, if someone is willing to give up 2 apples to get 1 orange and still be equally happy, their MRS between apples and oranges is 2
Income effect: refers to how a change in the price of a good affects a person's ability to buy things, as if their income has changed. When the price of a good drops, it's like the person has more money to spend, so they might buy more of that good or other items. For example, if the
price of movie tickets decreases, a person might use the extra money saved to see more movies or buy snacks, showing the income effect as part of the total change in what they purchase.Substitution effect: happens when a change in the price of a good leads people to replace it with a cheaper alternative, while keeping their level of satisfaction the same. When the price of a good falls, it becomes relatively cheaper compared to other goods, so people may choose to buy more of it instead. For example, if the price of coffee drops, someone might buy more coffee and less tea because coffee is now the better deal, illustrating the substitution effect as part of the total change in buying behaviour