c) Externality graphs
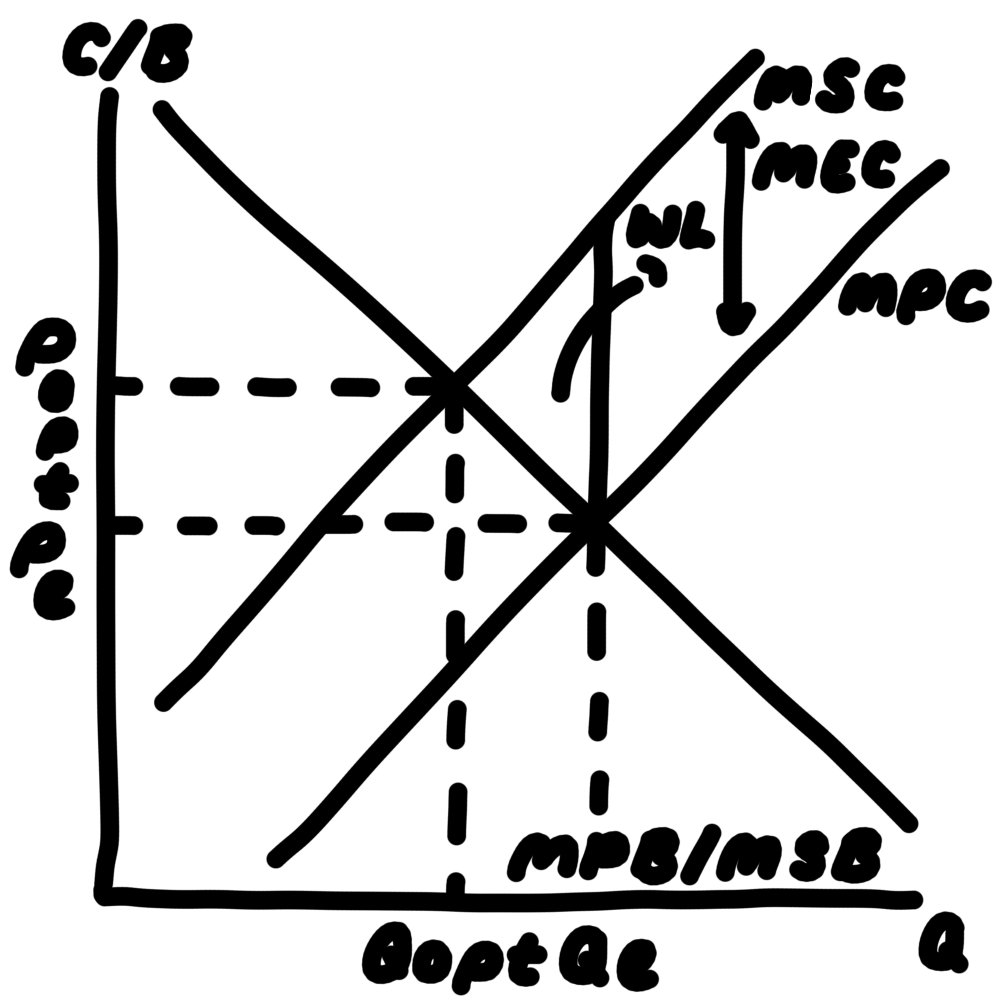
c) use of a diagram to illustrate: the external costs of production using marginal analysis, the distinction between market equilibrium and social optimum position
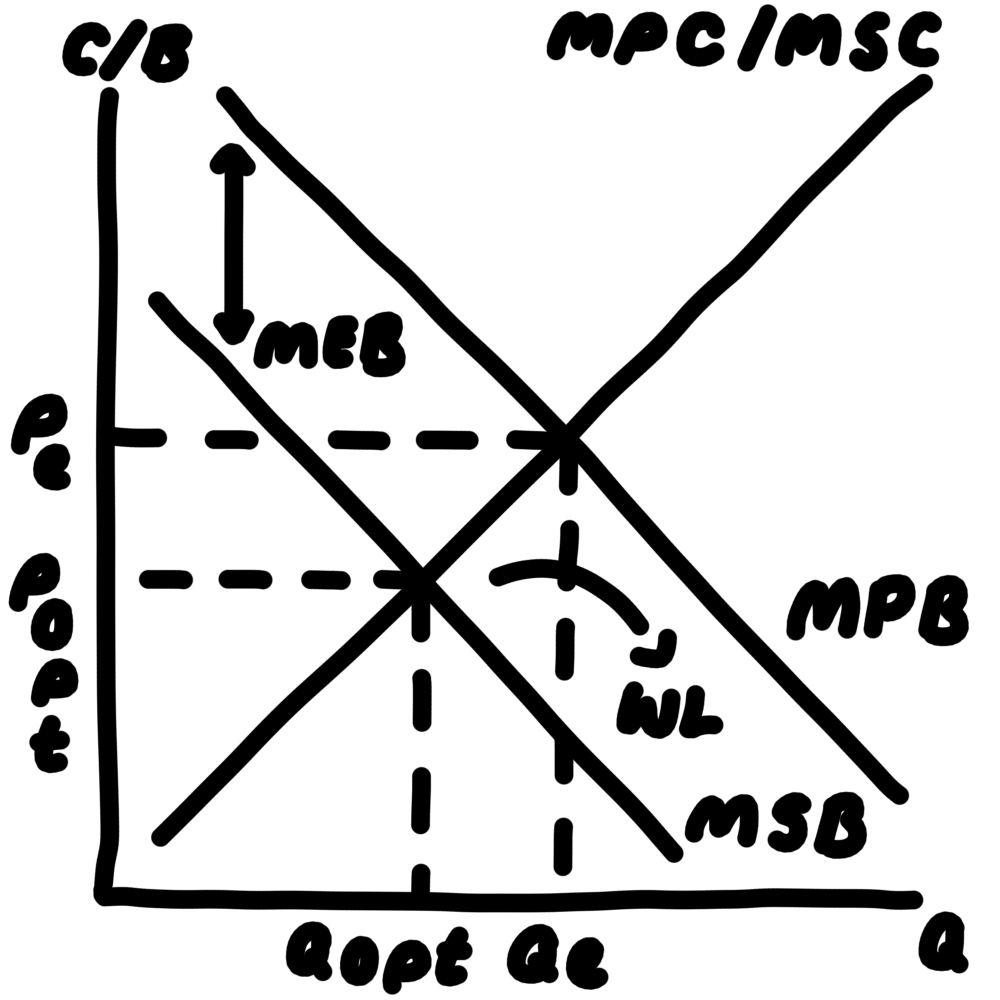
d) use of a diagram to illustrate: the external benefits of consumption using marginal analysis, the distinction between market equilibrium and social optimum position
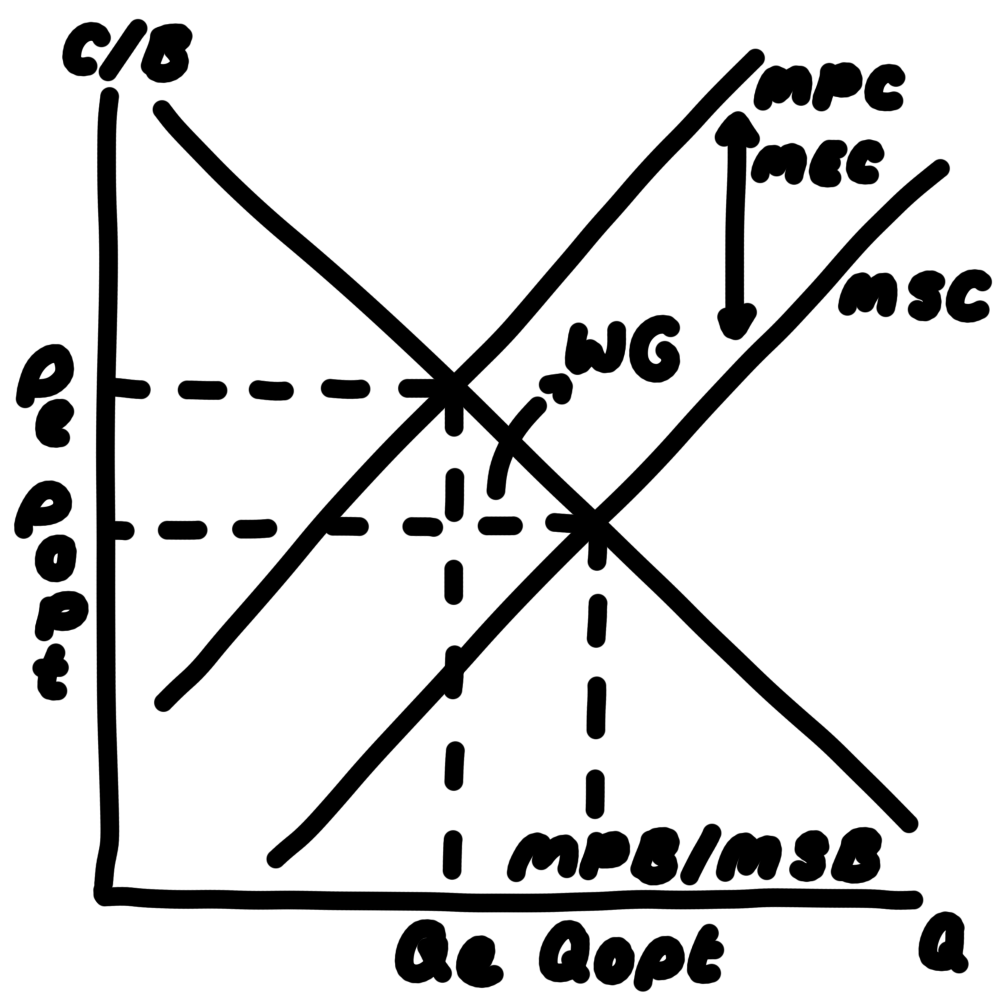
positive production externality graph
negative production externality graph
positive consumption externality graph
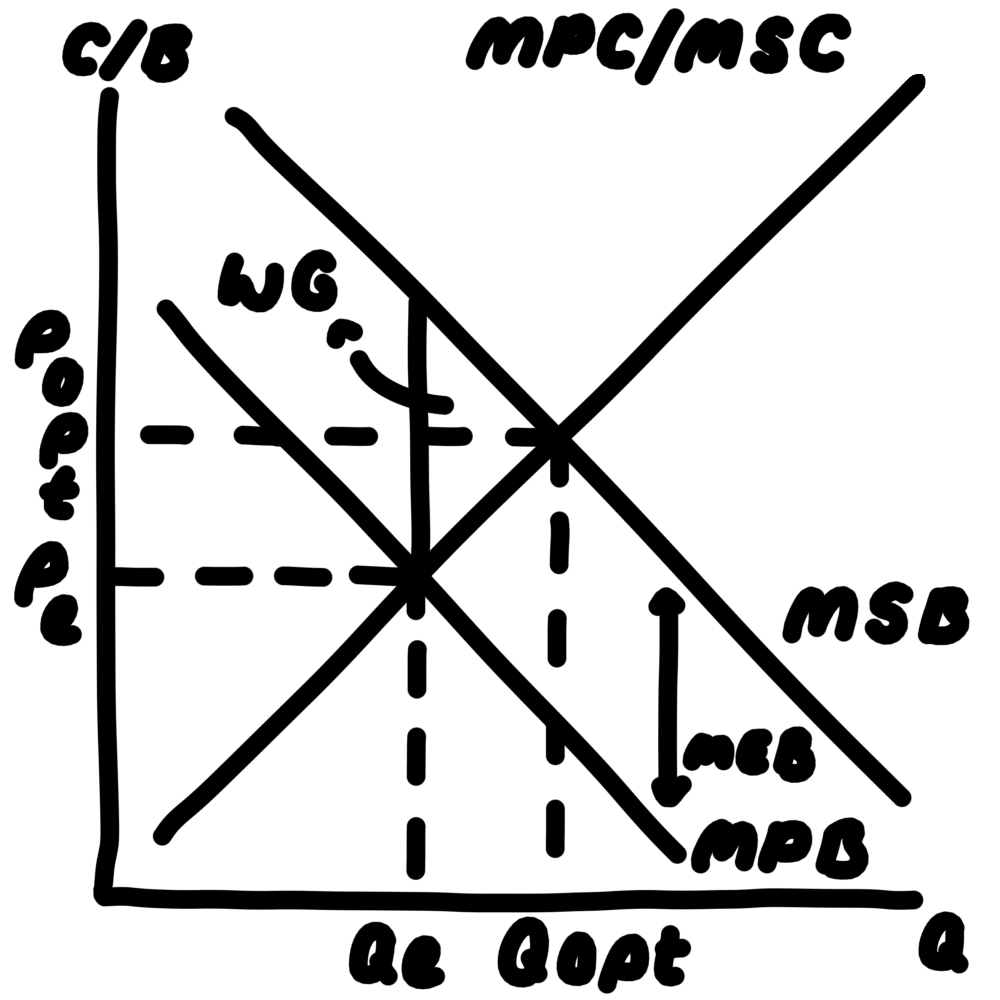
negative consumption externality graph