Challenges In The Human Environment
Urban Issues and Challenges
Characteristics of the UK
The UK's population increased to 67 million in 2020.
Largest cities in the UK:
London
Birmingham.
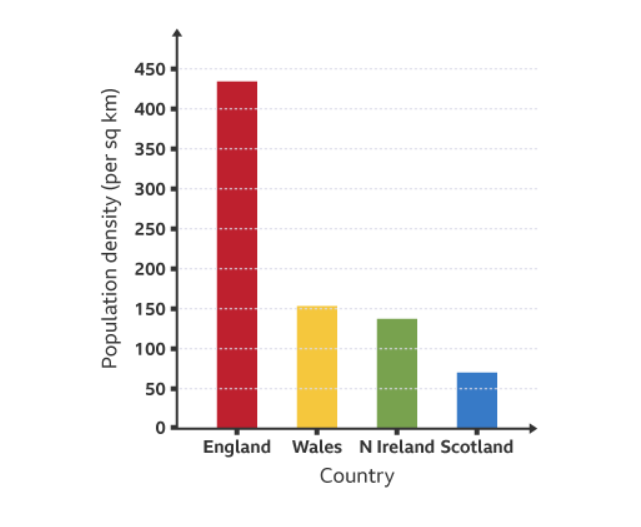
Population density of countries within the UK
Urban stability case study: Birmingham
Birmingham is located in the west midlands in England. It is the UK's second-largest city.
Opportunities
Social - ethnic and cultural diversity allows people to experience different religions and foods. The Balti Triangle is an area of Birmingham famous for its restaurants and curry houses. St Paul's Square is a popular venue for live music.
Economic - the Bullring shopping centre includes 140 shops generating employment and income for the local economy. Brindley Place is a city centre development which includes bars, retail, offices and entertainment facilities and which generates a large income.
Environmental - canals in Birmingham have been cleaned up. The towpaths have been upgraded to encourage people to walk and cycle along the canals in the city. Birmingham also has over 8,000 acres of green space and is home to Sutton Park, which is one of Europe’s largest urban parks.
Challenges:
Social and Economic:
Urban decline - Birmingham used to have a large manufacturing industry. Due to competition from abroad, most of Birmingham's manufacturing industry has now gone. This has led to urban decline as manufacturing buildings were left empty and became derelict
Inequalities in housing - Birmingham's high population has resulted in pressures on housing. There is not enough good quality and affordable housing for people in the city.
Education - the quality of education was particularly poor in inner city areas such as Aston. Aston is an area of deprivation with an ethnically diverse community where many children struggle to access and succeed in education.
Health - in Aston, people with poorer English language skills found it difficult to access healthcare facilities.
Unemployment - the closure of factories in the manufacturing industry led to high unemployment.
Environmental:
Dereliction - Abandoned structures from the manufacturing sector are common in urban areas
Development on greenfield sites - Leads to further depletion of green areas and potentially exacerbates urban sprawl. Conversely, developing on brownfield sites can revitalise abandoned spaces for new projects.
Management of waste - Urban areas with large populations generate substantial household and commercial waste, posing challenges for effective disposal.
Air pollution - Increased urban population results in higher traffic on roads, contributing to atmospheric pollution.
The Changing Economic World
Classifying parts of the world
The level of development of a country shows how economically, socially, culturally or technologically advanced that country is.
The Brandt Line
The Brandt Line refers to a visual depiction of the global North-South divide based on economic development and wealth distribution.
It was proposed by Willy Brandt, a former German Chancellor, in the 1980s.
The line separates the developed countries of the Northern Hemisphere from the less developed countries of the Southern Hemisphere.
However, it is important to note that the Brandt Line is a simplified representation and does not capture the complexities of global economic disparities.
The world bank classification
Low income countries (LIC) - these are countries with a GNI per capita of $1,045 or less, eg Chad and Ethiopia
Medium income countries (MIC) - these are countries with a GNI per capita of more than $1,045 but less than $12,695, eg Mexico and Iraq
High income countries (HIC) - these are countries with a GNI per capita above US$ 12,696, eg Germany and the USA
Social and economic measures of development
The Human Development Index (HDI) is a measure of a country's overall development based on three dimensions: life expectancy, education, and income.
It is calculated by the United Nations Development Programme (UNDP) and ranges from 0 to 1, with 1 indicating the highest level of development. The HDI provides a comprehensive view of a country's well-being beyond just economic indicators.
HDI is the best measure of development as it takes into account both economic and social factors. However there are many other measures of development that can be used. Some of them are: Access to safe water, birth rate, death rate, GDP, Life expectancy etc.
The Demographic Transition Model
Stages
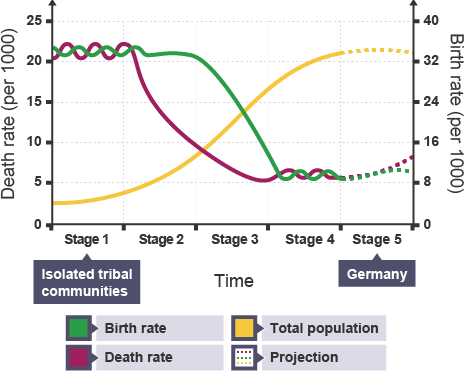
The demographic transition model is a theory that explains the changes in population growth rates and patterns as societies undergo economic and social development. It consists of four stages:
Stage 1: Pre-industrial society with high birth rates and high death rates, resulting in slow population growth.
Stage 2: Early industrialization with declining death rates due to improvements in healthcare and sanitation, leading to rapid population growth.
Stage 3: Mature industrialization with declining birth rates as a result of increased access to contraception, urbanisation, and improved education and opportunities for women.
Stage 4: Post-industrial society with low birth rates and low death rates, resulting in a stable or slowly growing population.
Explanation
The demographic transition model is closely linked to development. As countries progress through the stages, they experience improvements in healthcare, education, and living standards, leading to longer life expectancy and lower infant mortality rates.
This, in turn, affects population growth rates. Additionally, as societies develop, there is often a shift from agrarian economies to industrialization and urbanisation, which can further impact population dynamics.
Overall, the demographic transition model provides a framework for understanding the relationship between development and population trends, highlighting the importance of social and economic factors in shaping population growth patterns.
Factors affecting global development
Physical Factors- some areas have a hostile or difficult landscape. This can make development more difficult. Examples of this are very hot climates or arid climates (with a lack of water) which make it difficult to grow sufficient food.
Economic factors – some countries have very high levels of debt. This means that they have to pay a lot of money in interest and repayments and there is very little left over for development projects.
Environmental factors – some places experience environmental issues, which can prevent them from developing. Examples might be extreme flooding or desertification.
Historical factors – Over the course of history, some countries took over, or colonised, others. Colonial powers used the resources of their colonies to grow their own economies.
Political factors – some countries are at war or the government may be corrupt. Therefore money does not reach the people who need it most and spending on areas such as education and infrastructure may be insufficient.
Natural resources – some countries have an abundance of raw materials such as oil or precious minerals. This can be good if they are sold and the money invested into developing the country. However, it can also be a bad thing if the resources are used by groups that do not work for the good of the country.
Consequences of uneven development
Health: Levels of health vary between different countries and within countries. Many people in lower income countries (LICs) cannot access safe, clean water and sanitation. This can lead to higher incidences of disease and lower life expectancies.
Wealth: There are large variations in wealth between countries and within countries. It's estimated that the richest 10% of the world's population receives 52% of global income. Meanwhile, the poorest 50% receives just 8% of global income.
Migration: Uneven development can lead to higher rates of migration. People migrate for many different reasons, usually as a result of push and pull factors. Some people move to find better employment opportunities, others flee dangerous situations.
The cycle of poverty
The cycle of poverty refers to the phenomenon where individuals or families remain trapped in poverty across generations.
It is characterised by a lack of access to education, limited job opportunities, low income, inadequate healthcare, and limited social mobility.
This cycle can be perpetuated by various factors such as systemic inequalities, discrimination, limited resources, and lack of social support.
Breaking the cycle of poverty often requires comprehensive interventions addressing education, employment, healthcare, and social welfare programs.
The Challenge Of Resource Management
Distribution of resources
Resources
Food
Eating too few calories causes weight loss and can lead to a lack of energy. People who do not have enough food to eat may find it difficult to work.
If there are too many people in a country who are unable to work, this can negatively impact the wealth of the country.
Consuming too many calories can cause weight gain which can also make it difficult to work.
Water
Each person should drink between 1.6 and 2 litres of water a day. The actual amount of water needed depends on factors such as the air temperature and the type of activity that a person undertakes each day.
Water is also used to keep ourselves clean and healthy, and is also needed to grow food and for industry.
In drier countries or drier seasons, irrigation enables crops to grow. Industry uses water in many ways, such as cleaning, cooling and as a raw material in production.
Energy
Energy has many uses. It heats homes and offices, cooks our food and powers transport.
Much of the energy that is used is in the form of electricity. This is called secondary energy - primary energy sources, such as fossil fuels or the wind, have been used to generate it.
Energy affects both food supplies and industry. Mining and growing biofuels required to generate energy takes up valuable farmland, which reduces the amount of food available to eat.
And if energy is more expensive or in short supply, then it costs more to produce and transport food. This is passed on to consumers through an increase in the price of food.
Inequalities in supply and consumption of resources
There are inequalities in the global distribution of resources. The balance between the supply and demand for resources affects a country's wealth and security.
Water surplus and water deficit
Areas of water surplus have more water than they need. Excess water flows along rivers and out into the sea, but can become a problem if it floods the land.
Areas of water deficit have too little water.
Causes: The amount of water available in an area is dependent on factors such as rainfall, temperature and population.
Higher rainfall can lead to flooding.
Higher temperatures cause evaporation which means less water availability
Higher populations use more water. This means there is less available to share around.
Energy security and energy insecurity
Energy Security refers to the availability, accessibility, affordability, and reliability of energy sources to meet the needs of a population or country.
Effects: Economic development, national security, and positive social well-being.Energy Insecurity refers to the lack of access to reliable and affordable energy sources, which can lead to negative impacts on individuals, communities, and economies.
Causes: inadequate infrastructure, limited energy resources, political instability, and economic constraints.
Effects: energy poverty, which affects access to basic services such as heating, cooling, lighting, and cooking. Energy insecurity can also result in health issues, as reliance on inefficient and polluting energy sources can lead to indoor air pollution and respiratory diseases.Climate change and environmental concerns further highlight the importance of transitioning to sustainable and renewable energy sources to enhance energy security and reduce energy insecurity.
International cooperation and diversification of energy sources are key strategies to improve energy security and reduce energy insecurity.
Food security- a global concern
Global supply of food and calorie intake
Food energy intake is measured in calories (kcal). Some foods, e.g. rice, contain fewer calories than others, e.g. meat.
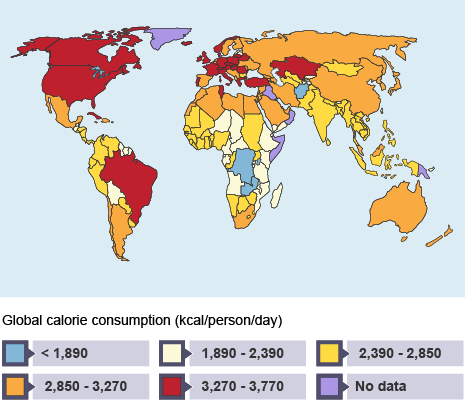
The map of global calorie consumption shows that sub-Saharan African nations consume fewer calories than other countries. The staple foods for many of these countries are corn, wheat and rice.
European and North American countries consume more calories than other nations. Many of these countries eat more animal products, such as meat, milk and eggs.
Reasons for increasing food consumption
There are two main reasons for increasing food consumption:
Economic development: As countries become wealthier, people can afford to eat more food. People in Chad and Somalia eat less than 2,850 calories a day, whereas those in the USA and Italy consume more than 3,440 calories a day. Many HICs have high levels of food wastage because people buy more food than they need. Fast food and food advertising also increase food consumption in wealthier places.
Rising population: World population continues to grow and is likely to exceed 8.5 billion people by 2030. This means there are more mouths to feed. The most rapid growth is taking place in LICs and some newly emerging economies (NEEs), like China and India.
Measuring hunger
The Global Hunger Index (GHI) is calculated by the International Food Policy Research Institute (IFPRI). It measures world hunger.
Each country is given a score between 0, which is no hunger, to 100, which is when everyone is hungry.
Three things are used to calculate this score
Undernourishment - the percentage of people consuming too few calories
Number of children underweight - the number of children below the age of five who are underweight
Child mortality - the death rate of children below the age of five
Factors affecting food supply
Climate: global warming is increasing temperatures by around 0.2°C every 10 years. Rainfall is increasing in some places, but decreasing in others. Higher temperatures and unreliable rainfall make farming difficult, especially for those farming marginal lands.
Technology: Improvements in technology have increased the amount of food available. Technology can overcome temperature, water and nutrient deficiencies in the form of greenhouses, irrigation and fertilisers.
Pests and disease: Pesticides have increased crop yields. Farmers in wealthier countries can afford pesticides, whereas most farmers in poorer countries cannot afford them.
Water stress: Irrigation systems provide water for countries with unreliable or low rainfall. Irrigation can double crop yields but it is expensive to put these systems in place. Water can be taken either from underground aquifers or directly from rivers. Both have environmental consequences.
Conflict: War forces farmers to flee their land or to fight in conflict. Food can be used as a weapon, with enemies cutting off food supplies in order to gain ground. Crops can also be destroyed during fighting. Food shortages have caused riots and conflict
Poverty: When people have less money, they cannot afford food and they become unable to work. Families in developing countries spend much of their income on food.
Strategies to increase food supply
Irrigation:
Irrigation can double the amount of food produced. Some parts of the world still do not have irrigation systems in place. Only 10% of the food produced in Africa comes from irrigated crops and so there is the potential to improve yields in these countries.
Green revolution:
The Green Revolution first began in the 1940s. It refers to the application of modern farming techniques in LICs, eg fertilisers and pesticides, irrigation and high-yield crop varieties
The New Green Revolution involves using different seeds to help specific areas that are experiencing the impact of global warming, such as drought and flooding.
There is also a focus on improving the nutritional value of crops, rather than just providing more calories. The New Green Revolution should help the poorest areas of the world.
Biotechnology and appropriate technology
Biotechnology is the selective breeding or genetic modification (GM) of plants and animals to produce specific traits.
Both involve mixing two species, both of which have beneficial characteristics. Selective breeding has been used on dairy cows to increase milk yields.
GM has been used on wheat to produce crops that are disease resistant.
Increasing food sustainability
Organic Farming:
Organic farming uses natural methods to grow foods. This means using organic fertilisers and pesticides, such as animal slurry and natural predators and no artificial fertilisers or pesticides.
Yields from organic crops are usually lower than those from inorganic crops but the difference varies between types of crop and over time.
Organic farming is considered to be environmentally sustainable as it aims to minimise damage to ecosystems.
Sustainable fish and meat:
Modern fishing techniques use large nets which often wipes out whole fish populations. When a fish is captured unintentionally. It is called a bycatch.
Sustainable fishing involves catching fewer fish. Better net designs and a return to traditional fishing methods are examples of sustainable fishing.
Meat production is resource-heavy. 6.5 kg of grain and over 13,000 litres of water are needed to rear every kilogram of beef.
Feeding grain to cattle reduces the time it takes them to grow, but means there is less grain for people to eat. Sustainable meat production involves using grass as animal feed.
Seasonal food consumption
In the past, people ate food that was in season, eg cabbages during the winter and salad crops during the summer.
Food is now available out of season because of heated greenhouses to produce it in the UK and cold storage to transport it to the UK. Seasonal food consumption reduces food miles and electricity use.
Reduction of food waste
Developed nations waste a lot of food. Buying only the food that is needed is more sustainable as there is more food left to feed others.