Populations
Objectives of Population Study
By the end of this lecture, you should be able to understand the following:
The definition of a ‘population’
The concepts of ‘life tables’, ‘age pyramids’, and their applications
‘Survivorship curves’
Mechanisms of population growth, with practical examples
Key concepts like ‘carrying capacity’, ‘time lags’, and reasons for ‘population oscillations’
‘r and K selection’ population strategies
Case study on Arctic reindeer populations
Population Concepts
Definition of a Population
A group of organisms of the same species occupying a particular space at a particular time. This concept can be applied to various species, including bryophytes and lichens in diverse environments.
Life Tables and Age Pyramids
Static Life Tables
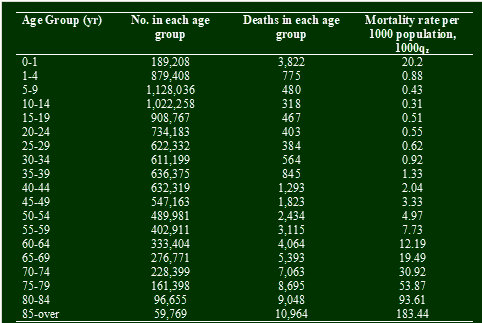
Static life tables provide insights into the age structure and mortality rate of a population
Infant mortality has decreased with the developments of medicine
Mortality rate increases with age typically
Age Pyramids
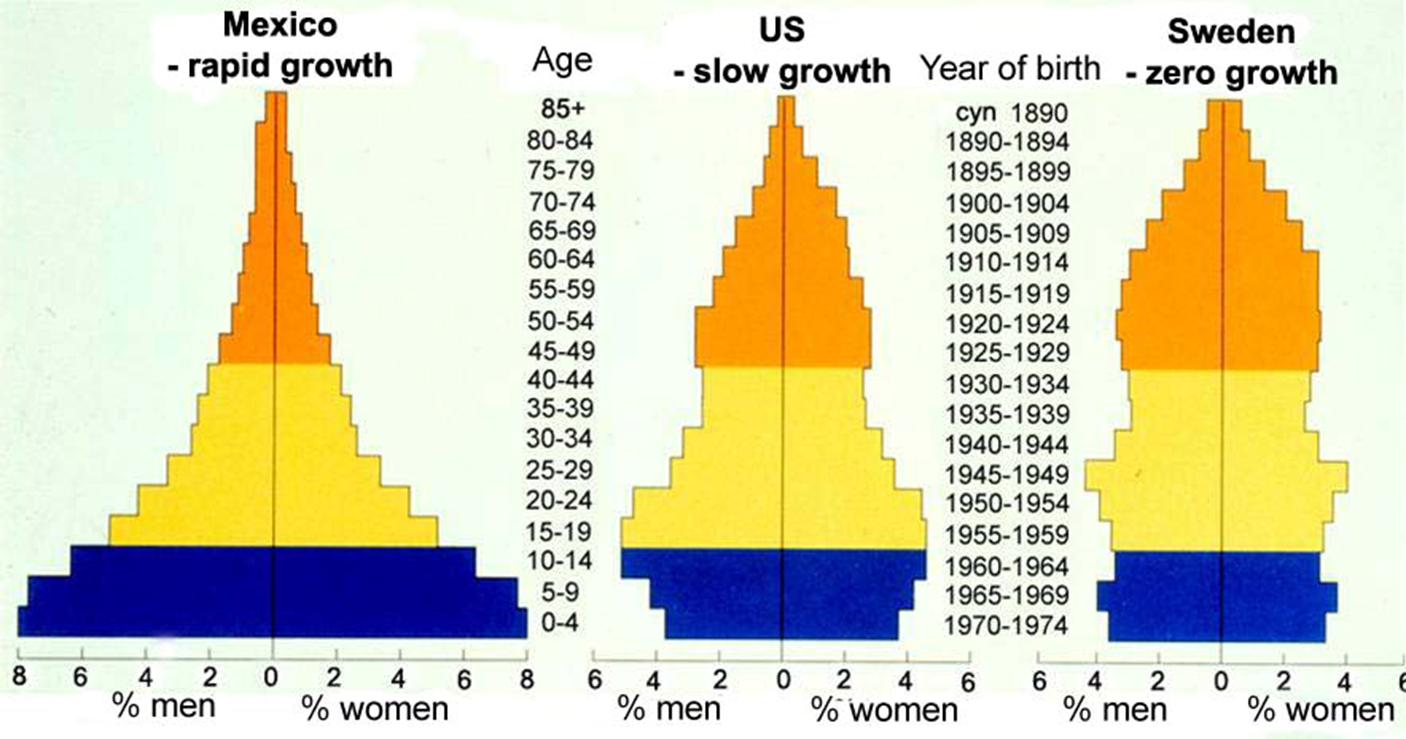
Age pyramids are graphical representations that depict different age groups within a population:
Bottom portion: Pre-reproductive years (0-14)
Middle portion: Reproductive years (15-44)
Top portion: Post-reproductive years (45-85+)
Survivorship Curves
Types of Survivorship Curves
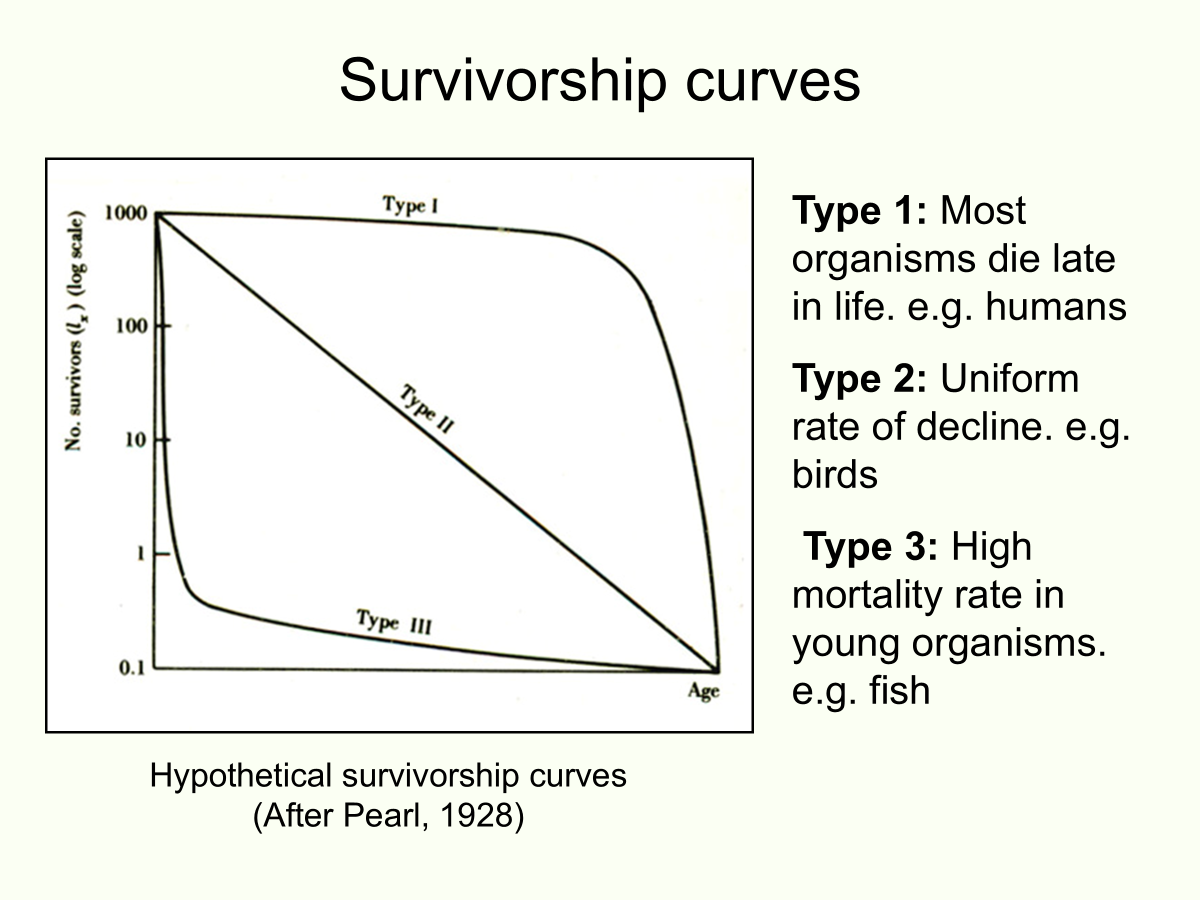
Survivorship curves demonstrate the mortality rates based on age and life history strategies
Population Growth Models
Exponential vs Logistic Growth
Populations can grow in two distinct ways:
Exponential Growth: Occurs in favorable conditions without resource limitations.
Logistic Growth: Growth that stabilizes as the population reaches the environment’s carrying capacity.
Carrying Capacity
Defined as the maximum population of a given organism that a particular environment can sustain.
Population Dynamics
Population Oscillations
Populations may experience fluctuations due to overshoot and dieback, reflecting the balance between environmental capacity and population size over time.
Eventually the population will crash
r and K Selection Theory
r-selected Species
Characteristics:
High variability and density independence
Unstable populations that do not stabilize and often ignore carrying capacity
Exhibits a Type III survivorship curve
E.g. Insects
K-selected Species
Characteristics:
More predictable with density dependence
Stabilized populations that remain near carrying capacity
Exhibits Type I and II survivorship curves
E.g. Large mammals and fish
Case Study: Arctic Reindeer Populations
Reindeer serve as a practical example of population growth dynamics.
Introduced to the two different Islands in Alaska in 1911
The population growth trends are documented over several decades showing significant increases in numbers.
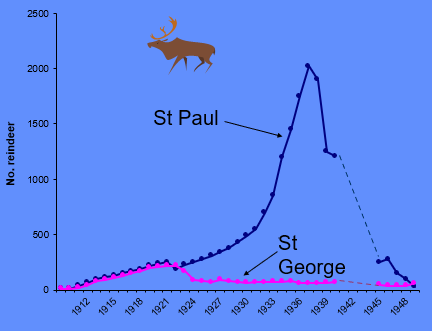
Graph shows an exponential dynamic and one logistic population due to difference in location
Summary of Key Points
Populations exist in varying environments, including extreme conditions.
Life tables and age pyramids are essential for understanding age distributions and predicting future trends.
Three types of survivorship curves correspond to different life strategies in various species.
Population growth can be exponential or logistic depending on environmental factors.
Carrying capacity reflects the sustainable limits of a population in its environment.
Species can be classified as ‘r’ or ‘K’ selected based on their reproductive strategies.
Monitoring population dynamics over time, exemplified by reindeer in the Arctic, can provide valuable insights.