AP Environmental Science
UNIT 1
Topic 1.1 Ecosystems
Ecosystem Basics
Community: all living organisms in an area
Ecosystem: all living & nonliving things in an area (plants, animals, rocks, soil, water
Biome: the plants and animals found in a given region (determined by climate
Organism Interactions
Competition: organisms fighting over a resource like food or shelter; limits population size
Predation: one organism using another for energy source (hunters, parasites)
Mutualism: relationship that benefits both organisms (coral reef)
Commensalism: relationship that benefits one organism & doesn’t impact the other (birds nests in trees)
Predation (+/-)
Herbivores: (plant eaters) eat plants for energy (giraffe & tree)
True predators: (carnivores) kill and eat prey for energy (leopard & giraffe)
Parasites: use a host organism for energy, often without killing the host & often living inside host
Parasitoids: lay eggs inside a host organism; eggs hatch & larvae eat host for energy
Symbiosis
Sym = together
Bio = living
osis = condition
Any close and long-term interaction between two organisms of different species
Mutualism (+/+), commensalism (+/O), and parsitism (+/-) are all symbiotic relationships
Mutualism: Organisms of different species living close together in a way that benefits both
Competition
Reduces population size since there are fewer resources available & fewer organisms can survive
Resource Partitioning: different species using the same resource in different ways to reduce competition
Temporal Partitioning: using resource at different times, such as woles & coyotes hunting at differnt times (night vs. day)
Spatial Partioning: using different areas of shared habitat
Morphological Partioning: using different resources based on different body features
Topic 1.2 Terrestrial (Land) Biomes
Biome: the plants & animals found in a region; based on yearly temperature + precipitation (climate)
The community of organisms (plants & animals) in a biome are uniquely adapted to live in that biome.
Biome Characteristics
Latitude (distance from equator) determines temperature & precipitation which is why biomes exist in predictable pattern on earth
Biome chart can also predict where on earth biomes are found
Tundra & Boreal = higher latitude (60 degrees +)
Temperate = mid latitude (30 degrees - 60 degrees)
Tropical = closer to the equator
Nutrient Availability
Tropical Rainforest = nutrient-poor soil
(High temperature & rainfall → rapid decomposition of organic matter; acidic soil + high rainfall → nutrient leaching)
Boreal Forest = nutrient-poor soil (low temperature & low decomposition rate of dead organic matter)
Temperate Forest = nutrient-rich soil (lots of dead organic matter - leaves & warm temperature/moisture for decomposition)
Plants need soil nutrients to grow, so availability determines which plants can survive in a biome
Shifting Biomes
Biomes shift in location on earth as climate changes
Topic 1.3 (Aquatic Biomes)
Characteristics of Aquatic Biomes
Salinity: how much salt there is in a body of water, determines which species can survive & usability for drinking (Fresh water vs. estuary vs. ocean)
Depth: influences how much sunlight can penetrate and reach plants below the surface for photosynthesis
Flow: Determines which plants & organisms cna survive, how much O2 can dissolve into water
Temperature: Warmer water holds less dissolved O2 so it can support fewer aquatic organisms
Freshwater: River & Lakes
Rivers hae high O2 due to flow mixing water & air, also carry nutrient-rich sediments (deltas & flood plains = fertile soil)
Lakes = standing bodies of fresh H2O (key drinking water source)
Littoral: shallow watter with emergent plants
Limnetic: where light can reach (photosynthesis)
No rooted plants, only phytoplankton
Profundal: too deep for sunlight (no photosynthesis)
Benthic: murky bottom where inverts (bugs) lie, nutrient-rich sediments
Freshwater: Wetlands
Wetland: area with soil submerged/saturated in water for at least part of the year, but shallow enough for emergent plants
Plants living here have to be adapted to living with roots submerged in standing water (cattails, lily pads, reeds)
Benefits of Wetlands
Stores excess water during storms, lessening flood damage to property
Recharges groundwater by absorbing rainfall into soil
Roots of wetland plants filter pollutants from water draining through
High plant growth rates due to lots of water & nutrients (dead organic matter) in sediments
Estuaries
Areas where rivers empty into the ocean
Mix of fresh & salt water (species adapt to this)
High productivity (plant growth) due to nutrients in sediments deposited in estuaries by river
Salt Marsh
Estuary habitat along coast in temperate climates
Breeding ground for many fish & shellfish species
Mangrove Swamps
Estuary habitat along coast of tropical climates
Mangrove trees with long, stilt roots stabilize shoreline & provide habitat for many species of fish & shellfish
Coral Reef
Warm shallow waters beyond the shoreline; most diverse marine (ocean) biome on earth
Mutualistic relationship between coral (animals) & algae (plants)
Coral take CO2 out of ocean to create calcium carbonate exoskeleton (the reef) & also provide CO2 to the algae
Algae live in the reef & provide sugar (energy) to the coral through photosynthesis
Both species rely on the other:'
Coral couldn’t survive without energy from algae
ALgae need the home of the reef & CO2 from the coral
Intertidal Zones
Narrow band of coastline between high & low tide
Organisms must be adpted to survive crashing waes & direct sunlight/heat during low tide
Shells & tough outer skin can prevent drying out (desiccation) during low tides
Different organisms are adapted to live in different Zones
Opean Ocean
So large that algae & phytoplankton of ocean produce a lot of earth’s O2 & absorb a lot of atmospheric CO2
Low productivity per m² as algae & phytoplankton can only survive in photic zone
Photic Zone = area where sunlight can reach (photosynthesis)
Aphotic Zone (abyssal) = area too deep for sunlight
Species rely on detritus from photic zone or chemosynthesis microbes at hydrothermal vents for energy
Topic 1.4 (Carbon Cycle)
Carbon Cycle Overview
Movement of molecules that contrain Carbon (CO2, glucose, CH4) between sources and sinks
Some steps are very quick (fossil fuel combustion), some are very slow (sedimentation & burial)
Leads to imbalance in which reservoirs or sinks are sotring carbon
Atmosphere is key Carbon reservoir: increasing levels of Carbon in atmosphere leads to global warming
Carbon Sink: reservoir that lake in more carbon that it releases
Ocean (algae & sediments), plants, soil
Carbon Source: reservoir that releases more carbon that it takes in
Fossil fuel (oil, coal, natural gas) combustion
Animal agriculture (cow burps & farts + CH4)
Deforestation, releases CO2 from trees
Photosynthesis & Cellular Respiation
Photosynthesis
Plants, algae, phytoplankton
Removes CO2 from the atmosphere & converts it to glucose
Glucose = biological form of Carbon & stored (chemical) energy in form of sugar
CO2 sink
Cellular Respiration
Done by plants & animals to release stored energy
Uses O2 to break glucose down & release energy
Releases CO2 into atmosphere
CO2 source (adds CO2 to atmosphere)
Both processes are very quick
Cycle Carbon between biosphere & atmosphere in balanced amount (no net Carbon increase in atmosphere)
Ocean & Atmosphere
Direct Exchange: CO2 moves directly between atmosphere & the ocean by dissolving into * out of ocean water at the surface
Happens very quicjly & in equal directions, balancing levels of CO2 between atmosphere & ocean
Because of direct exchange, increasing atmosphere CO2 also increases CO2, leading ocean acidification
Algae & phytoplankton take CO2 out of the ocean & atmosphere through photosynthesis
Coral, mollusks and some zooplankton also take CO2 out of the ocean to make calcium carbonate exoskeletons
Sedimentation: calcium carbonate precipitates out as sediments & settles on ocean floor
Burial: over long periods of time, pressure of water compresses Carbon-containing sediments on ocean floor into sedimentary rock (limenstone, sandstone) - long-term Carbon reservoir
Burial, Extraction, & Combustion
Burial: slow, geological process that stores Carbon in underground sinks like sedimentary rock or fossil fuels
Sediments (bits of rock, soil, organic matter) compacted into sedimentary rock by weight of overlying rock layers of water.
Fossil Fuels (FF): formed from fossilized remains of orgaic matter into coal (ex. plants) or oil (ex. plankton). Their decomposition produces natural gas (CH4)
Extraction & Combustion: digging up or mining Fossil Fuels & burning them as energy source; releases CO2 into atmosphere.
Burial (formation of Fossil Fuels) lakes for longer than extraction & combustion, which means they increase concentration of CO2 in atmosphere
Topic 1.5 (Nitrogen Cycle)
Nitrogen Cycle Overview
Movement of Nitrogen-containing molecules between sources & sinks/reservoirs
Sources release Nitrogen into atmosphere; sinks take Nitrogen out of the atmosphere in increasing amounts
Nitrogen reservoirs hold Nitrogen for relatively short periods of time compared to Carbon cycle
Ex: plants, soil, atmosphere
Atmosphere =main Nitrogen reservoir
Nitrogen in atmosphere exists mostly as N2 gas, which is not useable by plants or animals
Nitrogen = critical plant & animal nutrient
All living things need Nitrogen for DNA & amino acids to make proteins
Nitrogen Fixation
Process of N2 gas being converted into biologically available (useable by plants) NH3 (ammonia) or NO3- (nitrate)
Biotic Fixation: certain bacteria that live in the soil, or in the symbiotic relationship with plant root nodules convert N2 into ammonia (NH3)
Rhizobacteria live in root nodules of legumes (peas, beans) & fix Nitrogen for them in return for amino acids from the plant (mutualism)
Abiotic Fixation: Lightning converts N2 gas into nitrate (NO3-) and Foosil Fuel combustion converts N2 gas into ammonia (NH3)
NH3 is added to synthetic fertilizer and applied to agricultural soils (where its converted into nitrate)
Other Nitrogen Cycle Steps
Assimilation: plants & animals taking Nitrogen and incorporating into their biomas
Plant roots take in NO3- or NH3 from soil; animals assimilate Nitrogen by eating plants or other animals
Ammonification: soil bacteria, microbes & decomposers converting waste & dead biomass back into NH3 and returning it to soil
Nitrification: conversion of NH4 into nitrite (NO2-) & then nitrate (NO3-) by soil bacteria
Denitrification: conversion of soil Nitrogen (NO3) into nitrous oxide (N2O) gas which returns to atmosphere
Human Impacts on Nitrogen Cycle
Climate: N2O (nitrous oxide) = greenhouse gas which warm earth’s climate
Produced by denitrification of nitrate in agricultural soils (especially when waterlogged/over watered)
Leaching & Eutrophication: synthetic fertilizer use leads to nitrates (NO3) leaching, or being carried out of soil by water
Nitrates runoff into local waters, causing algae blooms that block sun & kill other aquatic plants
1.6 (Phosphorus Cycle)
Phosphorus Cycle Basics
Movement of Phosphorus atoms & molecules between sources & sinks/reservoirs
Rocks & sediments containg Phosphorus minerals = major reservoirs
Phosphorus cycle is very slow compared to Carbon/H2O/Nitrogen cycles
Takes a long time for Phosphorus minerals to be weathered out of rocks & carried into soil/bodies of water
No gas phase of Phosphorus (doesn’t enter atmosphere)
Because it cycles so slowly, it is a limiting nutrient, meaning plant growth in ecosystems is often limited by Phosphorus availability in soil/water
Phosphorus is needed by all organisms for DNA, ATP (energy), bone & tooth enamel in some animals
Phosphorus Sources
Major natural source of Phosphorus is weathering of rocks that contain Phosphorus minerals
Wind & rain break down rock & phosphate (PO4-3) is released and dissolved into water; rain water carries phosphate into nearby soils & bodies of water
Weathering is so slow that Phosphorus is often a limiting nutrient in aquatic & terresterial ecosystems
Synthetic (human) sources of Phosphorus = mining phosphate minerals & adding products like synthetic fertilizers & detergents/cleaners
Synthetic fertilizers containing phosphates are added to lawns or agricultural Fields; runoff carries Phosporus into nearby bodies of water
Phosphates from dtergents & cleaners enter bodies of water via wasterwater from homes
Assimilation & Excretion/Decomposition
Just like Nitrogen, Phosphorus is absorbed by plant roots & assimilates into tissues; animals assimilate Phosphorus by eating plants or other animals
Animal waste, plant matter & other biomass is broken down by bacteria/soil decomposers that return phosphate to soil
Assimilation & excretion/decomposition from a mini-loop within Phosphorus cycle just like assimilation & ammonification of Nitrogen cycle, photosynthesis & respirationin Carbon cycle.
Sedimentation & Geologic Uplift
Phosphate dosen’t dissolve very well into water; much of it forms solid bits of phosphate that fall to the bottom as sediment (sedimentation)
Phosphorus sediments can be compressed into sedimentary rock over long time periods by weight of overlying water
Geological Uplift = tectonic plate collision forcing up rock layers that form mountains; Phosphorus cycle can start over again with weathering & release of phosphate from rock
Eutrophication (too much Nitrogen & Phosphorus)
Can occur from fertilizer runoff, human/animal waste contamination
Because they’re limiting nutrients in aquatic ecosystems, extra input of Nitrogen & Phosphorus leads to eutrophication (excess nutriens) which fuels algae growth
Algae bloom coers surface of water, blocking sunlight & killing plants below surface
Algae eventually die-off; bacteria that break down dead algae use up O2 in the water (because decomposition = aerobic process)
Lower O2 levels (dissolved oxygen) in water kills aquatic animals, especially fish
Bacteria use up even more O2 to decompose dead aquatic animals
Creates positive feedback loop: less O2 → more dead organisms → more bacterial decomposition → less O2
Topic 1.7 (Hydrologic Cycle)
Water Cycle Overview
Movement of H2O (in different states) between sources & sinks
State of matter (solid/liquid/gas) as well as where water is moving are key in H2O cycle
Example: Precipitation = atmosphere (gas) → land or surface water (liquid)
Energy from sun drives the H2O cycle
Example: heat from sun causes liquid water in ocean to become a gas (evaporation) in atmosphere
Ocean = largest water reservoir
Ice caps & groundwater are smaller reservoirs, but contain fresh, useable water for humans
Evaportation & Evapotranspiration
2 main sources of water (processes that cycle it from liquid on earth back into the atmosphere)
Sometimes called “vaportization” since liquid water becomes water vapor (gas) in atmosphere
Transpiration: process plants use to draw groundwater from roots up to their leaves
Leaf opening called stomata open, allowing water to evaporation into atmosphere from leaf
Movement of H2O out of leaf creates low H2O potential in leaf, pulling H2O up from roots
Evapotranspiration: amount of H2O that enters atmosphere from transpiration & evaporation combined
Both processes are driven by energy from the sun
Runoff & Infiltration
Precipitation (rain) either flows over earth’s surface into a body of water (runoff) or trickles through soil down into groundwater aquifers (infiltration)
Groundwater (aquifers) & surface waters (lakes/rivers) are important freshwater reservoirs for humans & animals
Precipitation recharges groundwater through infiltration, but only if ground is permeable (able to let water pass through)
Runoff recharges surface waters, but can also carry pollutants into water sources
Topic 1.8 (Primary Productivity)
PP Basics
units: kcal/m²/yr
kcal = energy
m² = area
yr = time
High PP = high plant growth = lots of food & shelter for animals
Ecosystems with high PP are usually more biodiverse (more diversity of species) than ecosystems with low PP
Primary Productivity: rate that solar energy is converted into organic compounds via photosynthesis over a unit of time
AKA: rate of photosynthesis of all producers in an area over a given period of time
Since photosynthesis leads to growth, you can also think of PP as the amount of plant growth in an area over a given period of time
Calculating PP
NPP = GPP - RL
Net Primary Productivity (NPP): The amount of energy (biomass) leftover for consumers after plants have used some for respiration
Think of NPP as the actual amount of the plant’s paycheck it keeps after taxes
Respiration Loss (RL): plants use up some of the energy they generate via photosynthesis by doing cellular respiration (movement, internal transportation, etc.)
Think of RL as taxes plant needs to pay
Gross Primary Productivity (GPP): The total amount of sun energy (light) that plants capture and convert to energy (glucose) through photosynthesis
Think of GPP as the total paycheck amount the plant earns
Ecological Efficiency
The portion of incoming solar energy that is captured by plants & converted into biomas (NPP or food available for consumers)
Generally, only 1% of all incoming sunlight is captured & converted into GPP via photosynthesis
(~99% of solar energy comes in waelengths plants can’t use for photosynthesis & is reflected by or passes through them)
Of that 1%, an average 40% (or 0.4% of total incoming solar energy) is converted into biomass/plant growth (NPP)
Some ecosystems are more efficient (higher NPP) than others
Trends in Productivity
The more productive a biome is, the wider the diversity of animal life it can support (higher biodiversity)
Water availability, higher temperature, and nutrient availability are all factors that lead to high NPP
Shortage of any of these three factors will lead to decreased NPP
Topic 1.9 (Trophic Levels)
Conservation of Matter & Energy
Matter & Energy are never created or destroyed: they only change forms
Example: Tree dies & the Carbon/Nitrogen/H2O/Phosphorus are returned to the soil & atmosphere
1st Law of Thermodynamics: Energy is never created or destroyed
Biogeochemical cycles demonstrate conservation of matter (Carbon/Nitrogen/H2O/Phosphorus)
Food Webs demonstrate conservation of energy
Example: When a rabbit earts a leaf, the energy from the leaf (glucose) is transfered to the rabbit & stored as body tissue like fat/muscle
2nd Law of Thermodynamics
Each time energy is transferred some of it is lost as heat
Applied to food webs: the amount of useable energy decreases as you move up the food chain (organisms use up most of it for movement, development, etc.)
Because available energy decreases with each step up the food chain, a trophic pyramid (troph = nourishment or growth) is used to model how energy moves through an ecosystem
Topic 1.10 (The 10% Rule)
10% Rule: In trophic pyramids, only about 10% of the energy from one leel makes it to the next level; the other 90% is used by the organisms & lost as heat
Trophic Levels & 10% Biomass
Tertiary Consumers: animals that eat secondary consumers or carnivores & omnivores (aka - top/apex predators)
Secondary Consumers: animals that eat primary consumers or herbivores (aka - carnivores & omnivores)
Primary Consumers: animals that eat plants (herbivores)
Producers: (plants) “produce” - really convert sun’s light energy into chemical energy (glucose)
10% rule also spplies to biomass (or mass of all liing things at each trophic level)
Since energy is needed for growth & only 10% of energy transfers from one level to the next, only 10% of the biomass of the previous trophic level can be grown/supported by the available energy
Topic 1.11 (Food Chains & Food Webs)
Food Web Basics
Shows how matter & energy flow trhough an ecosystem, from organism to organism
When one organism preys on (eats) another, the matter (Carbon/Hydrogen/H2O/Phosphorus) and energy (glucose, muscle tissue, etc.) are passed on to the predator
Arrows in the food webs indicate direction of energy flow (point to the organism taking the in the energy)
Food Web vs. Chain
Food chains just show one, linear path of energy & matter
Food webs have at least 2 different, interconnected food chains
Webs show that organisms can exist at different trophic levels
Grass → hare → owl (secondary consumer)
Grass → grasshoper → robin → owl (tertiary consumer)
Interactions & Trophic Cascade
Food webs show how increase or descreases in population size of a given species impact the rest of the food web
Example: Increase in python population
Decrease in frog & rat population
Increase in grasshopper population
Decrease in corn
Trophic Cascade: removal or addition of a top predator has a ripple effect down through lower trophic levels
Example: decline in wolf population = increase in deer population which leads to overgrazing & decline in trees
UNIT 2
Topic 2.1 (Intro to Biodiversity)
Biodiversity Basics
Diversity of life forms in an ecosystem; measured on 3 different levels:
Ecosystem Diversity: the number of different habitats available in a given area
Species Diversity: the number of diferent species in an ecosystem and the balance or eveness of the population sizes of all species in the ecosystem
Genetic Diversity: how different the fenes are of individuals within a population (group of the same species)
Higher Biodiversity = higher ecosystem/population health
Species Richness & Evenness
Richness (S) i just the total number of different species found in na ecosystem
High richness is generally a good sign of ecosystem health (more species means more quality resources like H2O & soil)
Evenness is a measure of how all of the individual organisms in an ecosystem are balanced between the different species
Evenness indicates if there are one or two dominant species, or if population sizes are well balanced
Genetic Diversity is Beneficial
Genetic Diversity = measure of how different the genomes (set of genes) are of the individuals within a population of a given species
There is a genetic diversity in all populations because random mutations in copying of DNA & recombination of chromosomes in sex cells of parents leads to new gene combinations & new traits in offspring
The more genetic diversity in a population the better the population can respond to environmental stressors like drought, disease, or famine
More genetic diversity = high chance that some of the individuals in a population have traits that allow them to survive the environmental stressor
Bottleneck Event
Any environmental disturbance (natural disaster/human habitat destruction) that drastically reduces population size & kills organisms regardless of their genome
Survivng population is smaller and because individual died randomly, it doesn’t represent the genetic diversity of the original population
Bottleneck evens reduce genetic diversity
Because the population is smaller & less genetically diverse, it’s even more vulnerable to future environmental disturbances
Inbreeding Depression
Inbreeding is when organisms mate with closely related “family” members
Leads to higher chance of offspring having harmful genetic mutations because they’re geting similar genotypes from both parents
Smaller populations are more likely to experience inbreeding (difficult to find non-related mate)
Ecosystem Resilience
Resilience: the ability of an ecosystem to return to its orginal conditions after a major disturbance (wind storm, fire, flood, clear-cutting, etc.)
Higher species diversity = higher ecosystem resilience
High species diversity means more plant species to repopulate disturbed ground, anchor soil, and provide food & habitat for animal species
Topic 2.2 (Ecosystem Services)
Ecosystem Services = $$$
Goods and services provided by natural ecosystems that are beneficial to humans (often monteraily or life-sustaining)
Provisioning: goods taken directly from ecosystems or made from natural resources (wood, paper, food)
Regulating: natural ecosystems regulate and stabilize climate, air quality, water quality, soil, biodiversity
Supporting: natural ecosystem processes that sustain ecosystems & allow them to support life
Cultural: Money generate by recreation (parks, camping, tours) or scientific knowledge
Humans Disrupt Ecosystem Services
Human activities disrupt the ability of ecosystems to function, which decreases the value of ecosystem services they provide
This has ecological (natral) and economic (money-based) consequences
Examples:
Clearing land for agriculture/cities removes trees that store CO2 (more CO2 in atmosphere = increased atmospheric temperatre = more storm damage & crop failure)
Overfishing leads to fish population collaspe (lost fishing jobs and lower fish sales in the future)
Provisioning Services
Goods/products directly provided to humans for sale/use by ecosystems
Example: Fish, hunting animals, lumber (wood for furniture/buildings), naturally grown foods like berries, seeds, wild grains, honey
Goods/products that are made from natural resources that ecosystems provide
Example: paper, medicine, rubber
Disrupted by overharvesting, water pollution, clearing land for agriculture/urbanization
Regulating Services
Benefit provided by ecosystem processes that moderate natural conditions like climate, air quality, biodiversity, soil quality
Examples:
Filtration & purification of water by wetlands
Pollination (aids plnat reproduction, food production, biodiversity)
Trees sequester CO2 via photosynthesis, lessening atmospheric warming & costly impacts like storm damage/crop loss
Trees filter air by absorbing air pollutants which reduces health care costs for treating diseases like asthma and bronchitis
Disrupted by deforestation, pollinator habitat loss, filling in wetlands
Supporting Services
Natural processes that sustain ecosystems, allowing them to support life and all of the other ecosystem services
Examples:
Photosynthesis, soil creation, nutrient cycling, habitat & food creation for plants and animals (all of these processes support ecosystem function, allowing them to support life)
Essentially, everything needed to maintain functioning ecosystems, supporting all of the other ecosystem services
Habitat loss due to deforestation, agriculture, urbanization
A Note On Supporting vs. Regulating Services
There is some overlap in classification of regulating and supporting services, depending on the context of the process
AP Classroom and the UN Food and Agriculture Organization classify pollination as a regulating ecosystem service, because it assists plant reproduction, fruit production, fostering biodiversity. They both classify water purification/treatment as regulating, since ecosystems like wetlands regulate water quality by removing pollutants
Friedland 4th edition classifies pollination as supporting since it aids human agriculture and makes it more productive. It also classifies water filtration by ecosystems as supporting, since they reduce the cost humans need to pay to purify water.
Cultural Services
Revenue from recreational activities (hunting/fishing licesnes, park fees, tourism-related spending) & profits from scieintific discoeries made in ecosystems (health/agriculture/educational knowledge)
Examples:
Beuatiful landscapes draw tourists who pay to enter parks, spend money at local stores/restaurants, or camping fees
Fishermen pay for fishing licenses to catch fish in clean rivers
Scientists learn about plant compounds that cna lead to creation of new medicines which are sold for profit
Dirupted by deforestation, pollution, urbanization
Topic 2.3 (Theory of Island Biogeography)
Island Bipgeography
Study of ecological relationships & community structure on islands
Islands can be actual islands in a body of water, or figuratie habitat islands such as Central Park in New York City or National Parks (natural habitats surrounded by human-developed land)
Two basic “rules” or observations of Island Biogeography:
Larger Islands support more total species
The larger the island, the greater the ecosystem diversity
Greater ecosystem diversity = more food & habitat resources
More niches, or “roles” organisms can play in the ecosystem
Islands closer to the “mainland” support more species
Easier for colonizing organisms to get to island from the mainland
More colonizing organisms = more genetic diversity in new population
Larger Islands Support More Species
Larger islands =
higher ecosystem diversity
More available “niches” or roles
Example: all the different food sources available to birds on Galapagos
Larger population sizes (more genetically diverse and more resistant to environmental disturbance)
Lower extinction rate (species less likely to die off)
Positive correlation between island size & species richness
Distance to Mainland
Closer to mainland = higher species richness
Easier for more species to migrate to island from mainland (swim/fly)
More continual migration of individuals to the island habitat
Frequent migration brings more genetic diversity & larger population size
Inverse relationship between island distance from mainland & species richness
The further away from mainland, the fewer species
Topic 2.4 (Ecological Tolerance)
Ecological Range of Tolerance
Range of conditions such as temperature, salinity, pH, or sunlight that an organism can ednure before injury or death results
Species and individual organisms both have a range of tolerance for all the different abiotic conditions of their habitat
Example: Salmon have a basic range of tolerance for temperature from 6 degrees to 22 degrees Celsius. But some individual salmon have adaptations that give them a range of tolerance that is outside the basic range for the species
Due to genetic biodiversity
Makes populations of salmon more resistant to disturbances, like global warming
Ecological Range of Tolerance - Zones
Optimal Range: range where organisms survive, grow, and reproduce
Zone of Physiological Stress: range where organisms survive, but experience some stress such as infertility, lack of growth, decreased activity, etc.
Zone of Intolerance: range where the organism will die
Example: thermal shock, suffocation, lack of food/water/oxygen
FRQ Writing Tips
On FRQs about human activities or natural events that cause environmental disturbance, connect answer to ecological range of tolerance
If possible, connect human activity to climate change
(electricity generation, transportation, agriculture) all release CO2 which causes climate change and global warming
Global warming shift temperature outside the range of tolerance for many tree species, causing their populations to decline
Global warming warms the ocean, shifting temperature outside range of tolerance for many fish species, causing die-offs
Try to connect a shift in range of tolerance to a specifc kind of physiological stress
Example: suffocation, thermal shock, lack of water/food/nutrients/oxygen
Global warming warms the ocean, shifting temperature outside range of tolerance for many fish species. Since global warming increases ocean temperature and warm water holds less oxygen, fish may suffocate due to lack of oxygen
Global warming can increase droughts. With increased droughts, rainfall patterns may shift outside the range of tolerance for many plant species. Without enough rainfall, these specise may suffer population decline as their roots are unable to absorb enough water from the soil.
Topic 2.5 (Natural Disruptions to Ecosystems)
Natural Disturbances
A natural event that disrupts the structure and or function of an ecosystem
Example: Tornadoes, hurricanes, asteroids, forest fires, drought
Natural disturbances can be even greater than human disruptions
Can occur on periodic, episodic, or random time frames
Periodic: occurs with regular frequency (example: dry-wet seasons)
Episodic: occasional events with irregular frequency (example: hurricanes, droughts, fires)
Random: no regular frequency (volcanoes, earthquakes, and asteroids)
Natural Climate Change
Earth’s climate hasvaried over geologic time for numerous reasons
Example: slight changes in earth’s orbit & tilt cause mini ice ages & warmer periods as earth shifts slightly closer to & further from sun
Sea level has varied over gelogical time as glacial ice on earth melts & forms
Environmental Change = Habitat Disruption
Major environmental disturbances result in widespread habitat changes and or loss
Example: rising sea level floods coastal & estuary habitats
Migration
Wildlife may migrate to a new habitat as the result of natural disruptions
Example: wildebeests migrating to follow rain patterns of African savanna
Ocean species moving further north as water temperature warms
Bird migration & breeding shifting earlier as insect hatching shifts earlier with warming climate
Topic 2.6 (Adaptations)
Fitness & Adaptation
All populations have some genetic diversity, or variability in genomes of individuals; Genetic diversity exists because:
Random mutations while DNA is being copied create new traits
Crossing over in parent chromosomes creates new combinations of genes (and therefore traits)
Adapation: a new trait that increases an organism’s fitness (ability to survive and reproduce)
Adaptation & Natural Selection
Natural Selection: organisms that are better adapted to their environment survive and reproduce more offspring
Individuals with adaptations pass them on to offspring & individuals without adaptations die off, which leads to the entire population having the adaptation over time (evolution)
Selective Pressure/Force: the environmental condition that kills individuals without the adaptation.
Environmental Change & Evolution
The environment an organism lives in determines which traits are adaptations
As environments change, different traits may become adaptations & old traits may become disadvantages
Example: a drought can kill off finches with smaller beaks, making larger beaks for cracking harder seeds an adaptation
Pace of Evolution
The more rapidly an environment changes, the less likely a species in the environment will be to adapt to those changes
If the pace of enevironment change is too rapid, many species may migrate out of the environment or die-off completely
Example: if the ocean warms too quickly (decreases dissolved O2), many species of fish may not be able to migrate quickly enough to colder waters
The more genetic diversity in a population, the better they’re able to adapt to environmental change (higher chance that some individuals have good mutations)
The longer the lifespan of the organism, the slower the rate of evolution
Example: bacteria & viruses can adapt and evolve in days
Humans evolution = thousand-million years
Topic 2.7 (Ecological Succession)
Ecological Succession
A series of predictable stages of growth that a forest goes through two types of succession
Primary Succession: starts from bare rock in an area with one previous soil formation
Moss & lichen spores carried by the wind grow directly on rocks, breaking them down to form soil
Secondary Succession: starts from already established soil in an area where a disturbance (fire/tornado/human land clearing) cleared out the majority of plant life
Grasses, sedges, wildflowers, and berry bushes have seeds disperesed by wind or animal droppings
Stages of Succession
Stages are characterized by which types of plant species dominate the ecosystem; different species are adapted to the conditions of the different stages
Pioneer or early succession species appear first, when the ground is simply bare rock, or bare soil after a disturbance
Characteristics: seeds spread by wind or animals, fast growing, tolerant of shallow soil and full sunlight
Example: moss, lichen (bare rock) | wildflowers, raspberries, grasses/sledges
Mid-successional species appear after pioneer species have helped develop deeper soil with more nutrients by their cycles of growth/death
Characterisitcs: relatively fast growing, larger plants that need deeper soils with more nutrients than pioneers, sun tolerant
Example: shrubs, bushes, fast-growing trees like aspen, cherry, and pine
Late successional or climax community species appear last, after soil is deepened and enriched with nutrients by cycles of growth and death by early & mid successional species
Characteristics: large, slow-growing trees that are tolerant of shade and require deep soils for alrge root networks
Example: maples, oaks, other large trees
Primary Succession
Occurs in an area that hasn’t previously been clonized by plants (bare rock)
Example: volcanic rock, rock exposed after glacial retreat
Moss and Lichen (spores dispersed by wind) are able to grow directly on rock by secreting acids that break down rock & release minerals containing nutrients they need (Nitrogen/Phosphorus/Potassium)
Chemical weathering of rocks by moss & lichen combined with organic matter from moss & lichen dying form initial shallow soil
Secondary Succession
Occurs in an area that already has established soil, but has had most plant life removed by a disturbance
Pioneer species are still wind-dispersed seeds of plants that are fast-growing and sun tolerant, but grasses/wildflowers/weeds instead of moss/lichen
Soil is already established & sometimes even enriched by nutrient-rich ash from fire; overall more rapid process than primary succession
UNIT 3
Topic 3.1 (Specialist vs. Generalist Species)
Specialists: smaller range of tolerance, or narrower ecological niche makes them more prone to extinction
Specific food requirements (bamboo)
Less ability to adapt to new conditions
Generalists: larger range of tolerance, broader niche makes them less prone to extinction & more likely to be invasive
Broad food requirements
High adaptability
Topic 3.2 (K-selected & r-selected species)
Quality vs. Quantity
K-slected = “quality”
Few offspring, heavy parental care to protect them
Generally have fewer reproductive events that r-strategists
Example: most mammals, birds
Long lifespan, long time to sexual maturity = low biotic potential = slow population growth rate
More likely to be disrupted by environmental change or invasive species
r-selected = “quantity"
Many offspring, little to no parental care
May reproduce only once, but generally reproduce many times throughot lifespan
Example: insects, fish, plants
Shorter lifespan, quick to sexual maturity = high biotic potential = high population growth rate
More likely to be invasive
Better suited for rapidly changing environmental conditions
Habitats/Populations
K-selected:
Usually live in habitats with higher competition for resources
Populations that reach carrying capacity (K) usually remain at stable size, near K
Hence, K-selected or K-strategist
r-selected:
Usually live in habitats with lower competition for resources
Population are more likely to fluctuate above and below carrying capacity (overshoot and die-off)
“r” is the variable used to represent maximum reproductive rate in ecology
Hence, r-selected or r-stategist
Invasiveness & Disturbances
K-selected:
Low biotic potential (reproduction rate) = hard for population to recover after a disturbance (environmental change)
High parental care means death of parent = death of offspring
Invasives (usually r) outcompete for resources with high biotic potential & rapid population growth
Less likely to adapt & more likely to go extinct
r-selected:
High biotic potential (reproduction rate) = more rapid population recovery after disturbance
Low parental care means death of parent doesn’t impact offspring
Not as impacted by invasive species since their population grows quickly
More likely to be the invasive
Larger population & faster generation time = higher chance of adaption & lower chance of extinction
Topic 3.3 (Survivorship Curves)
Survivorship Curve: line that shows survival rate of a cohort (group of same-aged indivduals) in a population from birth to death
Faster drop in line = quicker die-off of individuals
Slower drop in line = longer average lifespan
Type I, II, and III Survivorship
Type I (mostly K-selected)
High survivorship early in life due to high parental care
High survivorship in mid life due to large size & defensive behavior
Rapid decrease in survivorship in late life as old age sets in
Example: most mammals
Type II (in between r & K)
Steadily decreasing survivorship
Type III (mostly r-selected)
High mortality (low survivorship) early in life due to little to no parental care
Few make it to midlife; slow, steady decline in survivorship in mid life
Even fewer make it to adulthood; slow decline in survivorship in old age
Example: insects, fish, plants
Topic 3.4 (Carrying Capacity)
Carrying Capacity (K): the maximum Number of individuals in a population that an ecosystem can support (based on limiting resources)
Carrying Capacity (K)
Highest population size an ecosystem can support based on limiting resources:
Food
Water
Habitat (nesting sits, space)
Overshoot: when a population briefly exceeds carrying capacity
Example: deer breed in fall, give birth all at once in spring; sudden spike in population = overshoot
Consequence of overshoot: resource depletion
Example: overgrazing in deer
Die-off: sharp decrease in population size when resource depletion (overshoot) leads to many individuals dying
Example: many deer starve with too many new fawns feeding in spring
Topic 3.5 (Population Growth & Resource Availability)
Population Characteristics
Size (N): total number of individuals in a given area at a given time
Larger = safer from population decline
Density: number of individuals/area
Example: (12 panthers/km²)
High density = higher competition, possibility for disease outbreak, possibility of depleting food source
Distribution: how individuals in population are spaced out compared to each other
Random (trees)
Uniform (territorial animals)
Clumped (herd/group animals)
Population Characteristics & Growth Factors
Sex Ratio: ratio of males to females. Closer to 50:50, the more ideal for breeding (usually)
Die-off or bottleneck effect can lead to skewed sex ratio (not enough females) limiting population growth
Density-Dependent Factors: factors that influence population growth based on size:
Example: food, competition for habitat, water, light, even disease
All of these things limit population growth based on their size; aka - small population don’t experience these, large do
Density-Independent Factors: factors that inflence population growth independent of their size
Example: natural disasters (flood, hurricane, tornado, fire)
It doesn’t matter how big or small a population is, natural disasters limit them both
Biotic Potential = maximum potential growth rate, with no limiting resources - also called intrinsic rate of increase
May occur initially, but limiting resources (competition, food, disease, predators) slow growth, & eventually limit population to carrying capacity (K)
Exponential growth
Logistic growth = initial rapid growth, then limiting factors limit population to K
Calculating Population Change
Population Size = (Immigrations + births) - (emigrations + deaths)
Example: An elk population of 52 elk has 19 births & 6 deaths in a season, and 5 new elk immigrate to the herd and 0 elk emigrate from the herd
(19+5) - (6+0) = 18 elk
52 + 18 = 70 elk
Topic 3.6 (Age Structure Diagrams)
Age Cohorts
Age cohorts & growth = groups of similarly aged individuals
0-14 prereproductive; 15-44 = reproductive age; 45+ = post reproductive
Size difference between 0-14 ^ 15-44 indicates growth rate
Larger 0-14 cohort = current & future growth
Roughly equal 0-14 & 15-44 = slight growth/stable
Larger 15-44 = population decline
Extreme Pyramid Shape = rapid growth
Less extreme pyramid = slow, stable growth
House = stable, little to no growth
Narrowest at base = declining population
Topic 3.7 (Total Fertility Rate)
Total Fertility Rate & Infant Mortality
Total Fertility Rate (TFR): average number of children a woman in a population will bear throughout her lifetime
Higher Total Fertility Rate = higher birth rate, higher population growth rate (generally)
Replacement Level Fertility: the Total Fertility Rate require to offset deaths in a population and keep population size stable
About 2.1 in developed countries (replace mom & dad)
Higher than 2.1 in less developed countries due to higher infant mortality
Infant Mortality Rate (IMR): number of deaths of children under 1 year per 1,000 people in a population
Higher in less developed countries due to lack of access to: health care, clean water, enough food
Higher Infant Mortality Rate = higher Total Fertility Rate, due to families having replacement children
Infant Mortality & Total Fertility Rate
Factors in Infant Mortality Rate Decline
Acces to clean water
Access to healthcare (hospitals, vaccines, vitamins & supplements for moms & babies)
More reliable food supply
Factors that Affect Total Fertility Rate
Development (Affluence): more developed, or wealthy nations have a lower Total Fertility Rate than less developed nations
More eduational access for women
More economic opportunity for women
Higher access to family planning education & contraceptives
Later age of first pregnancy
Less need for children to provide income through agricultural labor
Government Policy: can play a huge role in fertility by coercive (forceful) or noncoercive (encouraging) policies
Forced sterilization
China’s 1 (now 2) child policy
Tax incentives to have fewer children
Microcredits or loans to women without children to start businesses
Topic 3.8 (Human Population Dynamics)
Does Earth Have a Human Carrying Capacity?
Malthusian theory:
Earth has a human carryin capacity, probably based on food production
Human population growth is happening faster than growth of food production
Humans will reach a carrying capacity limited by food
Technological Advancement
Humans cna alter earth’s carrying capacity with technogical innovation
Example: synthetic fixation of Nitrogen in 1918 leads to synthetic fertilizer, dramatically increasing food supply
Birth Rate, Death Rate, and Growth
Growth Rate r = % increase in a population (usually per year)
Example a growth rate of 5% for a population of 100 means they grow to 105
Crude Birth Rate & Crude Death Rate (CBR & CDR)
Births & deaths per 1,000 people in a population
Example: Global CBR = 20 & CDR = 8
Calculating Growth Rate
[Crude Birth Rate - Crude Death Rate] / 10
[20 - 8] / 10
1.2 percent
Doubling Time (Rule of 70)
Rule of 70: The time it takes (in years) for a popultion to double is equal to 70 divided by the growth rate
Example: Global growth rate = 1.2%
70/1.2 = 58.3 years
Global population will double in 58.3 years
Factors Affecting Human Population Growth
Factors that increase population growth
Higher Total Fertility Rate → higher birth rate
High infant mortality rate can drive up Total Fertility Rate (replacement children)
High immigration level
Increased access to clean water & healthcare (decrease death rate)
Factors that decrease population growth rate
High death rate
High infant mortality rate
Increase development (education & affluence)
Increased education for women
Delayed age of first child
Postponement of marriage age
Standard of Living Indicators
Standard of Living
What the quality of life is like for people of a country absed
Gross Domestic Product (GDP) = key economic indicator of standard of living
Total value of the goods & services produced
Per capita GDP is total GDP/total population
Life expectancy = key health indicator of standard of living
Average age a person will live to in a given country
Increases with access to clean water, health care, stable food sources
Topic 3.9 (Demographic Transition)
Industrialization
Indsutrialization: the process of economic and social transition from an agrarian (farming0 economing to an industrial one (manufacturing based)
Pre-industrialized/Less developed
A country that has not yet made the agrarian to indsutrial transition
Typically very poor (low GDP)
Typically high death rate & high infant mortality
High Total Fertility Rate for replacement children & agricultural labor
Industrializing/developing
part way through this transition
Decreasing death rate & Infant Mortality Rate
Rising GDP
Industrialized/developed: completed the transition
Very low Crude Death Rate & Infant Mortality Rate
Very high GDP
Low Total Fertility Rate
Stage 1 - Preindustrial
High Infant Mortality Rate & high death rate due to lack of access to clean water, stable food supply, and healthcare
High Total Fertility Rate due to lack of access to:
Education for women
Contraceptives/family planning
Need for child agricultural labor
Little to no growth due to high Crude Birth Rate & Crude Death Rate balancing each other out
Example: Virtually no country is in phase 1
Stage 2 - Indsutrializing/Developing
Modernizations bring access to clean water, healthcare, stable food supply
Infant Mortality Rate & Crude Death Rate decline
Total Fertility Rate remains high due to
Lack of education for women & contraceptives/family planning
Need for child agricultural labor
Generational lag (takes time for education & societal change to spread)
Rapid growth, due to high Crude Birth Rate & declining Crude Death Rate
Economical/Societal Indicators
Low per capita GDP
Shorter life-expectancy
High infant mortality
High Total Fertility Rate
Low literacy rate & school life expectancy for girls
Stage 3 - Developed/Industrialized
Modernized economy and society increase family income, so Total Fertility Rate declines significantly due to
More education oppportunities for women
Delayed age of marriage & first child to focus on education/carrer
Access to family planning & contraceptives
Slowing growth rate as Crude Birth Rate drops closer to Crude Death Rate
Economical/societal Indicators
High per capita GDP
Long life-expectancy
Low infant mortality
Total Fertility Rate near replacement level (2.1)
High literacy rate & school life expectancy for all
Stage 4 - Post-Industrialized/Highly Developed
Highly modernized countries that a very affluent
Total Fertility Rate declines even further as families become more wealthy and spend even more time on educational & career pursuits
Increased wealth & education brings even more prevalent use of family planning & contraception
Crude Birth Rate drops lower than Crude Death Rate & growth becomes negative (population decline)
Economical/societal Indicators
Very high per capita GDP
Longest life-expectancy
Total Fertility Rate below replacement level (2.1)
Highest contraceptive use rates
UNIT 4
Topic 4.1 (Plate Tectonics)
Earth’s Structure
Core: Dense mass of nickel, iron, and radioactive elements that release massive amounts of heat
Mantle: bulk of Earth’s interior; three layers
Magma (molten rock) layer that slowly circulates due to heat from core
Asthenosphere: semi-molten, flexivle outer layer of mantle, beneath the lithosphere
Lithosphere: thin, brittle layer of rock floating on top of mantle (broken up into tectonic plates)
Crust: very outer layer of the lithosphere, Earth’s surface
Plate Boundaries
Divergent Plate Boundary
Plates move away from each other
Rising magma plume from mantle forces plates apart
Forms: mid-oceanic ridges, volcanoes, seafloor spreading, and rift valleys (on land)
Transform Fault Plate Boundary
Plates slide sideways past each other
Forms: faults (fracture in rock)
Convergent Plate Boundary
Plates move towards each other
Leads to subduction (one plate being forced beneath another)
Forms: mountains, island arcs, and volcanoes
Mantle Convection Currents
Magma heated by earth’s core rises towards lithosphere
Rising magma forces oceanic plates apart
Creates mid ocean ridges, volcanoes, spreading zones or “seafloor spreading”
Magma cools and solidifies into new lithosphere at spreading zone
Spreading magma forces oceanic plate under continental plate
Sinking oceanic plate melts back into magma
New magma is forced up, creating narrow, coastal mountains (e.g. Andes) & volcanoes on land
Convergent Boundaries
Oceanic-Oceanic: one plate subducts underneath other
Forces magma up to lithosphere surface, forming mid ocean volcanoes
Island arcs
Off-shore trench
Oceanic-Continental: dense oceanic plate subducts bentah continetal plate & melts back into magma
Forces magma up to lithosphere surface
Coastal Mountains (Andes), Volcanooes on land, trenches, tsunamis
Continental-Continental: surface crust from both plates “buckles” upward (mountains)
Example: Himalayas
Transform Fault Boundary
Plates sliding sideways past each other; can create a fault (fracture in rock surface)
Eathquakes occur when rough edges of plates get stuck on each other
Pressure builds as plates keep sliding, but edges stay stuck
When stress overcomes the locked fault, plates suddenly release, slide past each other and release energy that shakes the lithosphere
Tectonic Map Can Predict…
Ring of Fire: pattern of volcanoes & eathquake zones all around pacific plate
Offshore island arcs (Japan)
Transform faults: likely location of earthquakes
Hotspots: areas of especially hot magma rising up to lithosphere
Mid-ocean Islands (Iceland, Hawaii)
Topic 4.2 (Soil Formation & Erosion)
What is Soil?
Mix of geologic (rock) and organic (living) components
Sand, silt, clay
Humus: main organic part of soil (broken down biomass like leaves, dead animals, waste, etc.)
Nutrients: ammonium, phosphates, nitrates
Water and Air
Living Organisms
Plants: anchors roots of plants and provides water, shelter, nutrients (Nitrogen, Phosphorus, Potassium, Magnesium) for growth
Water: filters rainwater + runoff by trapping pollutants in pore spaces + plant roots. Clean water enters groundwater + aquifers
Nutrient Recycling: home to decomposers that break down dead organic matter + return nutrients to the soil
Habitat: provides habitat for organisms like earthworms, fungi, bacteria, moles, slugs
Weathering
Breakdown of rocks into smaller pieces
Physical (wind, rain, freezing/tthawing of ice)
Biological (roots of trees rack rocks)
Chemical (acid rain, acids from moss/lichen)
Weathering of rocks = soil formation
Broken into smaller and smaller pieces
Carried away and deposited by erosion
Erosion
Transport of weathered rock fragments by wind and rain
Carried to new location and deposited (deposition)
Soil Formation
From below
Weathering of parent material produces smaller, and smaller fragments that make up geological/inorganic part of soil
Sand, silt, clay
Minerals
From above
Breakdown of organic matter adds humus to soil
Erosion deposits soil particles from other areas, adding to soil
Effects on Soil Formation
Parent material: soil pH, nutrient content
Topography: steep slope = too much erosion; more level ground = deposition
Climate: warmer = faster breakdown of organic matter; more precipitation = more weathering, erosion + deposition
Organisms: Soil organisms like bacteria, fungi, worms breakdown organic matter
Soil Horizons
O-Horizon: layer of organic matter (plant roots, dead leaves, animal waste, etc) on top of soil
Provides nutrients and limits H2O loss to evaporation
A-Horizon: aka topsoil; layer of humus (decomposed organic matter) and minrals from parent material
A-Horizon has most biological activity (earthworms, soil microbes) breaking down organic matter to release nutrients
B-Horizon: aka subsoil; lighter layer below topsoil, mostly made of minerals with little to no organic matter
Contains some nutrients
C-Horizon: least weathered soil that is closest to the parent material, sometimes called bedrock
Soil Degradation: The loss ability of soil to support plant growth
UNIT 7
Topic 7.1 (Introduction to Air Pollution)
Air Pollution Basics
Write about air pollutants (specific molecules/particles) not just air “pollution” as an idea
Clean Air Act (1970) identified 6 criteria air pollutants that the EPA is required to set acceptable limits for, monitor, and enforce
SO2 (Sulfur Dioxide)
Coal combustion (electricity) | respiration irritation | smog | acid precipitation
NOx (Nitrogen Oxides; NO & NO2)
All Fossil Fuel combustion (gas esp.) | O3 | photochemical smog | acid precipitation
CO (Carbon Monoxide)
Incomplete combustion | O3 | Lethal to humans
PM (Particulate Matter)
Fossil Fuel/Biomass combution | respiration irritation | smog
O3 (Ozone; tropospheric)
Photochemical oxidation of NO2 | respiration iritation | smog | plant damage
Pb (Lead)
Metal plants, waster incineration, neurotoxicant
Air Pollutants vs. Greenhouse Gasses
CO2 is NOT one of 6 criteria pollutants in Clearn Air Act (although 07’ SC ruling found EPA could regulate greenhouse gases and it began doing so in 09’}
Carbon dioxide does not directly lower air quality from a human health standpoint
Not toxic to organisms to breath
Not damaging to lungs/eyes
Does nto lead to smog, decreased cisibility
Carbon dioxide is a greenhouse gas; it does lead to earth warming, and thus environmental and human health consequences (bases for SC ruling in 07’)
Bottom Line: in APES, carbon dioxide has not typically been included on FRQ scoring guides as an air pollutant
(stick to sure fire air pollutants on FRQS: Sulfur Dioxide, Nitrogen Oxides, Ozone, Particulate Matter)
Coal Combustion
Releases more air pollutants than other Fossil Fuels; ~35% of global electricity
Releases Carbon Monoxide, Carbon Dioxide, Sulfur Dioxide, Nitrogen Oxides, toxic metals (mercury,a rsenic, lead), and Particulate Matter (offten carries the toxic metals)
Impacts of Sulfur Dioxide
Respiratory irritant (inflammation of bronchioles, lungs), worsens asthma & bronchitis
Sulfur aerosols (suspended sulfate particles) block incoming sun, reducing visibility & photosynthesis
Forms sulfurous (grey) smog
Combines with water & Oxygen in atmosphere to form sulfuric acid → acid precipitation
Nitrogen Oxides (NOx)
Released by combustion of anything, especially Fossl Fuels & biomass
NOx refers to nitrogen oxides (both NO, and NO2)
NO forms when N2 combines with Oxygen (especially during combustion)
NO can become NO2 by reacting with Ozone or Oxygen
Sunlight converts NO2 back into NO
Environmental & human Health Impacts
Respiratory irritant
Leads to tropospheric ozone (O3) formation, which leads to photochemical smog
Combines with water & O2 in atmospheric to form nitric acid → acid precipitation
EPA & Lead
Before Clean Air Act, lead was a common gasoline additive; EPA began phasout of lead from gasoline in 1974
Vehicles made after 1974 are required to have catalytic converters to reduce Nitrogen Oxides, Carbon Monoxide and hydrocarbon emissions (lead damages catalytic converters)
Also a known neutroxicant (damages nervous systems of humans)
Primary vs. Secondary Air Pollutants
Primary
Emitted directly from sources as vehicles, power plants, factories, or natural sources (volcanoes, forest fires)
Nitrogen Oxides, Carbon Monoxide, Carbon Dioxide, Voltaile Organic Compounds, Sulfur Dioxide, Particulate Matter, hydrocarbons
Secondary
Primary pollutants that have transformed in presence of sunlight, water, Oxygen
Occur more during the day (since sunlight often drives formation)
Tropospheric O3 (Ozone)
Sulfuric Acid (H2SO4) & Sulfate (SO4 2-)
Nitric acid (NHO3) & nitrate (NO3 -)
Topic 7.2 (Photochemical Smog)
Photochemical Smog Precursors & Conditions
Precursors
Nitrogen Dioxide
Broken by sunlight into NO + O (free O + O2 → O3)
Volatile organic compounds
(Hydrocarbons) that bind with NO & form photochemicals oxidants
Carbon-based compounds that volatilize (evaporate) easily (this makes them “smelly”)
Sources: gasoline, formaldehyde, cleanings fluids, oil-based paints, even coniferous trees (pine smell)
Ozone
Forms when Nitrogen Dioxide is broken by sunlight & free O binds to Oxygen
Respiratory irritation in troposphere ( at earth’s surface )
Damaging to plant stomata, limiting growth
Conditions
Sunlight
Drives Ozone formation by breaking down Nitrogen Dioxide → Nitric Oxide + O; then free O atom binds with Oxygen
Warmth
Hotter atmopshere temperature speeds Ozone formation, evaporation of volatile organic compounds & thus amog formation
Normal Ozone Formation
Sunlight breaks Nitrogen Dioxide into Nitric Oxide + O
O bonds with O2 to form Ozone
At night, Ozone reacts with Nitric Oxide to form Nitrogen Dioxide and O2 once again; Ozone levels drop overnight
Ozone formation typically peaks in afternoon when sunlight is most direct and Nitrogen Dioxide emissions from morning traffic have peaked
Morning commute leads to high Nitrogen Dioxide levels from car exhaust
Photochemical Smog Formation
Sunlight breaks Nitrogen Dioxide into Nitric Oxide + Oxygen
Oxygen bonds with Oxygen Gas to form Ozone
Without Nitric Oxide to react with, Ozone builds up instead of returning to Oxygen gas & Nitrogen Dioxide overnight
Ozone combines with photochemical oxidants (Nitric Oxide + Volatile Organic Compounds) to form photochemical smog
Volatile Organic Compounds bon with Nitric Oxde to form photochemical oxidants
Factors that Increase Smog Formation
More sunlight (summer, afternoon) = more Ozone
Warmer temperature, speeds evaporation of Volatile Organic Compounds that lead to Ozone
Higher Volatile Organic Compound emission (gas stations, laundromats, petrochemical & plastic factories)
Increased vehicle traffic; increases Nitrogen Dioxide emissions & therefore Ozone formation
Urban areas have more smog due to all of these factors
More traffic → more Nitrogen Dioxide
Hotter temperatures due to low albedo of blacktop
More Volatile Organic Compounds due to gas stations & factories
More electricity demand; more Nitrogen Oxide emissions from nearby power plants
Impacts & Reduction of Smog
Impacts:
Environmental
Reduces sunlight; limiting photosynthesis
Ozone damages plant stomata and irritates animal respiratory tracts
Humans
Respiratory irritant; worsens asthma, bronchitis, COPD; irritates eyes
Economic
Increased health care costs to treat asthma, bronchitis, COPD
Lost productivity due to sick workers missing work or dying
Decreased agricultural tields due to less sunlight reaching crops & damage to plant stomata
Reduction:
Vehicles
Decreasing the number of vehicles on the road decreases Nitrogen Dioxide emissions
Fewer vehicles = less gas = fewer Volatile Organic Compounds
Carpooling, public transport, bikin, walking, working from home
Energy
Increased electricity production from renewable sources that don’t emit Nitrogen Oxides (solar, wind, hydro)
Natural gas power plants release less Nitrogen Oxides than coal
Sample Questions for this Topic
MCQs:
Scientists have discovered that Volatile Organic Compounds (VOCs) emitted from trees can contribute to photochemical smog formation. Data in the table velow were collected in 2006 and 2014 in Berlin, Germany. Isoprene is a VOC released by some tree species. Impact factor refers to the percentage of ozone.
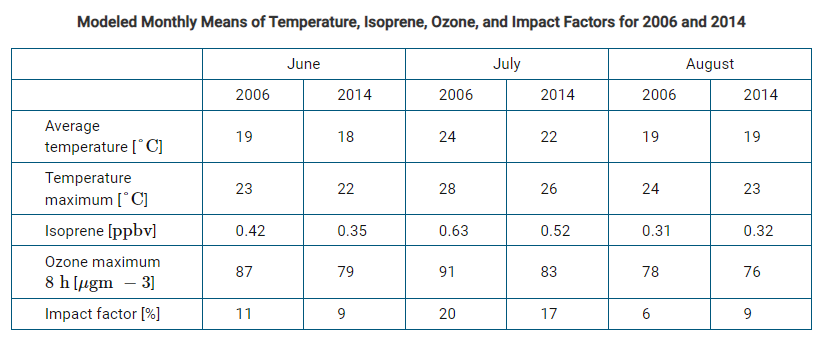 a. Which of the following best describes the relationship between variables in the data table?
A) Impact factor causes a change in temperature maximum
B) Isoprene levels vary depending on traffic and urbanization
C) Ozone Maximum is correlated to average and maximum temperature
D) Changes in average temperature are linked to changes in land use in Berlin
b. Which of the following claims is best supported by the data shown in the table?
A) Ozone levels are not a serious air quality concern in Berlin
B) Ozone levels in Berlin were consistently higher in 2014 than in 2006.
C) Isoprene’s contribution to ozone levels in Berlin was greatest in July of both years
D) Isoprene levels were negatively correlated with maximum temperature
Air pollution from a power plant is being monitored for levels of nitrogen dioxide and ground-level ozone. The levels are measured daily at the same time. Which of the following best predicts the impact of a dark and cloudy day on the readings for the levels of air pollutants measured?
A) There will be no change in the levels of nitrogen dioxide or ground-level ozone
B) There will be a decrease in the level of nitrogen dioxide and an increase in the level of ground-level ozone
C) There will be an increase in the levels of both nitrogen dioxide and ground-level ozone
D) There will be an increase in the level of nitrogen dioxide and a decrease in the level of ground-level ozone
The graph shows the average distance traveled by individuals in a population in an urban area in the southwestern United States. Based on the data, which of the following months most likely experiences the highest levels of photochemical smog?
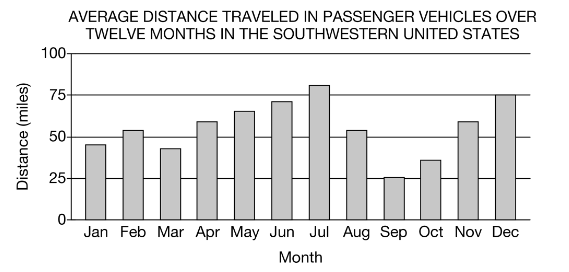 A) July
B) August
C) November
D) December
FRQs:
Explain the relationship between NO2 concentration and ozone concentration represented in this graph.
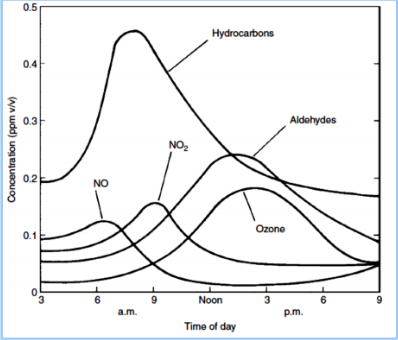
Describe how the time of day impacts ozone formation
Topic 7.3 (Thermal Inversion)
Urban Heat Island Effect
Urban Heat Island Effect
Urban areas tend to have higher surface & air temperature than surrounding suburban and rural areas due to:
Lower albedo; concrete & asphalt absorb more of sun’s energy than areas with more vegetation (absorbed sunlight given off as IR radiation - heat)
Less evapotrasnpiration; water evaporating from surfaces and transpiration from plants carries heat from surface into the atmosphere
This cools off rural & suburban areas which have more vegetation
Thermal Inversion
Because cold air at the surface is trapped beneath the warmer mass above, convection doesn’t cary pollutants up & away
Normally, the atmosphere is warmest at earth’s surface, and cools as altitude rises
During a thermal inversion, a cooler air mass becomes trapped near earth’s surface (inverting normal gradient)
Due to a warm front moving in over it
Or due to hot urban surfaces cooling overnight while IR radiation absorbed during the day is still being released
Because warm air rises, air convection carries air pollutants away from earth’s surface & distributes them higher into the atmosphere
Effects of Thermal Inversion
Air pollutants (smog, Particulate Matter, Sulfur Dioxide, Nitrogen Oxides) trapped closer to earth
Respiratory Irritation: asthma flare ups leading to hospitalization, worsened COPD, emphysema
Decreased tourism revenue
Decreased photosynthetic rate
Sample Questions for This Topic
MCQs:
Which of the following best describse the process shown in the diagram below?
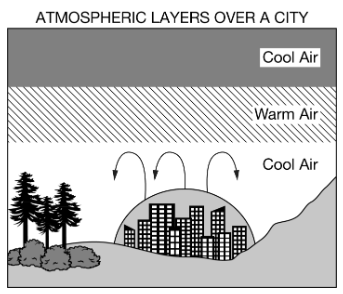 A) Less-dense, cool air rises up and mixes with the denser warm air above it, increasing the amount of thermal pollution in the atmosphere
B) Less-dense, warm air creates a temperature inversion
Topic 7.5 (Indoor Air Pollutants)
Developing vs. Developed Countries
Developing nations use more subsitence fuels such as wood, manure, charcoal (biomass)
These biomass fuels release Carbon Monoxide, Particulate Matter, Nitrogen Oxides, Volatile Organic Compounds (can also cause deforestation)
Often combusted indoors with poor ventilation, leading to high concentrations
Estimated 3 billion people globally cook with subsitence fuels, resulting in estimated 3.5-4.3 million deaths annually
Developed nations use more commerical fuels (coal, oil, natural gas) supplied by utilities
Typically burned in clsoed, well ventilated furnances, stoves, etc.
Major indoor air pollutants in developed nations come from chemicals in products: adhesives in furniture, cleaning supplies, insulation, lead paint
PM & Asbestos
Particulates (PM) are a common indoor air pollutant
Example: smoke (from indoor biomass combustion or cigarettes), dust, and asbestos
Asbestos is a long, silicate particle previously used in insulation (since been linked to lung cancer & asbestosis)
Phased out of use, but still remains in older buildings
Not dangerous until insulation is disturbed and asbestos particles enter air & then respiratory tract
Should be removed by trained professionals which proper respiratory equipment, ventilation in the area it’s being removed from, plastic to seal off area from rest of the building
CO (Carbon Monoxide)
Carbon Monoxide is produced by incomplete combustion of basically any fuel
Not all the fuel is combusted eu to low Oxygen or temperature
Carbon Monoxide is an asphyxiant: causes suffocation due to Carbon Monoxide binding to hemoglobin in blood, displacing Oxygen
Lethal to humans in high concentrations, especially with poor ventilation (odorless and colorless - hard to detect)
Developed nations: Carbon Monoxide released into home by malfunctioning natural gas furnance ventilation
Can be detected by carbon monoxide detectors (similar to smoke detectors)
Developing nations: Carbon Monoxide emitted from indoor biomass combustion for heating/cooking
VOCs (Volatile Organic Compounds)
Chemicals used in variety of home products that easily vaporize, enter air, ad irritate eyes, lungs, bronchioles
Adhesives/sealants: chemicals used to glue carpet down, hold furniture together, seal panels
Formaldehyde is a common adhesive in particle board and carpet glues (new carpet smell)
Cleaners: common household cleaners and deodorizers such as febreeze
Plastics and Fabrics: both can release Volatile Organic Compounds themselves, or form adhesives used in production
Radon Gas
Radioactive gas released by decay or uranium naturally found in rocks underground (granite especially)
Usually enters homes through cracks in the foundatuion & then dispenses up from basement/foundation through home
Can also seep into groundwater sources & enter body through drinking water
2nd leading cause of lung cancer after smoking
EPA recommends testing homes with airborne Radon monitor
Sealing cracks in foundation can prevent it from entering and increasing ventilation in the home can disperse it if it’s detected
Topic 7.6 (Reduction of Air Pollutants)
Reducing Emissions
Reducing emissions = reducing air pollutants
Drive less, walk/bike/bus more
Conserve electricity (smart appliances)
Eat more plants, less meat
Renewable, non-pollution emitting energy (solar, wind, hydro)
Laws/Regulations
Clean Air Act
Allows EPA to set acceptable levels for criteria air pollutants
Monitor emissions levels from power plants and other facilities
Tax/sue/fine coporations that release emissions above levels
Pollution Credits
Similar to Individual Transfer Quota for fish
Companies that reduce emissions well below EPA-set levels earn pollution credits
They can sell these to companies that release more than acceptable levels
CAFE Vehicle Standards
(Coportate Average Fuel Economy) standards require the entire US “fleet” of vehicles
More efficient vehicles burn less gasoline and release less Nitrogen Oxides, Particulate Matter, Carbon Monoxide, and Carbon Dioxide
Reducing Vehicle Air Pollutants
Vapor Recovery Nozzle
Capture hydrocarbon Volatile Organic Compounds released from gasloine fumes during refueling
Separate tube inside nozzle captures vapors & returns them to underground storage tank beneath the gas station
Reduces Volatile Organic Compounds, which contribute to smog & irritate respiraritory tracts
Also reduces benzene (carcinogen) released from gasoline vapors
Catalytic Converter (CC)
Required on all vehicles after 1975
Contains metals (platinum & palladum) that bind to Nitrogen Oxides and Carbon Monoxide
Catalytic Converter converts Nitrogen Oxides, Carbon Monoxide, and other hydrocarbons into Carbon Dioxide, Nitrogen Gas, Oxygen Gas, and Water
Reducing Sulfur Oxides & Nitrogen Oxides
Crushed Limestone (Sulfur Dioxide)
Used to reduce Sulfur Dioxide from coal power plants
Crushed coal mixed with limestone (calcium carbonate) before being burned in boiler
Calcium carbonate in limestone combines with Sulfur Dioxide to produce calcium sulfate, reducing the Sulfer Dioxide being emitted
Calcium sulfate can be used to make gypsum wallboard or sheetrock for home foundations
Topic 7.7 (Acid Rain)
Sources of Nitrogen Oxides & Sulfur Dioxide
Nitrogen Oxides and Sulfur Dioxide are the primary pollutants that cause most acid precipitation
Major Sources
Sulfur Dioxide: coal fired power plants, metal factories, vehicles that burn diesel fuel
Nitrogen Oxides: vehicle emissions, disel generators coal power plants
Limiting Acid Rain
Reducing Nitrogen Oxides & Sulfur Dioxide emissions reduces acid deposition
Higher CAFE Standards
More public transit
Renewable energy sources
More efficient electricity use
Since passage of Clean Air Act, acid deposition has decreased significantly
Nitrogen Oxides and Sulfur Dioxide react with Oxygen Gas and Water in the atmosphere, forming nitric and sulfuric acid
Sulfuric acid and nitric acid dissociate in the presenof water into sulfate and nitrate ions, and hydrogen ions (H+)
Acidic rain water (higher hydrogen ions concentration) decreases soil and water pH; can limit tree growth in forests down wind from major Sulfur Dioxide & Nitrogen Oxides sources
Enironmental Effects of Acid Rain
Acidity = higher hydrogen ions concentration, lower pH
Soil/Water Acidification
Hydrogen Ions displace or leech other positive charged nutrients (Calcium Ions, Potassium Ions) from soil
Hydrogen Ions also make toxic metals like aluminum and mercury more soluble in soil and water
This can slow growth or kill plants and animals living in the soil or water
Aquatic species have different pH tolerances
pH Tolerance
As pH decreases (more acidic) outside optimal range for a species, population declines
When pH leaves range of tolerance, they cannot survive at all, due to:
Aluminum toxicity
Disrupted blood osmolarity (Sodium Ions/Chloride balance disrupted at low pH)
Indicator species can be surveryed and used to determine conditions of an ecosystem (soil, water, etc.)
Example: high whitemoss/filamentous algae population pH < 6.0
High crustacean population indicates pH > 6.0
Mitigating Acid Rain
Limestone (calcium carbonate) is a natural base that can neutralize acidic soil/water
Decreasing these primary pollutants that drive acid rain can reduce it
Renewable energy sources, decreasing coal comb.
Fluidized bed combustion & lower burning temp. for existing coal power plants
Dry or wet scrubbers
UNIT 8
Topic 8.1 (Sources of Pollutants)
Point vs, Nonpoint Pollutant Sources
Point Source
Pollutant that enters environment from an easily identified and confied place (You can point to it)
Nonpoint Source
Pollutants entering the environment from many places at once (Difficult to point to one inidividual source)
Must-Know Pollutation Examples
Point Source
Animal waste runoff from a concentrated animal feeding operation (ammonia, fecal coliform bacteria)
Emissions from smokestack of a coal power plant (Carbon DIoxide, Nitrogen Oxides, Sulfur Dioxide, Particulate Matter)
BP Oil SPill (hydrocarbons, benzene)
Nonpoint Source
Urban runoff (motor oil, nitrate fertilizer, road salt, sediment)
Pesticides sprayed on agricultural fields; carried by wind and washed off large agricultural regions into bodies of water
Estuaries and bays are polluted by many nonpoint pollution sources from the large watersheds that empty into them.
Pollutants vs. Pollution
Pollutants
Specific chemicals or groups of chemicals from specific sources with specific environmental & human health effects
Much more likely to earn you FRQ credit
On any pollution-related FRQ:
Their sources
The environmental & human effects
Their mitigation strategies
Pollution
Vage, nondescript term for any substance that is harmful to the environment
Never acceptable on an APES FRQ
Exceptions:
Specifies categories of pollution
Thermal pollution
Noise pollution
Sediment pollution
Topic 8.2 (Human Impacts on Ecosystems)
Range of Tolerance
Organisms have range of tolerance for abiotic conditions in their habitat
pH, temperature, salinity (saltiness), sunlight, nutrient levels (ammonia, phosphate)
Organisms also have range of tolerance for pollutants that human activies release into their habitats
Pollutants cause physiological stress such as
Limited growth
Limited reproductive function
Difficulty respiring (breathing), potentially asphyxiation (suffocation)
Hormonal disruption
Death (if concentration of pollutant is high enough)
A big theme of Unit 8 is being able to explain specific effects of pollutants on organisms
Enironmental Effects of Acid Rain
Aquatic species have different pH tolerances
pH Tolerance
As pH decreases (more acidic) outside optimal range for a species, population declines
When pH leaves range of tolerance, they cannot survive at all, due to:
Aluminum toxicity
Disrupted blood osmolarity (Sodium Ions/Chloride balance disrupted at low pH)
Indicator species can be surveryed and used to determine conditions of an ecosystem (soil, water, etc.)
Example: high whitemoss/filamentous algae population pH < 6.0
High crustacean population indicates pH > 6.0
Temperature Tolerance of Reef Algae
Coral reef = mutualistic relationship between coral & photsynthetic algae called zooxanthellae; algae supply sugar & coral supply CO2 + detritus (nutrient containing organic matter)
Algae have narrow temperature tolerance and leave the reef when temperature rises
Pollutants from runoff (sediment, pesticides, sunscreen) can also force algae from reef
Coral lose color & become stressed and vulnerable to disease without algae (main food source)
Human Impacts on Coral Reef
Humans disrupt coral reef ecosystems via green house gas emissions (warming ocean temperatuer & bleaching coral)
Overfishing decreases fish populations in coral reef ecosystem & bottom trawling can break reef structure and stir up sediment
Urban and agricultural runoff also damages coral reef ecosystems
Sediment pollution: sediment carried into ocean by runoff makes coral reef waters more turbid, reducing sunlight (photosynthesis)
Toxicants: chemicals in sunscreen, oil from roadways, pesticides from agricultural runoff
Nutrients (Phosphorus/Nitrogen): ammonia from animal waste, nitrates/phosphates from agriculture or lawn fertilizers
Oil Spill Effects
Hydrocarbons in crude oil (petroluem) are toxic to many marine organisms and can kill them, especialy if they ingest (eat) the oil or absorb through gills/skin
Other physiological effects:
Decreased visibility and decreased photosynthesis due to less sunlight penetrating water urface
Oil sticking to bird feathers
Oil sinking to bottom and killing bottom-dwellers due to: direct toxicity or suffocation
Oil can wash ashore and decrease tourism revenue and kill fish, decreasing fishing indsutry revenue, hurt restaurants that severe fish
Oil can settle deep in oot structures of estuary habitats like mangroves or salt marshes
Can be toxic to salt marsh grasses, killing them and loosening their root structure, leading to coastline erosion
Can remove habitats used by fish & shellfish for breeding grounds
Oil Spill Clean Up
Oil spills can occur when an underwater oil well explodes/blows out (BP Gulf Spill) or when a tanker runs into a rock/iceburg and is punctured (Exdon Valdez)
Cleanup can involve vooms on surface to contain spread and ships with vaccuum tubes to sipgon oil off of the surface or devices to skim it off
Physical removal of oil from beach sand and rocks with towels, soaps, shovels
Chemical dispersants sprayed on oil slicks to break up and sink to the bottom
Clears up surface, but can smother bottom-dwellers
Dispersant chemicals may be harmful
Burning oil off surface
Topic 8.3 (Endocrine Disruptors & Industrial Water Pollutants)
Endocrine Disruptors
Chemicals that interfere with the endrocrine (hormonal) systems of animals
Bind to cellular receptors meant for hormones, blocking the hormone from being received, or amplifying its effects
Human medications that pass through urine & into seweage or are flushed down toilet are a common source (meant to influence human hormones, so they can also disrupt animals)
Example: Atrazine (herbicide) binds to receptors of cells that should convert estrogen into testosterone in mal frogs, leading to: high estrogen in males, low spemer count, even feminzation (development of eggs in the testes or ovary formation)
Atrazine: broad-spectrum herbicide used to control weeds & prevent crop loss
Applied to agricultural fields, runs off into local surface or groundwater or is carried by wind
Can contaminate human well-water, or enter body via unwashed produce
DDT: broad-spectrum insecticide that was phased out, but still persists in environment
Applied to agricultural fields, runs off into local surface or groundwater or is carried by wind
Phthalates: compounds used in plastic and cosmetic manufacturing
Enter surface & groundwater via intentional dumping of trash, or chemical waste from plastic/cosmetic factories improperly disposing of water, landfill leaching
Also found in some cosmetics & plastic food containers (#3 plastic & “fragrance”)
Lead, arsenic, mercury: heavy metals
Many human medications that enter sewafe via human urine or flushed meds
Mercury
Mercury: naturally occuring in coal, released by anthropogenic activities:
Coal combustion, trash inceneration, burning medical waste, heating limestone for cement
Attaches to Particulate Matter released by burning * deposists in soil/water whereever Particulate Matter settles
Can be released if coal ash stored in ponds overflow & runoff
Endocrine Disruptor: inhibits estrogen & insulin (intereferes with menstrual cycle & ovulation)
Tertogen: (chemical harmful to developing fetuses) can accumulate in fetus brain
Pregnant women can reduce risk by eating less seafood
Mercury itself isn’t toxic, but bacteria in water sources convert it to methylmercury which is highly toxic to animals (neurotoxicant that damages central nervous system)
Arsenic & Lead
Arsenic: naturally occuring element in rocks underground that can dissolve into drinking water; natural release into groundwater can be worsened by mining
Anthropogenic sources: formerly in pesticides applied to agricultural fields (can still linger in soil, wood treatment chemical to prevent rot, coal combustion & ash)
Carcinogenic (lungs, bladder, kidneys) & endrocrine disrupting
Endocrine disruptor (specifically glucocorticoid system)
Can be removed with water filters
Lead: found in old paint (in homes), old water pipes, and soils contaminated by Particulate Matter from behicle exhaust before lead was phased out of gas in 70s
Also released in fly ash (Particulate Matter) of coal combustion
Neurotoxicant (damages central nervous system, especially in children)
Endocrine disruptor
Can be removed with water filters
Coal Ash
Coal ash can be a source of mercury, lead, and arsenic
Can attach to fly ash (Particulate Matter) from smokestack and be carried by wind, deposited in ecosystems far away
Both fly and bottom coal ash are often stored on site in ponds, dug into soil & lined with plastic (sometimes)
Ponds can leach into groundwater, contaminating it with arsenic, lead, mercury,
Ponds can overflow & runoff into nearby surface waters & agricultural fields
Topic 8.4 (Human Impacts on Wetlands and Mangroves)
Wetlands
An area with soil submerged/saturated in water for at least part of the year, but shallow enough for emergent plants
Wetland plants have adapted to living with roots submerged in standing water (cottails, lily pads, reeds(
Ecosystem Services of Wetlands
Provisioning: habitat for animal & plant foods
Regulating: groundwater rechartge, absorbing of floodwater, CO2, sequestration
Supporting: H2O filtration, pollinator habitats, nutrient cycling, pest control
Cultural: tourism revenue, fishing licesne, camping fees, ed/med research
Threats to Wetlands
Pollutants: nutrients (Nitrogen/Phosphorus), sediment, motor oilm pesticides, endocrine disruptors
Development: wetlands cna be fillied in or drained to be developed int homes, parking lots, stores, or agricultural land
Water diversion upstream for flood control, agriculture, or drinking water can reduce water flow and dry up wetlands
Dam construction for flood control/hydroelectricity reduces water & sediment (Nitrogen/Phosphorus) flow to wetlands
Overfishing: disrupts food web of wetlands (decrease in fish predators, increase in prey)
Topic 8.5 (Eutrophication)
Eutrophication Process
Because they’re limiting nutrients in aquatic ecosystems, extra input of Nitrogen & Phosphorus lead to eutrophication (excess nutrients) which fuels algae growth
Algae bloom coers surface of water, blocking sunlight & killing plants below surface
Algae eventually die-off; bacteria that break dwn dead algae use up Oxygen Gas in he water (because decomposition = aerobic process)
Lower Oxygen Gas levels (dissolved oxygen) in water kills awauatic animals, especially fish
Bacteria use up even more Oxygen Gas to decompose dead aquatic animals
Creates positive feedback loop: less Oxygen Gas → more dead organisms → more bacterial decomposition → less Oxygen Gas
Cultural Eutrophication
Antrhopogenic nutrient pollution (Nitrogen & Phosphorus) that leads to eutrophication
Algae bloom due to increase of Nitrogen/Phosphorus → decreased sunlight → plants below surface die → bacteria use up Oxygen Gas for decomposition → hypoxia (low Oxygen Gas) & dead zones
Major Nitrogen/Phosphorus sources:
Discharge from sewage treatment plants (Nitrogen/Phosphorus in human waste & phosphates in soaps/detergents)
Animal waste from Concentrated Animal Feeding Operations
Synthetic fertilizer from agricultural fields & lawns
Oligotrophic Waterways
Waterways with low nutrient (Nitrogen/Phosphorus) levels, stable algae population, and high dissolved oxygen
Can be de to lack of nutrient pollution, or age of the body of water
Aquatic ecosystems naturally undergo succession
Sediment buildup on bottom (benthic zone) leads to higher nutrient levels
Overtime, ponds naturally shift from oligotrophic, to mesotrophic, to eutrophic
Dissolved Oxygen & Dead Zones
Decrease in dissolved oxygen (hypoxia) is what causes a dead zone
All aquatic life requires dissolved oxygen in water for respiration
As Dissolved Oxygen decreases, fewer species can be supported
Most fish require at least 3.0 ppm to survive, 6.0 ppm to reproduce
Topic 8.6 (Thermal Pollution)
Solubility of Oxygen & Temperature
Solubility = the ability of solid/liquid/gas to dissolve into a liquid (oxygen dissolving into water in this case)
Inverse relationship between water temperature & oxygen solubility
As water temperature increases, Dissolved Oxygen decreases
Thermal Pollution: when heat released into water has negative effectson organisms living in the water
Heat increases respiration rate of aquatic organisms (thermal shock)
Hot water also has less Oxygen Gas
This can lead to suffocation without enough Oxygen Gas to support respiration
Sources of Thermal Pollution
Power plants use cool water from surface/ground water sources nearby to cool steam used to turn a turbine back into water to resuse
Steel mills, paper mills, and other manufacturing plants also use cool water to cool down machinery & returned warm water to local surface waters
Urban stormwater runoff can also case thermal pollution due to heat from blacktop/asphalt
Nuclear power plants require especially large amounts of cool water to cool stream back into water & to cool the reactor core
Cooling Towers
Cooling towers/ponds are used to cool seam back into water & to hold warmed water before returning to local surface water
Already standard in nuclear power plants, but can be optimized to cool water better or hold it longer before returning to nearby surface waters
Topic 8.7 (Persistant Organic Pollutants)
POPs
Persistent (long-lasting) Organic (carbon-based) Pollutants
Synthetic (human-made) compounds that do not easily breakdown in the environment; accumulate and buildup in water & soil
Fat-soluble, meaning they also accumulate and persist in animals’ fat tissue instead of passing through the body (don’t easily dissolve into blood/urine)
Examples & Sources of POPs
Examples:
DDT (outdated insecticide)
PCBs (plast/plant additive)
PBDEs (fire-proofing)
BPA (plastic additive)
Dioxins (fertilizer production & combustion of waste & biomass)
Phthalates (plastics)
Perchlorates (rocket.missile fuel, fireworks)
Pesticides
DDT was widely used as an insecticide before phaseout in most developed nations
Still persists in soils & sediments in aquatic ecosystems and builds up in food webs
Medications (Pharmaceutical Compounds)
Steroids, reproductive hormones, antibiotics, that pass through human bodies & into sewage release from treatment plants
Persists in streams/rivers & disrupt aquatic organisms’ endocrine function
Dioxins
Byproduct of fertilizer production & burning of medicla waste, Fossil Fuels, biomass
90% of human dioxin exposure comes from animal fats (meat, dairy, fish) since dioxins buildup in animal fat tissue
Examples & Transport of POPs
PCBs
Additives in paint and plastics, released into aquatic ecosystem by industrial wastewater
Toxic to fish, causing spawning failure and endocrine disruption
Reproductive failure & cancer in humans
Human exposure comes through animal products
Perchlorates
Given off by rockets, missiles, and fireworks
Especially common near military testing sites or rocket launch pods
Remain in soil and can leach into groundwater or runoff into surface waters
Persistant Organic Pollutants travel long distances through wind & water, impacting ecosystems far away
Wasterwater release from industrial processes, leachate from landfills or improperly buried industrial waste, fertilizer/pesticide production, emissions from burning waste/biomass
Enter soil/water eaten by animals, stored in fat, eaten by humans or taken in via drinking water
Topic 8.8 (Biomagnification)
Bioaccumulation
Absorption and concentration of compounds (especially fat-soluble ones like Persistant Organic Pollutants) in cells & fat tissues of organisms
Because fat-soluble compounds like Persistant Organic Pollutants and methylmercury don’t issolve easily in water, they don’t enter blood easily & don’t leave body in urine easily
Instead they build up in fat tissue
This leads to them building up to reach higher and higher concentrations in the organism over time
Biomagnification
Increasing concentrations of fat-soluble compounds like methylmercury and Persistant Organic Pollutants in each level up the trophic pyramid or food web/chain
Biomagnification begins with Persistant Organic Pollutants or methylmercury in sediments or plants in an ecosystem (phytoplankton, grass)
Primary consumers (zooplankton, bottom feeding fish, insects) take in Persistant Organic Pollutants by eating producers, casuing bioaccumulation of Persistant Organic Pollutants in their tissues
Secondary consumers eat primary consumers and take in the Persistant Organic Pollutants in their tissues
Because of the 10% rule, organisms at each successive trophic level need to eat more and more biomass to recieve enough energy, leading to higher and higher Persistant Organic Pollutant levels over their lifetimes
Large predators like salmon, dolphins, and whales have highest Persistant Organic Pollutant/methylmercury levels
Biomagnification (DDT)
DDT was banned in many developed nations, but still persists in sediments of many bodies of water
Taken in by bottom feeders/zooplankton & biomagnified at higher trophic levels
Reach highest levels in top predators, especially predatory birds like eagles & osprey
Causes thinning of the eggshells in these birds
Linked to massive population decline of bald eagle in United States, which prompted passage of Endangered Species Act (1973)
Biomagnification (methylmercury)
Mercury is emitted from burning coal & by volcanoes, carried by wind, and deposited in water where bacteria convert it into toxic methylmercury
Taken in by phytoplankton & biomagnified at higher trophic levels
Reach highest levels in top predators, tune, sharks, whales
Neurotoxicant: damages the central nervous system of animals
Human exposure to methylmercury & Persistant Organic Pollutants comes from eating large predatory fish like tuna & salmon (and other seafood)
Damage to human nervous system (especially deeloping fetus) and disrupt reproductive system
Topic 8.9 (Solid Waste Disposal)
Solid Waste Types & Sources
Municipal Solid Waste
Solid waste from cities (houselands, businesses, schools, etc.)
Waste “stream” refers to flow of solid waste to recycling centers, landfills, or trah incineration (burning) facilities
Also known as trash, litter, garbage
E-Waste
Old computers, TVs, phones, tablets
Only ~2% of Municipal Solid Waste; considered hazardous waste due to metals like cadmium, lead, mecury, and PBDEs (fireproof chemicals)
Can leach endocrine disrupting chemicals out of landfills if thrown away with regular Municipal Solid Waste (should be disposed of at special facilities that recycle parts)
Sanitary Lanfills
APES lingo for “landfills” or where developed nations dispose of trash; different thant “dumps” which are just areas where trash is dumped, without the features below
Clay/plastic bottom liner: layer of clay/plastic on the bottom of a hole in the ground; prevents pollutants from leaking out into soil/groundwater
Leachate Collection System: System of tubes/pipes at bottom to collect leachate (water draining through waste & carrying pollutants) for treatment & disposal
Methan Recovery System: System of tubes/pipes to collect that methane produced by anaerobic decomposition in the landfill
Methane can be used to generate electricity or heat buildings
Clay Cap: Clay-soil mixture used to cover the landfill once it’s full; keeps out animals, keeps in smell, and allows vegetation to regrow
Landfills Contents & Decomposition
Landfills generally ahve very low rates of decomposition due to low Oxygen Gas, moisture, and organic material combination
Since these 3 factors are rarely present together in landfills, little decomposition occurs and landfills typically remain about the same size as when they were filled
Things that should NOT be landfilled:
Hazardous waste (antifreeze, motor oil, cleaners, electronics, car batteries)
Metals like copper & aluminum (should be recycled)
Old tires; often left in large piles that hold standing water ideal for mosquito breeding
Things that SHOULD be landfilled:
Cardboard/food wrappers that have too much foo resiude & can’t be recycled
Rubber, plastic films/wraps
Sytrofoam
Food, yard waste, and paper can and do go in landfills, but should be recycled or composted
Landfill Issues
Landfills have environmental impacts like groundwater contamination and release of GHGs
Groundwater can be contaminated with heavy metals (lead, merury), acids, medications, and bacteria if leachate leaks through livng into soil/groundwater beneath
Greenhouse gases (Carbon Dioxide and Methane) are released from landfills due to decomposition; both contribute to global warming & climate change
Not In My Back Yard = idea that communities don’t want landfills near them for a number of reasons
Smell & sight
Landfills can attract animals (rats, crows)
Groundwater contamination concerns
Landfills should be located far from river & streams and neighborhoods to avoid water contamination
Landfills are often placed near low-income or minority communities that don’t have the resources or political power to fight against these decisions
Waste Incineration & Ocean Dumping
Waste can be incinerated (burned) to reduce the volume that needs to be landfilled; since most waste (paper, plastic, food) = hydrogen, carbon, and oxygen, it easily combusts at high temperatures
Can reduce volume by 90&, but also releases CO2 and air pollutants (Particulate Matter, Sulfur Oxides, Nitrogen Oxides)
Bottom ash may contain toxic metals (lead, mercury, cadmium) & is storied in ash ponds, then taken to special landfills
Toxic metals can leach out of storage ponds or be released into atmosphere
Can be burned to generate electricity
Illegal ocean dumping occurs in some countries with few environmental regulations or lack of enforcement
Plastic specially collects into large floating garbage patches in the ocean
Can suffocate animals if they ingest (eat) it or entangle them so they can’t fly or swim and may starve
Topic 8.10 (Waste Reduction)
Reduce, Reuse, Recycle
The Three Rs
Reducing consumption si the msot sustainable because it decreases natural resources harvesting and energy inputs to creating, packaging, and shipping goods
Example: metal/reusable water bottle to reduce plastic use
Reusing: the next most sustainable because it doesn’t require additional energy to create a product
Example: Buying second hand clothes, using old wood pallets for furniture, washing plastic takeout food containers and resuing
Recycling: processing and converting solid waste material into new products
Example: Glass being turned into glass again (closed-loop), plastic water bottles being turned into fabric for clothes/jackets (open loop)
Least sustainable of the three Rs due to the amount of energy it rquires to process and convert waste materials
Recycling Pros and Cons
Pros of Recycling
Reduces demand for new materials, specially metals and wood which case habitat destruction & soil erosion when harvested
Reduces energy required to shiw raw materials and produce new products (fewer Fossil Fuel combustion)
Reduces landfill volume, conserving landfill space & reducing need for more landfills
Cons of Recycling
Recycling is costly and still requires significant energy
Cities that offer recycling services need to process, sort, and sell collected materials; prices change rapidly, leading to “recycled” materials often being thrown away
When citizens recycle items that shouldn’t be recycled (wrappers with food, styrofoam, etc.) it increases the cost of cities to sort & process'
Composting
Organic matter (food scraps, paper, yard waste) being decomposed under controlled conditions
Reduces landfill volume and produces rich organic matter that can enhance water holding capacity, nutrient levels of agricultural or garden soil
Produces valuable product to sell (compost)
Reduces the amount of methane released bu anaerobic decomposition of roganic matter in landfills
Should be done with proper mix of “browns” (Carbon) to “greens” (Nitrogen) ~30:1
Should also be aerated and mixed to optimize decomposition (bacteria need Oxygen Gas for decomposition)
Potential drawbacks include the foul smell that can be produced if not properly rotated & aerated and rodents or other pests that may be attracted
E-Waste
Waste from electronics (phones, computers, etc.) that often contain heavy metals (lead, mercury, cadmium)
Can leach these toxic metals into soil & groundwater if disposed of in landfills or open dump
Can be recycled and reused to create new electronics, but often sent to developing nations for recycling due to health hazards, more strict environment & worker protection laws in developing nations
Can be dismantled sold to countries that extract valuable metals (gold, silver, platinum) from motherboards
Often burned or dumped to less strict environment regulatitions or lack of enforcement in developing nations
Waste to Energy
Waste can be incinerated (burned) to reduce the volume & also egnerate electricity; most waste (paper, plastic, food) = hydrogen, carbon, and oxygen so it easily combusts at high temperatures
Same process as burning coal, Natural Gas, biomas
Heat → water → steam → turbine → generator → electricity
Methane gas produced by decomposition in landfill can be collected with pipes & burned to generate electricity
Heat → water → steam → turbine → generator → electricity
Reduces landfill volume
Produces electricity without fracking or mining for Fossil Fuels
Topic 8.11 (Sewage Treatment)
Water Treatment Process
Primary Treatment
Physical removal of large debris (TP, leaves, plastic, sediment) with a screen or gate
Grit chamber allows sediment (sand, gravel) to settle out & be removed
Secondary Treatment
Biological breakdown of organic matter (feces) by bacteria; aerobic process that requires Oxygen Gas
Oxygen Gas is bubbled into aeration tank filled with bacteria that break down organic matter into Carbon Dioxide and nutrients like Nitrogen & Phosphorus
Secondary treatment removes 70% of Phosphorus & 50% of Nitrogen
DOES NOT remove Persistant Organic Pollutants such as medications or pesticides
After primary & secondary treatment, some plants go directly to disinfectant (UV, ozone, chlorine) & discharge into surface water, while some will use tertiary treatment to remove more nutrients before discharge
Tertiary Treatment
Ecological or chemical treatments to reduce pollutants left after primary & secondary (Nitrogen, Phosphorus, bacteria)
Disinfectant
UV light, ozone, or chlorine is used to kill bacteria or other pathogens, such as e. Coli (considered part of tertiary treatment)
Effluent: liquid waste (sewage) discharged into a surface body of water, typically from a wasterwater treatment plant
Sludge: inorganic, solid waste that collects at the bottom of tanks in primary and secondary treatment
Water is spun/pumped to concentrate it further
Dry, remaining physical waste is collected to be put in landfill, burned, or turned into fertilizer pellets
Tertiary Treatment
Tertiary treatment uses chemical filters to remove more of the nitrates & phosphates from secondary treatment discharge
Critical step because effluent that is discharged into surface waters with elevated nitrate/phosphate levels leads to eutrophication
Expensive and not always used
Sewage Treatment Issues
Combine dsewage and stormwater runoff systems can cause wastewater treatment plants to flood during heavy rains, releasing raw sewage into surface waters
Beneficial because it treats stormwater runoof normally, but causes overflow during heavy rains
Raw sewage release contaminates surface waters with:
E. coli
Ammonia
Nitrates
Phosphates
Endocrine disruptors (medications)
Even treated wastewater effluent released into surface water often has elevated Nitrogen/Phosphorus levels and endocrine disruptors (medications passed through the body)
Topic 8.12 (LD50)
Dose Reponse Studies & LD50
Studies that expose an organism to different doses of concentrations of chemical in order to measure the response (effect) of the organism
Independent variable = concentration of the chemical (added to food, water, or air)
Dependent variable = reponse measured in organisms (usually death or impairment)
LD50 refers to the dose or concentration of the chemical that kills 50% of the population being studied (example arsenic LD50 in mice = 13 mg/kg)
LD50 data are usually expressed as:
mass (g, mg)/body unit mass (kg)
ppm - parts per million (in air)
mass/volume (in water of blood)
Topic 8.13 (Dose Response Curve)
Dose Response Curve
The data from a dose response study, graphed with percent mortality or other effect on the y-axis and dose concentration of chemical on x-axis
Lowest dose where an effect (death, paralysis, cancer) starts to occur is called the threshold or toxicity threshold
Dose response curves are usually “S-shaped” - low mortality at low doses, rapid increase in mortality as dose increases, level off near 100% mortality athigh dosage
ED50 & Other Dose Respones
ED50 refers to the dose concetration of a toxin or chemical that causes a non-lethal effect (inferility, paralysis, cancer, etc.) in 50% of the population being tested
Example: the concentration of atrazine in water that causes 50% of the frogs to become infertile
Same general “s-shape” as LD50 dose response curve, but at lower dose concentrations
Dose Response Data & Human Health
Dose-response studies for toxic chemical are not done on humans: data from other mammals (mice, rats) are used to simulate human toxicity
To determine maximum allowable levels for humans, we generally divide LD50 or ED50 dose concentration by 1,000 for extreme caution
Acute vs. Chronic studies: Most dose-response studies are considered acute, since they only measure effects over a short period of time; they’re also isolated to a lab, so they don’t measure ecological effects of organisms dying (trophic cascades)
Chronic studies are longer-term and follow developmental impacts
Example: study of fish from hatchlings to adults to study sexual maturation
Topic 8.14 (Pollution and Human Health)
Routes of Exposure & Synergism
It’s difficult ot establish exactly how toxic differnt pollutants are to humans because we have so many roues of exposure to so many different pollutants, tht studying the effects of just one pollutant is difficult.
Routes of Exposure
Ways that a pollutant enters the human body
Lead → water pipes & paint chips
Mercury → seafood (tuna)
Carbon Monoxide → indoor biomass combustion
Particulate Matter → pollen, dust, etc.
Arsenic → rice, groundwater
Synergism
The interaction of two or more substances to cause an effect great than each of them individually
Example: Asthma caused by Particulate Matter from coal PPs and COVID-19 damaging lungs
Carcinogenic effect of abestos combined with lung damage from smoking
Synergisms make it especially ahrd to pinpoint the exact effects of one specifc pollutant on humans
Dysentery
Bacterial infection caused by food or water being contaminated with feces (often from sewage release into rivers & streams used for drinking water)
Causes intestinal swelling and can result in blood in feces
Results in severe dehydration due to diarrhea (fluid loss)
Kills 1.1 million people annually, mostly in developing countries wiht poor sanitationa nd limited access to water filtration
Can be treated with antibiotics that kill the bacteria causing the infection and access to treated/filtered water that can rehydrate
Mesothelioma (asbestos)
A type of cancerous tumor caused by exposure to asbestos, primarily affecting the lining (epithelium) of the respiratory tract, heart, or abdominal cavity
Asbestos exposure comes primarily from old insulation materials used in attics, ceiling and flooring boards; when the insulation becomes physically disturbed, asbestos particles are released into the air & inhaled
Removal of asbestos-containing insulation material should be done by professionals with proper training and equipment that protects them from inhaling the asbestos
The area where asbestos is removed from should be sealed off from other areas in the building and well-ventilated during the removal process
Insulation without asbestos should be used to replace it
Troposhperic Ozone (O3)
Worsens respiratory conditions like asthma, emphysema, broncities, COPD
limits overall lung function
irritates muscles or respiratory tract causing constriction of airways & shortness of breath
irritates eyes
Sources: photochemical breakdown of Nitrogen Dioxide (car exhaust, coal & Natural Gas combustion)
ONLY HARMFUL IN TROPOSPHERE (beneficial in stratosphere)
Topic 8.15 (Pathogens & Infectious Diseases)
Pathogens & Vectors
Pathogen
A living organism (virus, bacteria, fungus, protist, worm) that causes an infectious disease
Infectious diseases are not transmissible (heart disease, asthma, cancer, diabetes)
Pathogens adapt and evolve to take advantage of humans as host for their reporduction and spread (Covid-19 is a SARS-associated coronavirus that evolved to become especially effective at surviving and reproducing in humans)
Vectors
A living organism (rat, mosquito) that carry and transmit infectious pathogens to other organisms
Climate change is shifting equatorial climate zones north and south away from the equator; this brings warmer temperatures to subtropical and temperate regions
Warmer temperatures allow pathogens and their vectors (mosquitos) to spread north & south to parts ot the world previously too cold
Many pathogenic bacteria and viruses survive and replicate better in warmer weather
Infectious Disease & Development
Less developed, poorer countries typically have higher rates of infectious disease
Less sanitary waste disposal; pathogens can reproduce in open waste areas where children may play or animals may scavenge & pass to humans
Less access to healthcare facilities and antibiotic medication to treat infectious diseases caused by bacteria & other pathogens
Lack of treatment/filtration for drinking water & sewage treatment exposes people to bacterial and viral pathogens in water, often from human waste
Tropical climates *& more open-air living can expose people to vectors like mosquitoes; less money fro vector eradication (spraying mosquito breeidng grounds)
Plague
Bacterial (pathogen) infection transmitted by fleas (vector) that attach to mice & rats (vectors as well)
Transmitted by fleat bite, rodent contact or contaminated human fluids
AKA “bubonic” or “black” plague; modern antiobiotics are highly effective against it, but some isolated instances still occur
Tuberculosis (TB)
Bacterial (pathogen) infection that targets the lungs
Transmitted by breathing bacteria from body fluids (respiratory droplets) of an infected person, which can linger in air for hours
Causes night sweats, fever, coughing blood; treatable in developed nations with access to powerful antibiotics
Leading cause of deaht by disease in the developin world ~ 9 million cases per year & 2 million deaths (for comparison ~ 2.8 million global deaths from Covid-19)
Malaria
Parasitic protist (pathogen) infection caused by bite from infected mosquitoes (vector)
Most common in sub-Saharan Africa (& other tropical regions of Middle East, Asisa, South & Central America; recurring flu-like symptoms; kills mostly children under 5)
Can be combated with insecticide spraying that kills mosquitoes; US eradicated in 1951
West Nile
Virus (pathogen) infection caused by bite from infected mosquitoes (vector)
Birds are the main host, but the virus can be transmitted by mosquitoes that bite infected birds and then bite humans
Causes brain inflammation, which can be fatal
Zika Vius
Virus (pathogen) infection caused by bite from infected mosquitoes (vector) & sexual contact
Causes babies to be born with abnormally small heads and damaged brains; can be passed from mother to infant
No known treatment currently, so prevention is focused on eliminating mosquito populations
SARS (Severe Acute Respiratory Syndrome)
Coronavirus (pathogen) infection caused by respiratory droplets from infected person
Primarily transmitted by touching or inhaling fluids from an infected person
Causes a form of pneumonia
Initial outbreak was in Southeast Asia
SARS-CoV-2 is the virus that causes the disease COVID-19
MERS (Middle East Respiratory Syndrome)
Virus (pathogen) respiratory infection transmitted from animals to humans
Originated on Arabian peninsula
Cholera
Bacterial (pathogen) infection caused by drinking infected water
Vomiting, muscle cramps and diarrhea; can cause severe dehydration
Can be introduced by water contmainated with human feces or undercooked seafood
UNIT 9
Topic 9.5 (Global Climate Change)